| Param | Original file | Final file |
|---|---|---|
| Filename | modeM0/AS1A09_038T46_9000004002cztM0_level2.fits | modeM0/AS1A09_038T46_9000004002cztM0_level2_quad_clean.evt |
| Size (bytes) | 39,003,840 | 14,823,360 |
| Size | 37.2 MB | 14.1 MB |
| Events in quadrant A | 250,928 | 61,446 |
| Events in quadrant B | 219,216 | 17,698 |
| Events in quadrant C | 244,208 | 57,531 |
| Events in quadrant D | 208,824 | 52,820 |
| Mode M9 | |||
|---|---|---|---|
| Quadrant | BADHDUFLAG | Total packets | Discarded packets |
| A | 0 | 14 | 0 |
| B | 0 | 14 | 0 |
| C | 0 | 14 | 0 |
| D | 0 | 14 | 0 |
| Mode M0 | |||
|---|---|---|---|
| Quadrant | BADHDUFLAG | Total packets | Discarded packets |
| A | 0 | 7785 | 0 |
| B | 0 | 11751 | 0 |
| C | 0 | 7747 | 0 |
| D | 0 | 9058 | 0 |
| Mode SS | |||
|---|---|---|---|
| Quadrant | BADHDUFLAG | Total packets | Discarded packets |
| A | 0 | 74 | 0 |
| B | 0 | 76 | 0 |
| C | 0 | 74 | 0 |
| D | 0 | 74 | 0 |
| Quadrant | Total seconds | Saturated seconds | Saturation percentage |
|---|---|---|---|
| A | 3661 | 34 | 0.928708% |
| B | 3650 | 584 | 16.000000% |
| C | 3660 | 64 | 1.748634% |
| D | 3622 | 86 | 2.374379% |
Noise dominated data is calculated using 1-second bins in cleaned event files. If a bin has >2000 counts, and if more than 50% of those come from <1% of pixels, then it is considered to be noise-dominated and hence unusable.
| Quadrant | # 1 sec bins | Bins with >0 counts | Bins with >2000 counts | High rate bins dominated by noise | Noise dominated (total time) | Noise dominated (detector-on time) | Marked lightcurve |
|---|---|---|---|---|---|---|---|
| A | 4919 | 3702 | 0 | 0 | 0.00% | 0.00% |  |
| B | 4918 | 3676 | 0 | 0 | 0.00% | 0.00% |  |
| C | 4918 | 3694 | 0 | 0 | 0.00% | 0.00% | 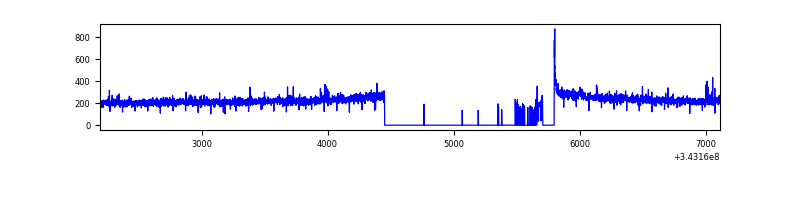 |
| D | 4918 | 3629 | 0 | 0 | 0.00% | 0.00% |  |
Top three noisy pixels from each quadrant. If the there are fewer than three noisy pixels in the level2.evt file, extra rows are filled as -1
| Pixel properties | Quadrant properties | ||||||
|---|---|---|---|---|---|---|---|
| Quadrant | DetID | PixID | Counts | Sigma | Mean | Median | Sigma |
| A | 0 | 29 | 247 | 10.49 | 65 | 62 | 17.6 |
| A | 9 | 19 | 204 | 8.05 | 65 | 62 | 17.6 |
| A | 7 | 110 | 196 | 7.6 | 65 | 62 | 17.6 |
| B | 2 | 9 | 186 | 9.81 | 57 | 55 | 13.3 |
| B | 14 | 254 | 148 | 6.97 | 57 | 55 | 13.3 |
| B | 3 | 159 | 145 | 6.74 | 57 | 55 | 13.3 |
| C | 1 | 80 | 177 | 6.43 | 64 | 61 | 18.0 |
| C | 12 | 241 | 174 | 6.26 | 64 | 61 | 18.0 |
| C | 1 | 81 | 174 | 6.26 | 64 | 61 | 18.0 |
| D | 3 | 14 | 163 | 6.32 | 59 | 54 | 17.3 |
| D | 15 | 94 | 159 | 6.09 | 59 | 54 | 17.3 |
| D | 7 | 3 | 154 | 5.8 | 59 | 54 | 17.3 |
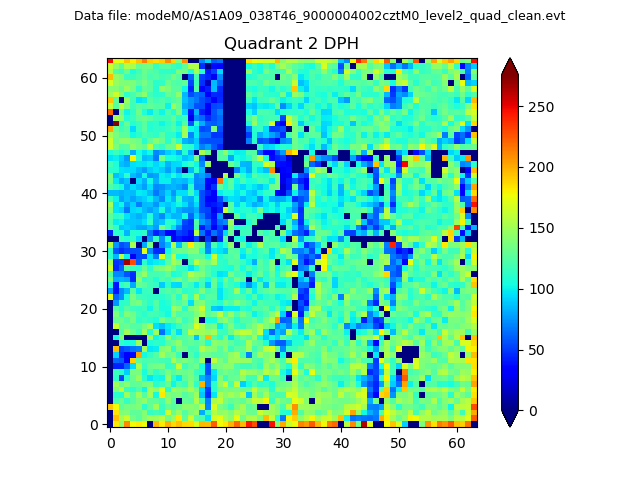
Histogram calculated using DETX and DETY for each event in the final _common_clean file
| Quadrant A |  |
 |
Quadrant B |
|---|---|---|---|
| Quadrant D | 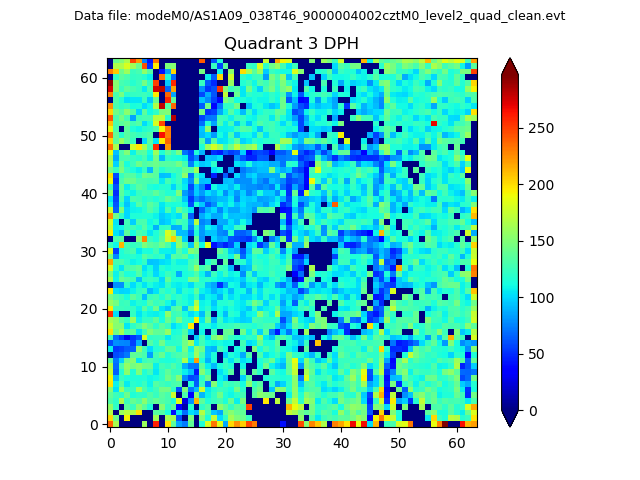 |
 |
Quadrant C |
| Plot type | Count rate plots | Images |
|---|---|---|
| Comparison with Poisson distribution Blue bars denote a histogram of data divided into 1 sec bins. Red curve is a Poisson curve with rate = median count rate of data. |
 |
 |
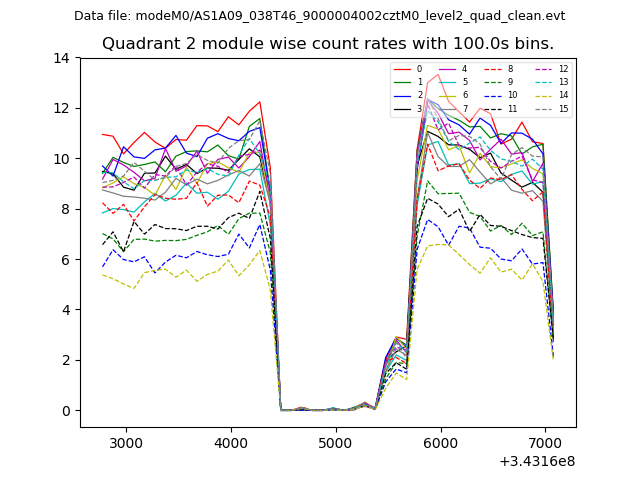
| Quadrant-wise count rates Data is divided into 100 sec bins |
 |
|
| Module-wise count rates for Quadrant A Data is divided into 100 sec bins |
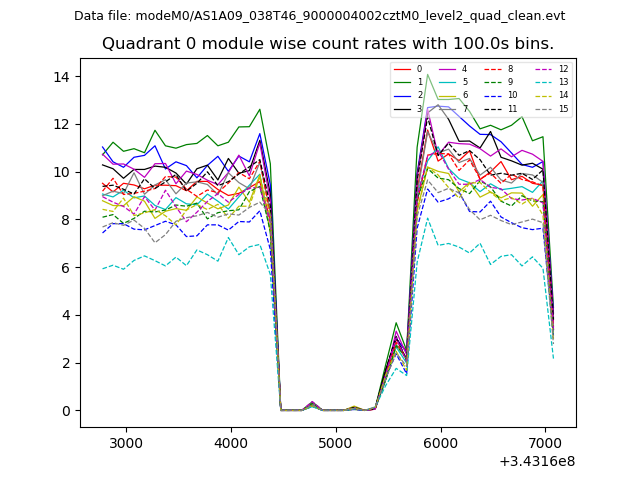 |
 |
| Module-wise count rates for Quadrant B Data is divided into 100 sec bins |
 |
 |
| Module-wise count rates for Quadrant C Data is divided into 100 sec bins |
 |
 |
| Module-wise count rates for Quadrant D Data is divided into 100 sec bins |
 |
 |
| Parameter | Plot |
|---|---|
| CZT HV Monitor |  |
| D_VDD | 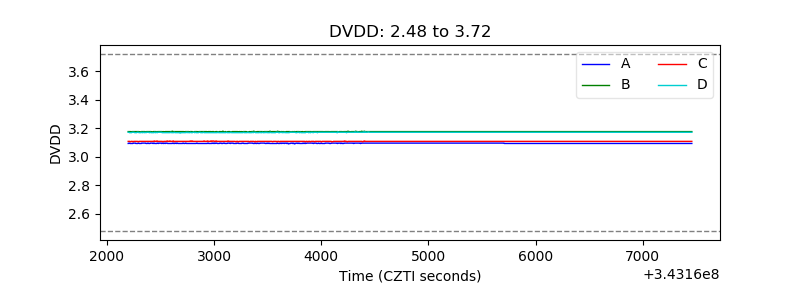 |
| Temperature 1 |  |
| Veto HV Monitor |  |
| Veto LLD |  |
| Alpha Counter |  |
| _CPM_Rate |  |
| CZT Counter |  |
| +2.5 Volts monitor |  |
| +5 Volts monitor |  |
| _ROLL_ROT |  |
| _Roll_DEC |  |
| _Roll_RA |  |
| Veto Counter |  |