| Param | Original file | Final file |
|---|---|---|
| Filename | modeM0/AS1A09_038T46_9000004002_27763cztM0_level2.evt | modeM0/AS1A09_038T46_9000004002_27763cztM0_level2_quad_clean.evt |
| Size (bytes) | 304,151,040 | 74,715,840 |
| Size | 290.1 MB | 71.3 MB |
| Events in quadrant A | 1,832,109 | 525,388 |
| Events in quadrant B | 3,136,460 | 490,346 |
| Events in quadrant C | 1,839,766 | 505,419 |
| Events in quadrant D | 2,159,214 | 488,588 |
| Mode M9 | |||
|---|---|---|---|
| Quadrant | BADHDUFLAG | Total packets | Discarded packets |
| A | 0 | 14 | 0 |
| B | 0 | 14 | 0 |
| C | 0 | 14 | 0 |
| D | 0 | 14 | 0 |
| Mode M0 | |||
|---|---|---|---|
| Quadrant | BADHDUFLAG | Total packets | Discarded packets |
| A | 0 | 7611 | 0 |
| B | 0 | 11599 | 0 |
| C | 0 | 7572 | 0 |
| D | 0 | 8717 | 0 |
| Quadrant | Total seconds | Saturated seconds | Saturation percentage |
|---|---|---|---|
| A | 3574 | 34 | 0.951315% |
| B | 3574 | 584 | 16.340235% |
| C | 3573 | 63 | 1.763224% |
| D | 3573 | 53 | 1.483347% |
Noise dominated data is calculated using 1-second bins in cleaned event files. If a bin has >2000 counts, and if more than 50% of those come from <1% of pixels, then it is considered to be noise-dominated and hence unusable.
| Quadrant | # 1 sec bins | Bins with >0 counts | Bins with >2000 counts | High rate bins dominated by noise | Noise dominated (total time) | Noise dominated (detector-on time) | Marked lightcurve |
|---|---|---|---|---|---|---|---|
| A | 4919 | 3575 | 4 | 4 | 0.08% | 0.11% | 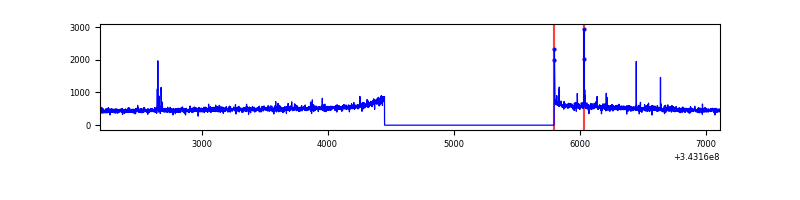 |
| B | 4918 | 3574 | 485 | 485 | 9.86% | 13.57% | 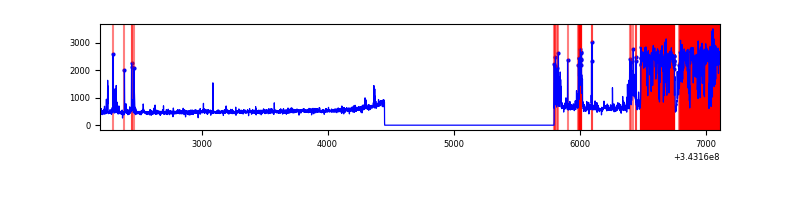 |
| C | 4918 | 3574 | 0 | 0 | 0.00% | 0.00% | 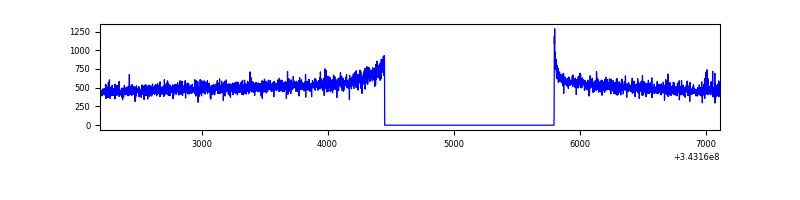 |
| D | 4918 | 3574 | 42 | 42 | 0.85% | 1.18% | 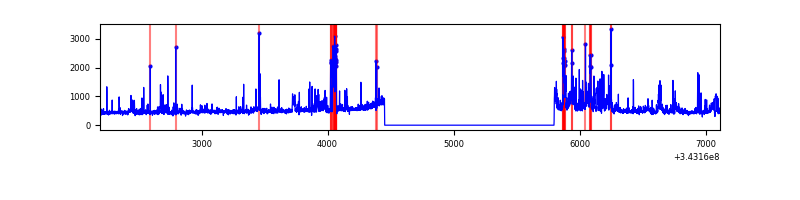 |
Top three noisy pixels from each quadrant. If the there are fewer than three noisy pixels in the level2.evt file, extra rows are filled as -1
| Pixel properties | Quadrant properties | ||||||
|---|---|---|---|---|---|---|---|
| Quadrant | DetID | PixID | Counts | Sigma | Mean | Median | Sigma |
| A | 13 | 248 | 15699 | 162.2 | 466 | 458 | 94.0 |
| A | 8 | 192 | 8235 | 82.76 | 466 | 458 | 94.0 |
| A | 14 | 235 | 7930 | 79.52 | 466 | 458 | 94.0 |
| B | 3 | 64 | 1172660 | 14459.73 | 435 | 426 | 81.1 |
| B | 10 | 245 | 185680 | 2285.14 | 435 | 426 | 81.1 |
| B | 0 | 190 | 31449 | 382.67 | 435 | 426 | 81.1 |
| C | 14 | 238 | 72300 | 687.77 | 448 | 450 | 104.5 |
| C | 3 | 233 | 14221 | 131.82 | 448 | 450 | 104.5 |
| C | 10 | 22 | 5708 | 50.33 | 448 | 450 | 104.5 |
| D | 1 | 52 | 370991 | 3492.22 | 446 | 434 | 106.1 |
| D | 2 | 250 | 53404 | 499.2 | 446 | 434 | 106.1 |
| D | 7 | 69 | 28718 | 266.56 | 446 | 434 | 106.1 |
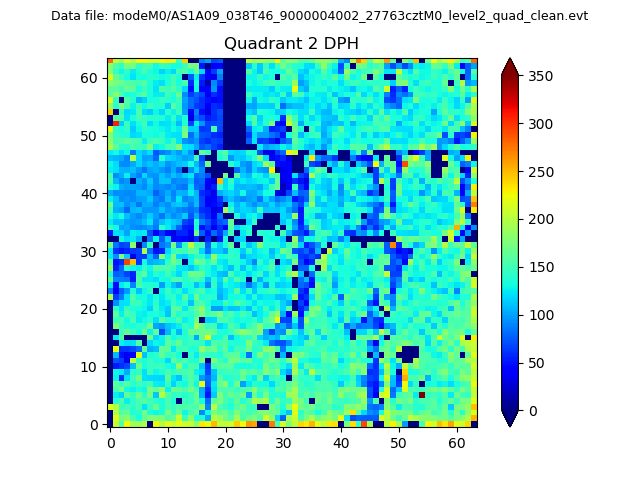
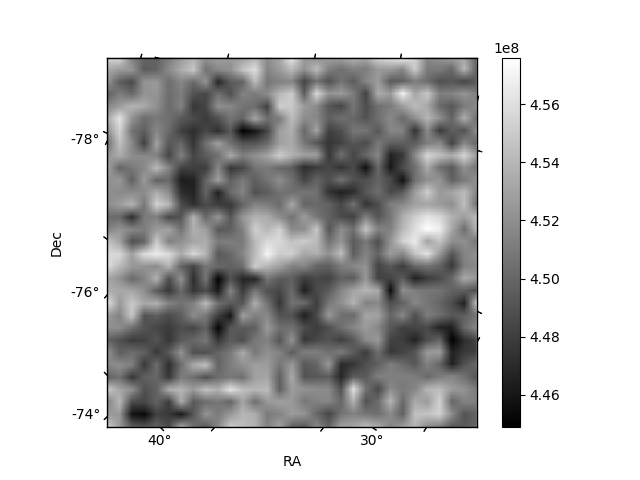
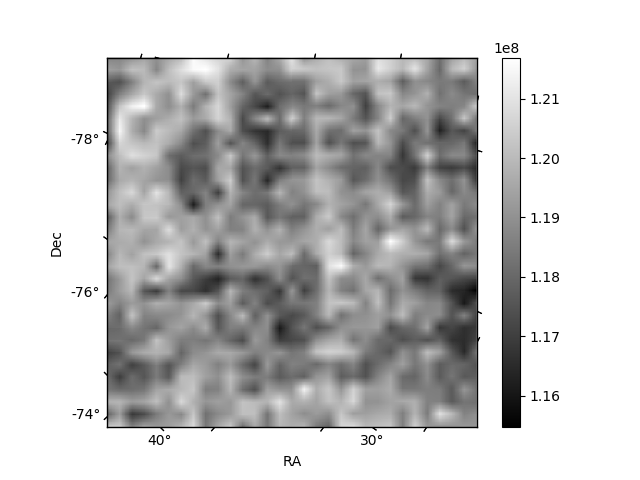
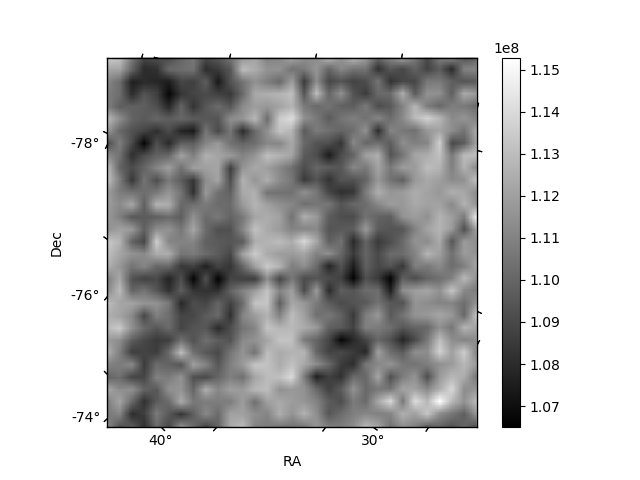
Histogram calculated using DETX and DETY for each event in the final _common_clean file
| Quadrant A | 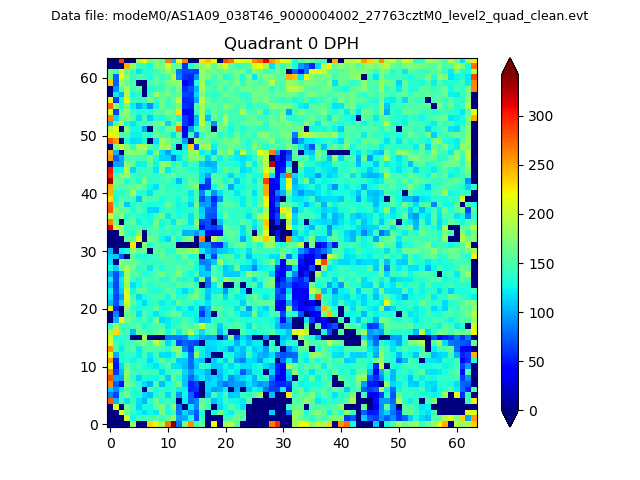 |
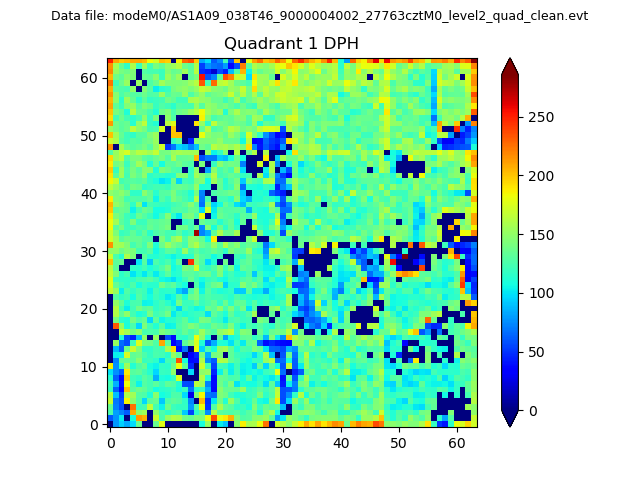 |
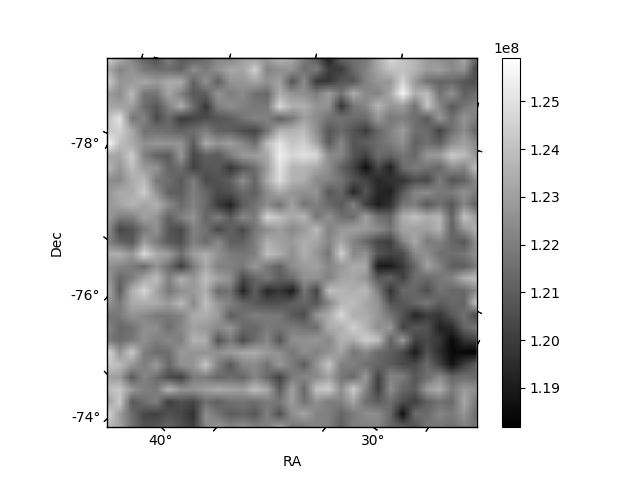
Quadrant B |
|---|---|---|---|
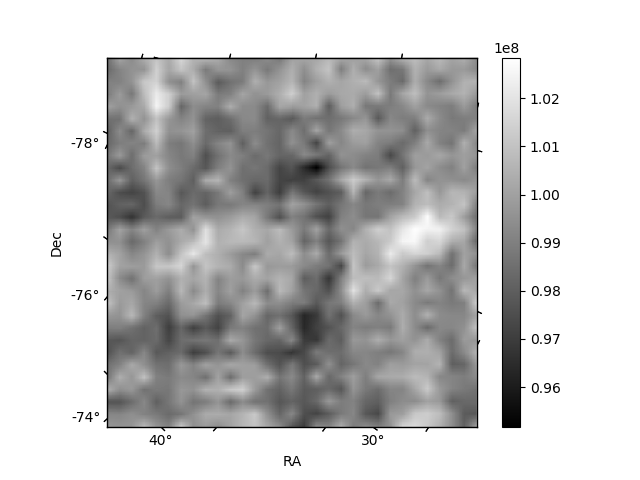
| Quadrant D | 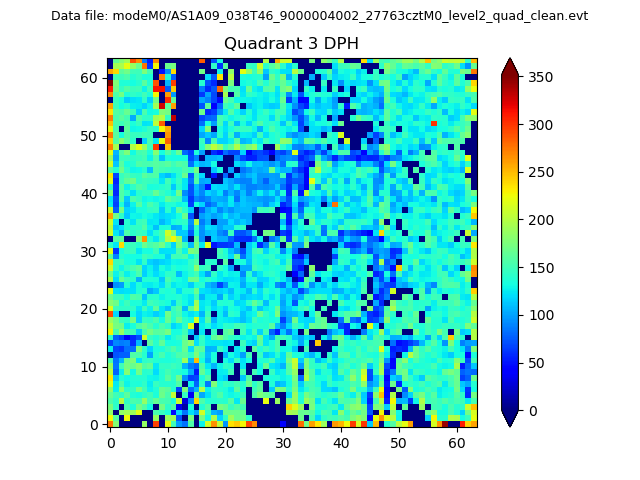 |
 |
Quadrant C |
| Plot type | Count rate plots | Images |
|---|---|---|
| Comparison with Poisson distribution Blue bars denote a histogram of data divided into 1 sec bins. Red curve is a Poisson curve with rate = median count rate of data. |
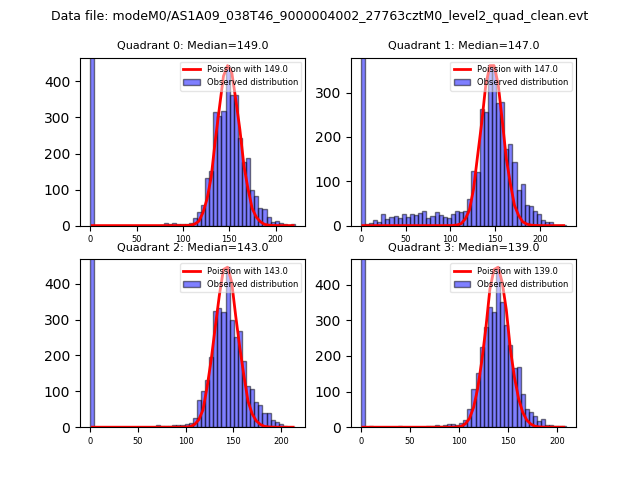 |
 |
| Quadrant-wise count rates Data is divided into 100 sec bins |
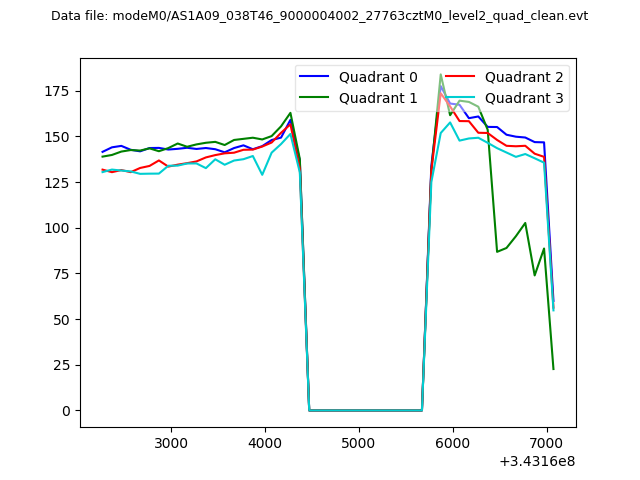 |
|
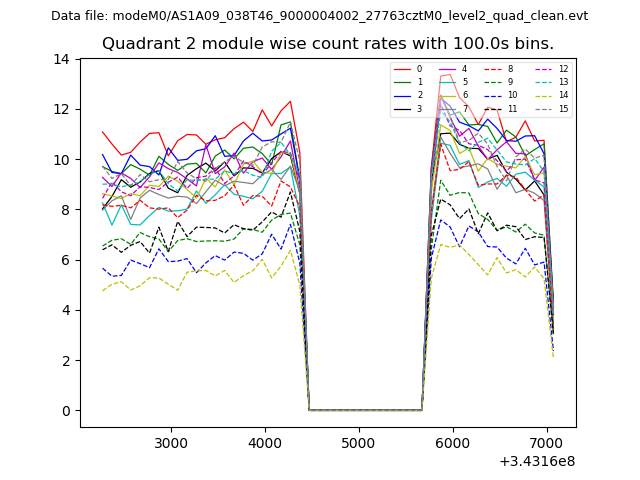
| Module-wise count rates for Quadrant A Data is divided into 100 sec bins |
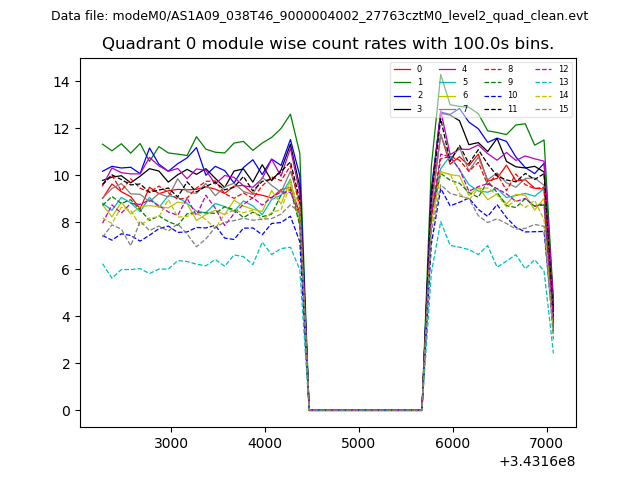 |
 |
| Module-wise count rates for Quadrant B Data is divided into 100 sec bins |
 |
 |
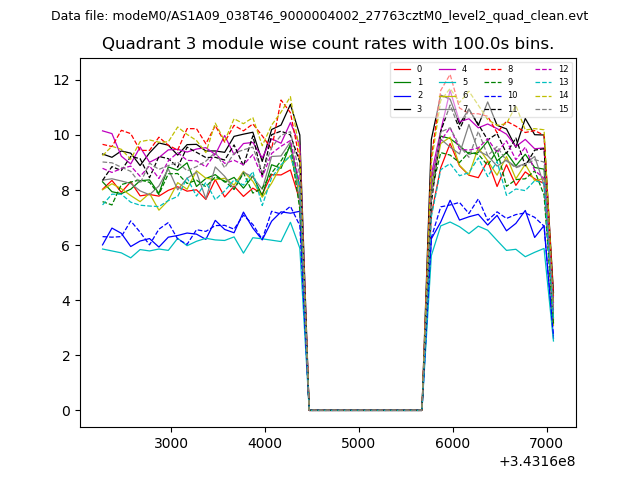
| Module-wise count rates for Quadrant C Data is divided into 100 sec bins |
 |
 |
| Module-wise count rates for Quadrant D Data is divided into 100 sec bins |
 |
 |
| Parameter | Plot |
|---|---|
| CZT HV Monitor | 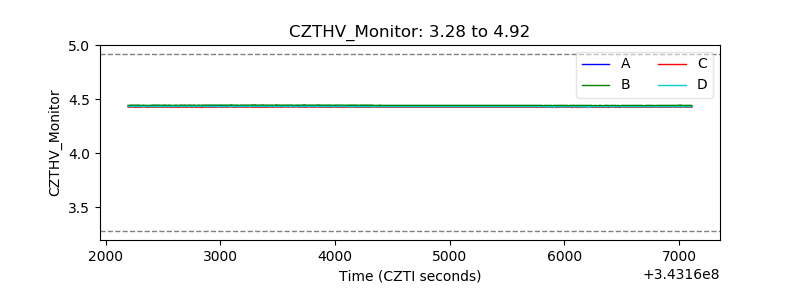 |
| D_VDD | 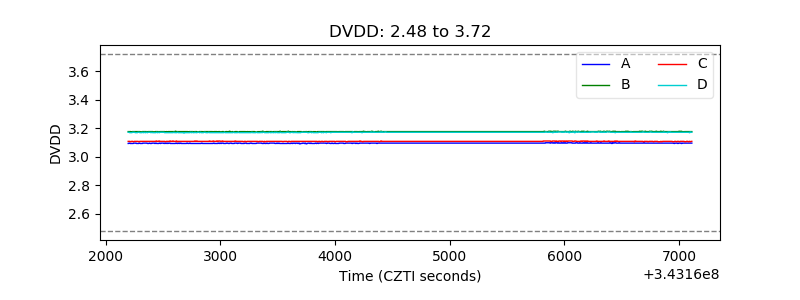 |
| Temperature 1 | 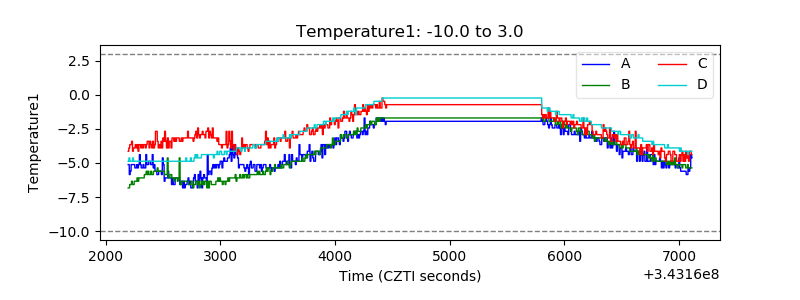 |
| Veto HV Monitor | 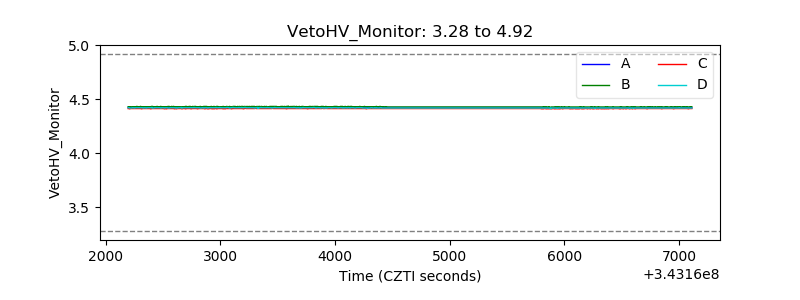 |
| Veto LLD | 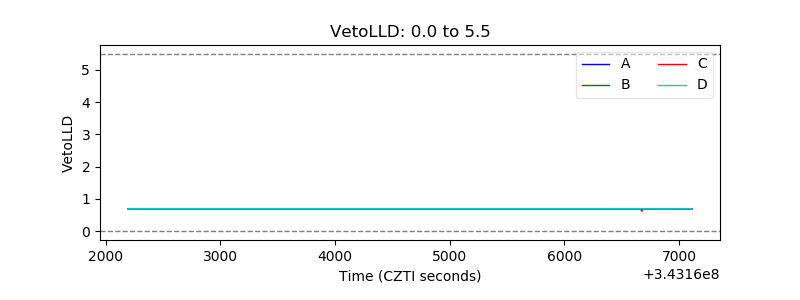 |
| Alpha Counter | 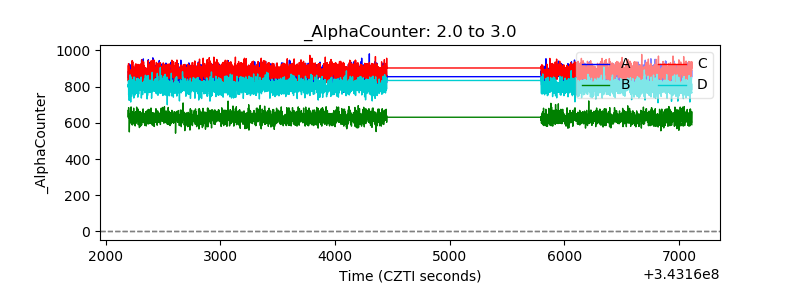 |
| _CPM_Rate |  |
| CZT Counter | 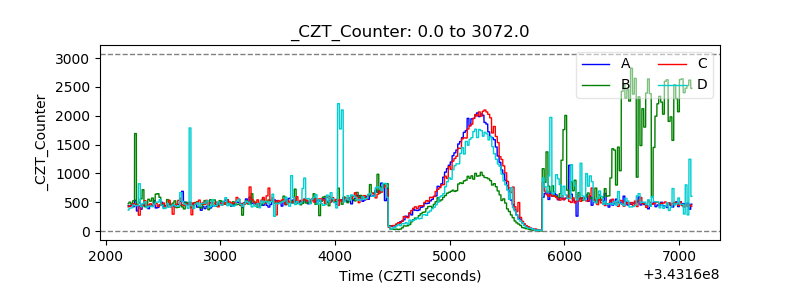 |
| +2.5 Volts monitor |  |
| +5 Volts monitor |  |
| _ROLL_ROT | 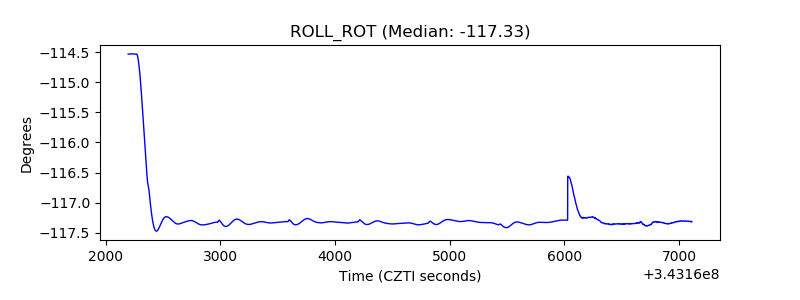 |
| _Roll_DEC | 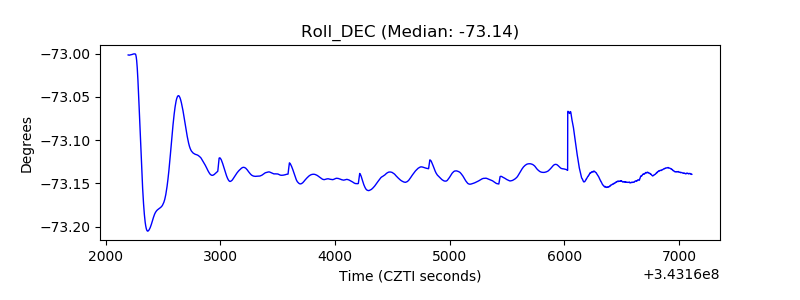 |
| _Roll_RA | 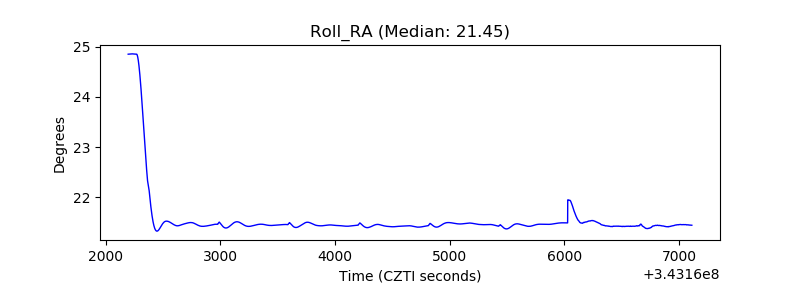 |
| Veto Counter | 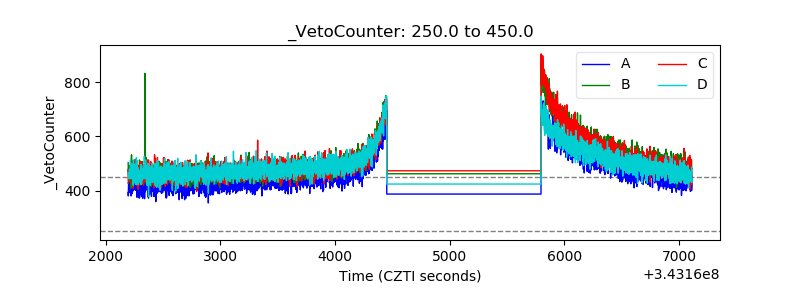 |