| Param | Original file | Final file |
|---|---|---|
| Filename | modeM0/AS1A09_038T46_9000004002_27764cztM0_level2.evt | modeM0/AS1A09_038T46_9000004002_27764cztM0_level2_quad_clean.evt |
| Size (bytes) | 179,285,760 | 35,487,360 |
| Size | 171.0 MB | 33.8 MB |
| Events in quadrant A | 849,298 | 258,050 |
| Events in quadrant B | 2,411,407 | 211,024 |
| Events in quadrant C | 830,759 | 247,414 |
| Events in quadrant D | 1,223,282 | 235,721 |
| Mode M9 | |||
|---|---|---|---|
| Quadrant | BADHDUFLAG | Total packets | Discarded packets |
| A | 0 | 5 | 0 |
| B | 0 | 6 | 0 |
| C | 0 | 6 | 0 |
| D | 0 | 6 | 0 |
| Mode M0 | |||
|---|---|---|---|
| Quadrant | BADHDUFLAG | Total packets | Discarded packets |
| A | 0 | 3557 | 0 |
| B | 0 | 8348 | 0 |
| C | 0 | 3473 | 0 |
| D | 0 | 4746 | 0 |
| Quadrant | Total seconds | Saturated seconds | Saturation percentage |
|---|---|---|---|
| A | 1662 | 11 | 0.661853% |
| B | 1662 | 649 | 39.049338% |
| C | 1662 | 9 | 0.541516% |
| D | 1662 | 34 | 2.045728% |
Noise dominated data is calculated using 1-second bins in cleaned event files. If a bin has >2000 counts, and if more than 50% of those come from <1% of pixels, then it is considered to be noise-dominated and hence unusable.
| Quadrant | # 1 sec bins | Bins with >0 counts | Bins with >2000 counts | High rate bins dominated by noise | Noise dominated (total time) | Noise dominated (detector-on time) | Marked lightcurve |
|---|---|---|---|---|---|---|---|
| A | 1662 | 1662 | 4 | 4 | 0.24% | 0.24% | 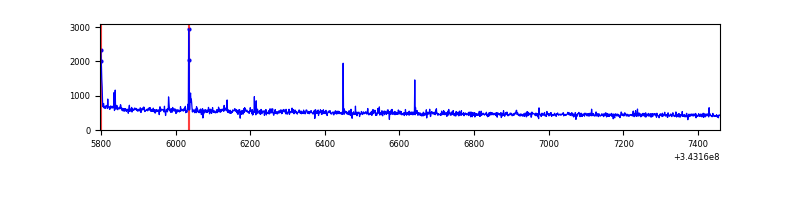 |
| B | 1662 | 1662 | 573 | 573 | 34.48% | 34.48% | 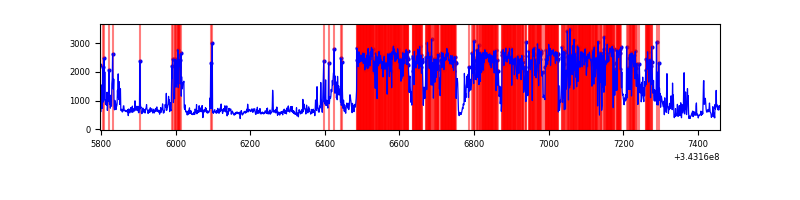 |
| C | 1662 | 1662 | 0 | 0 | 0.00% | 0.00% | 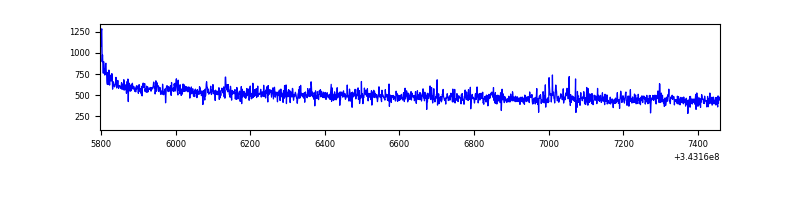 |
| D | 1662 | 1662 | 45 | 45 | 2.71% | 2.71% | 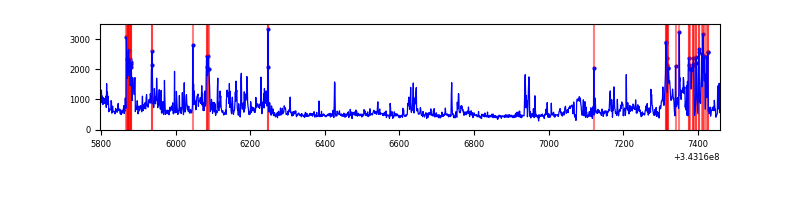 |
Top three noisy pixels from each quadrant. If the there are fewer than three noisy pixels in the level2.evt file, extra rows are filled as -1
| Pixel properties | Quadrant properties | ||||||
|---|---|---|---|---|---|---|---|
| Quadrant | DetID | PixID | Counts | Sigma | Mean | Median | Sigma |
| A | 13 | 248 | 15485 | 338.67 | 214 | 210 | 45.1 |
| A | 8 | 192 | 7848 | 169.35 | 214 | 210 | 45.1 |
| A | 13 | 254 | 3295 | 68.4 | 214 | 210 | 45.1 |
| B | 3 | 64 | 1376598 | 39451.27 | 180 | 177 | 34.9 |
| B | 10 | 245 | 278158 | 7967.55 | 180 | 177 | 34.9 |
| B | 0 | 190 | 22589 | 642.38 | 180 | 177 | 34.9 |
| C | 14 | 238 | 32247 | 675.22 | 201 | 202 | 47.5 |
| C | 3 | 233 | 9991 | 206.26 | 201 | 202 | 47.5 |
| C | 10 | 22 | 2897 | 56.79 | 201 | 202 | 47.5 |
| D | 1 | 52 | 359586 | 7305.33 | 197 | 192 | 49.2 |
| D | 2 | 250 | 52948 | 1072.36 | 197 | 192 | 49.2 |
| D | 7 | 69 | 29338 | 592.44 | 197 | 192 | 49.2 |
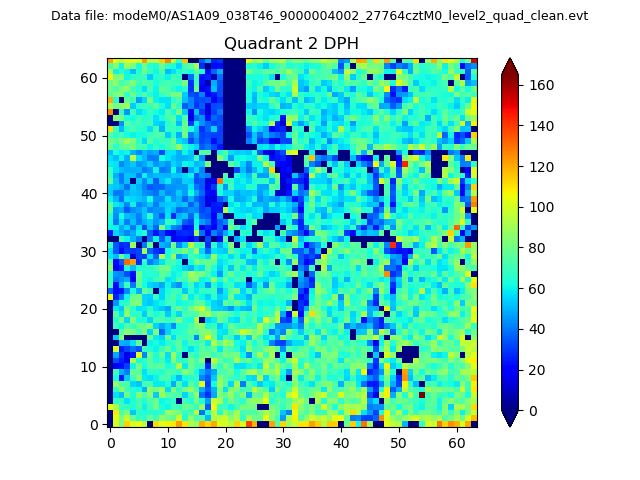
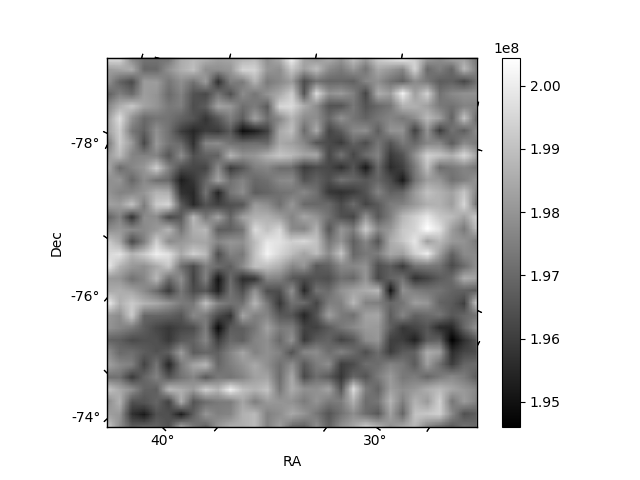
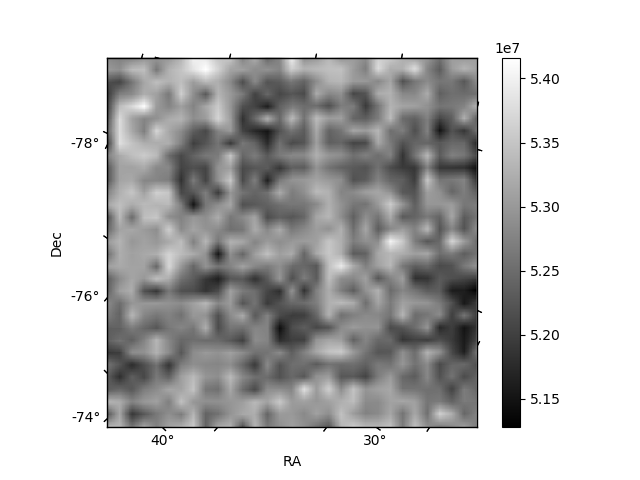
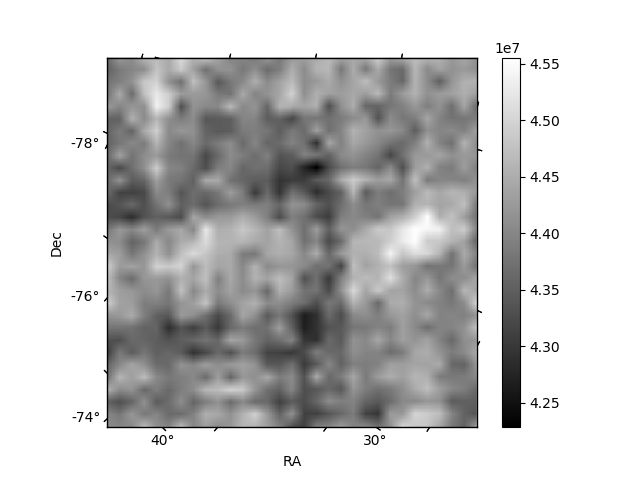
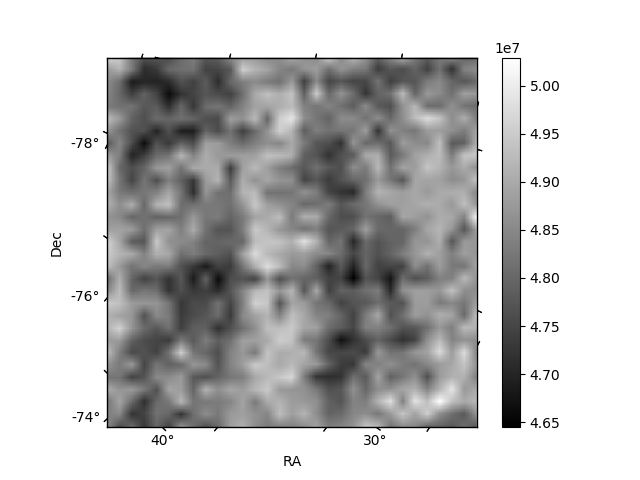
Histogram calculated using DETX and DETY for each event in the final _common_clean file
| Quadrant A | 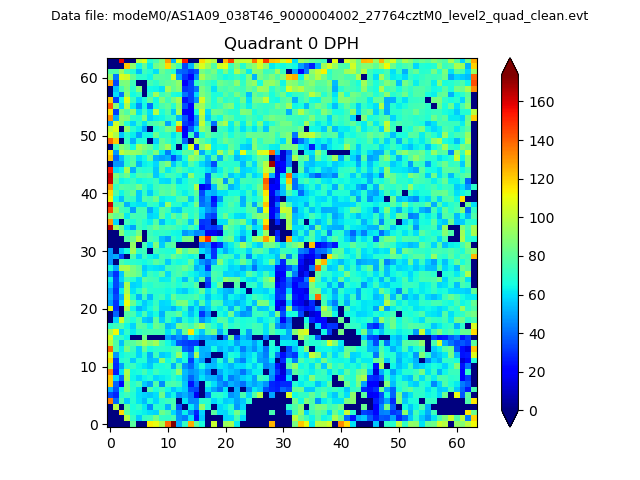 |
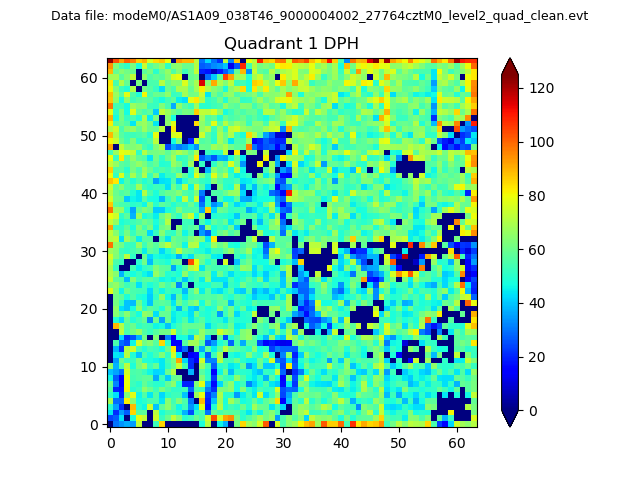 |
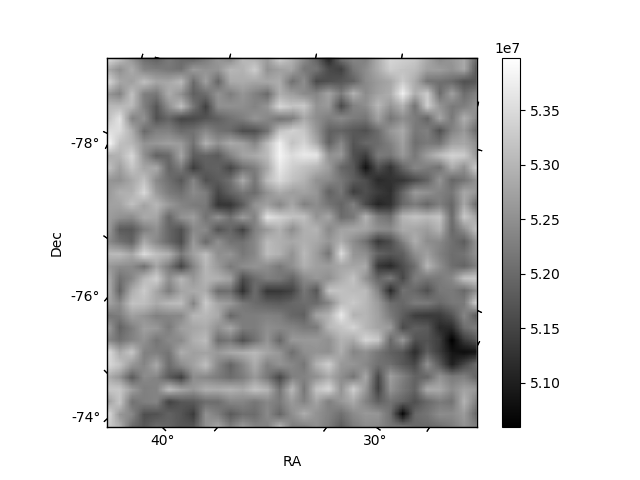
Quadrant B |
|---|---|---|---|
| Quadrant D | 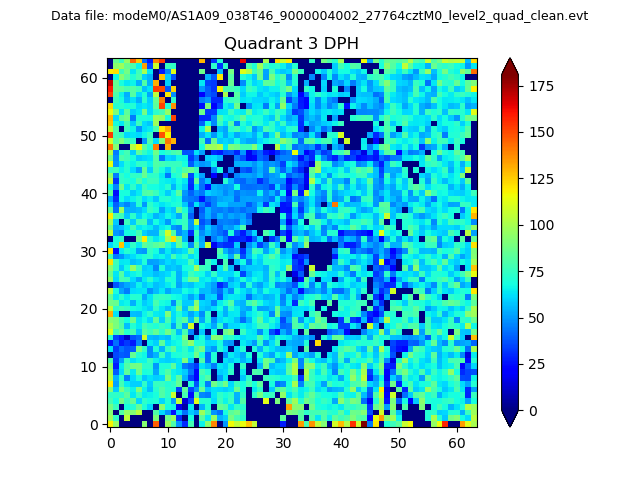 |
 |
Quadrant C |
| Plot type | Count rate plots | Images |
|---|---|---|
| Comparison with Poisson distribution Blue bars denote a histogram of data divided into 1 sec bins. Red curve is a Poisson curve with rate = median count rate of data. |
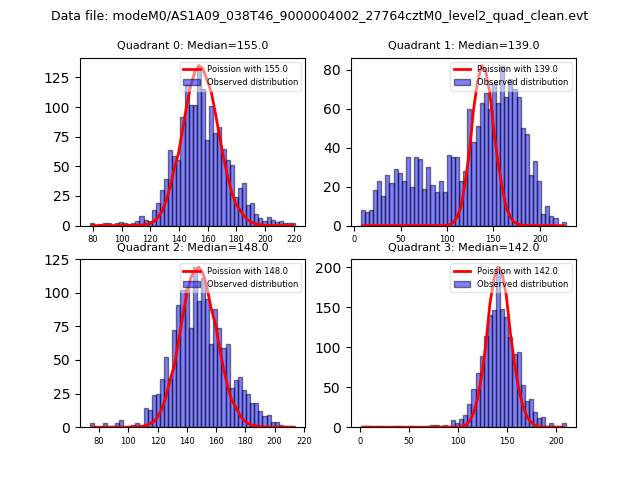 |
 |
| Quadrant-wise count rates Data is divided into 100 sec bins |
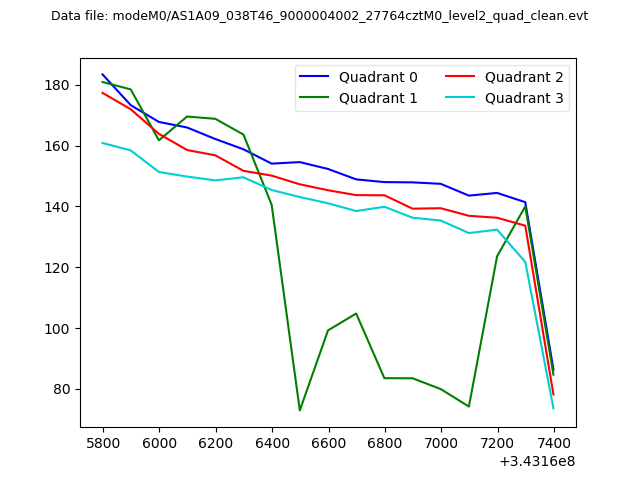 |
|
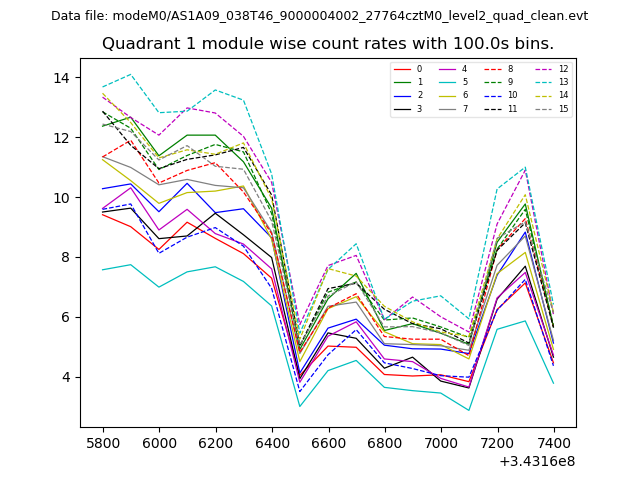
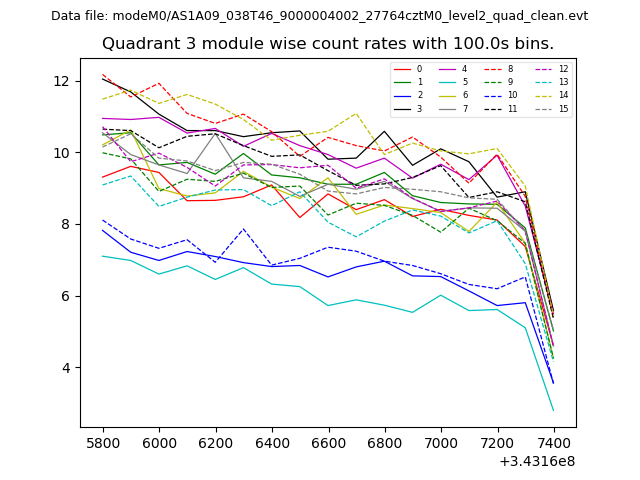
| Module-wise count rates for Quadrant A Data is divided into 100 sec bins |
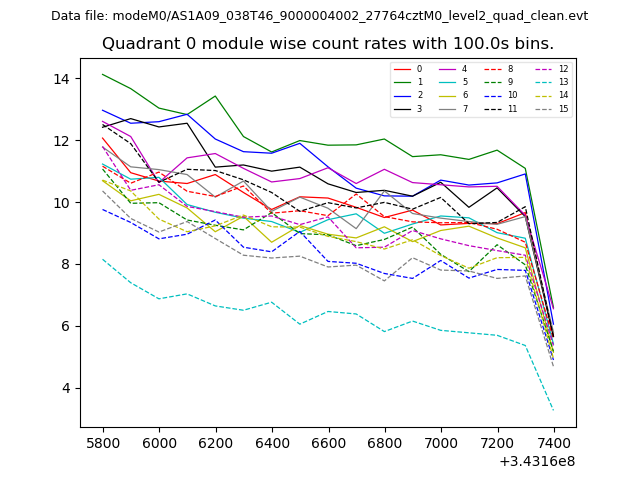 |
 |
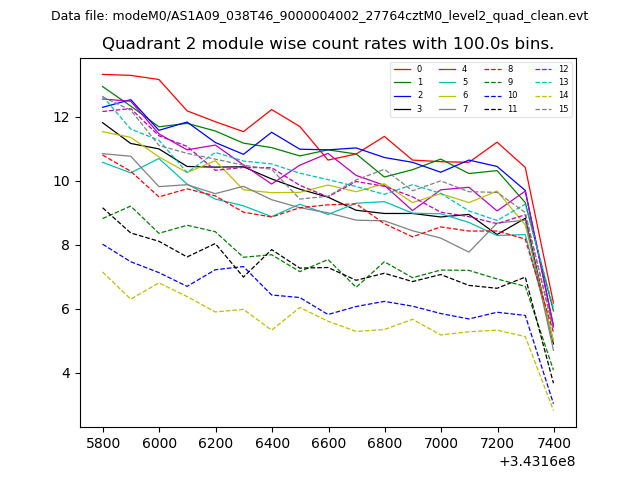
| Module-wise count rates for Quadrant B Data is divided into 100 sec bins |
 |
 |
| Module-wise count rates for Quadrant C Data is divided into 100 sec bins |
 |
 |
| Module-wise count rates for Quadrant D Data is divided into 100 sec bins |
 |
 |
| Parameter | Plot |
|---|---|
| CZT HV Monitor | 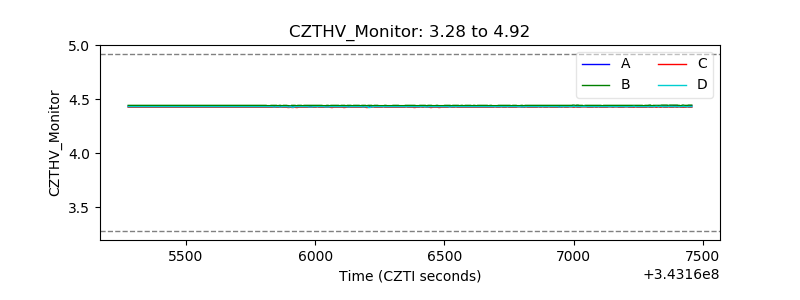 |
| D_VDD | 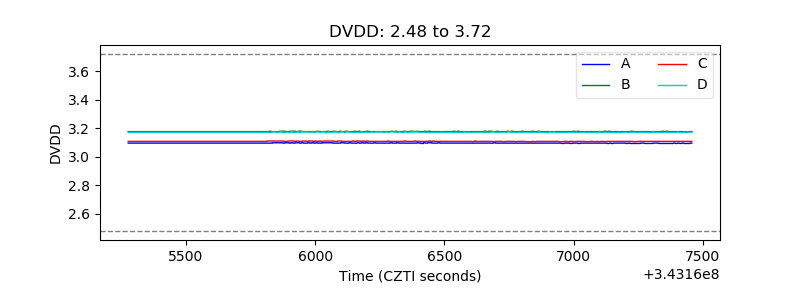 |
| Temperature 1 | 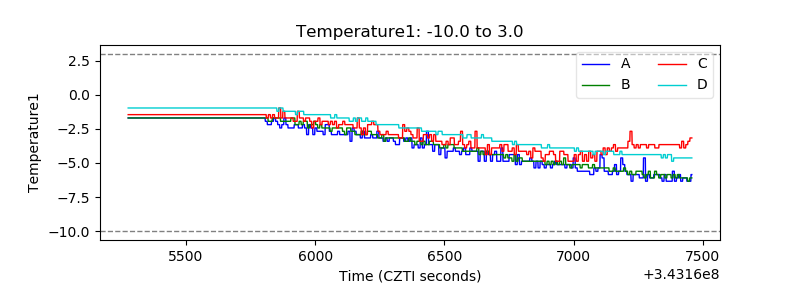 |
| Veto HV Monitor | 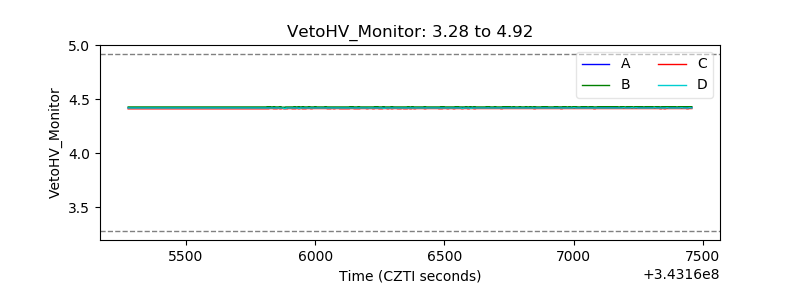 |
| Veto LLD | 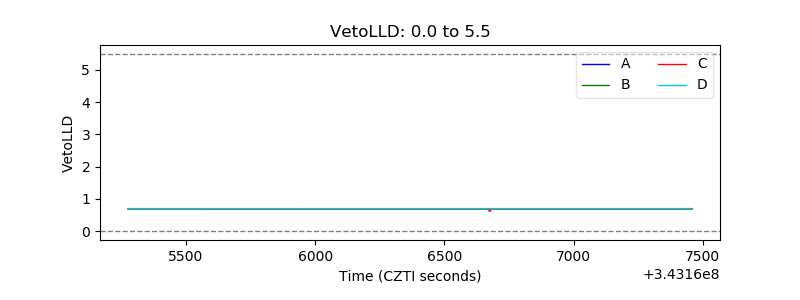 |
| Alpha Counter | 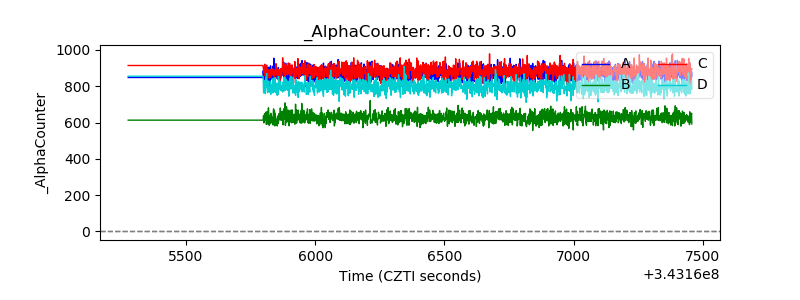 |
| _CPM_Rate | 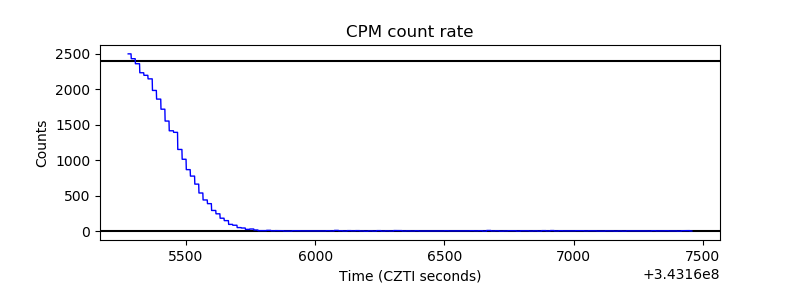 |
| CZT Counter | 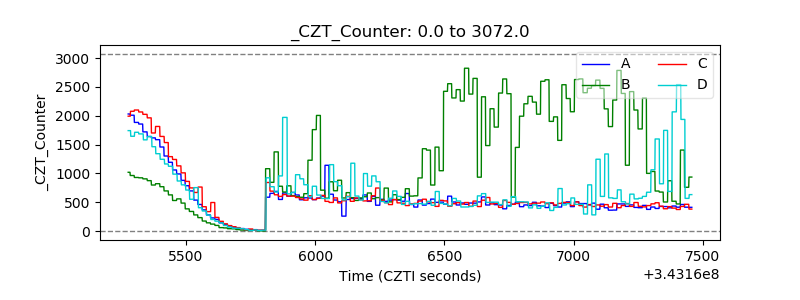 |
| +2.5 Volts monitor |  |
| +5 Volts monitor |  |
| _ROLL_ROT | 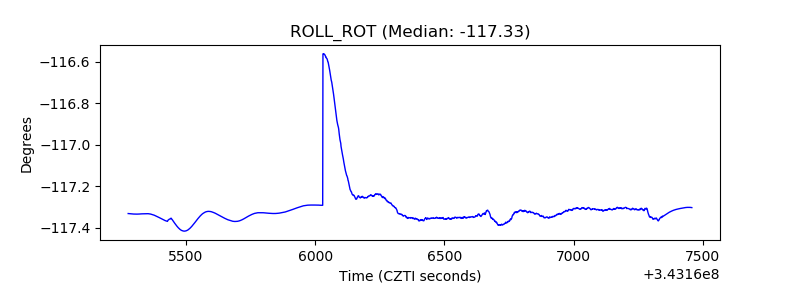 |
| _Roll_DEC | 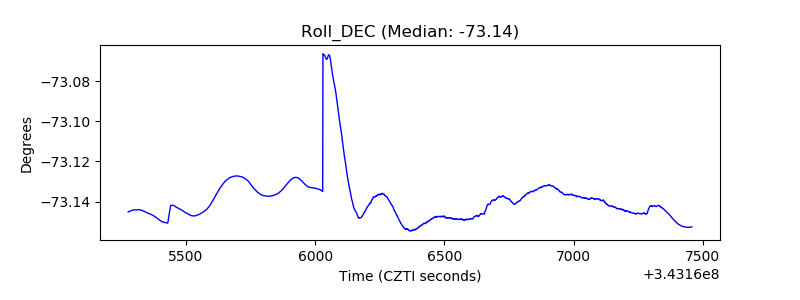 |
| _Roll_RA | 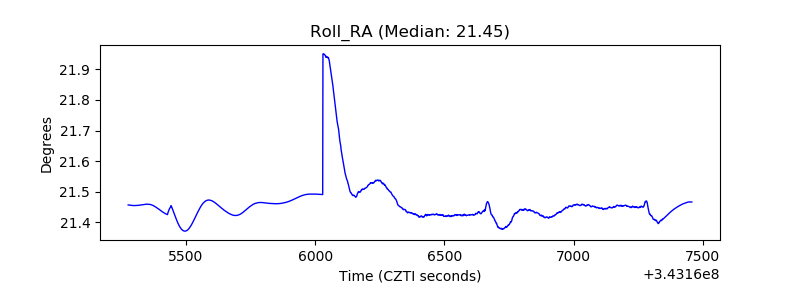 |
| Veto Counter | 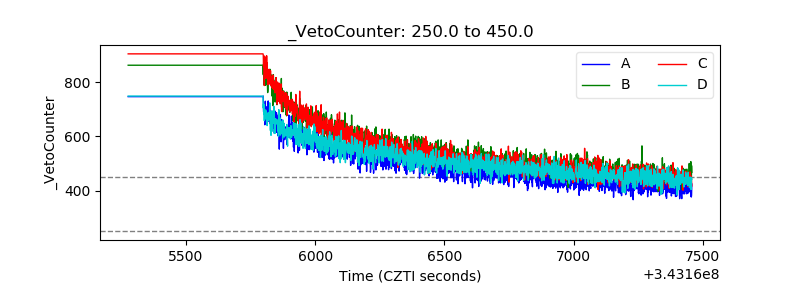 |