| Param | Original file | Final file |
|---|---|---|
| Filename | modeM0/AS1A09_038T46_9000004002_27942cztM0_level2.evt | modeM0/AS1A09_038T46_9000004002_27942cztM0_level2_quad_clean.evt |
| Size (bytes) | 7,571,520 | 1,687,680 |
| Size | 7.2 MB | 1.6 MB |
| Events in quadrant A | 38,516 | 10,685 |
| Events in quadrant B | 34,999 | 9,672 |
| Events in quadrant C | 40,100 | 10,640 |
| Events in quadrant D | 104,033 | 3,197 |
| Mode M9 | |||
|---|---|---|---|
| Quadrant | BADHDUFLAG | Total packets | Discarded packets |
| A | 0 | 3 | 3 |
| B | 0 | 2 | 2 |
| C | 0 | 2 | 2 |
| D | 0 | 2 | 2 |
| Mode M0 | |||
|---|---|---|---|
| Quadrant | BADHDUFLAG | Total packets | Discarded packets |
| A | 0 | 174 | 0 |
| B | 0 | 152 | 0 |
| C | 0 | 175 | 0 |
| D | 0 | 341 | 0 |
| Quadrant | Total seconds | Saturated seconds | Saturation percentage |
|---|---|---|---|
| A | 87 | 0 | 0.000000% |
| B | 76 | 0 | 0.000000% |
| C | 87 | 1 | 1.149425% |
| D | 49 | 33 | 67.346939% |
Noise dominated data is calculated using 1-second bins in cleaned event files. If a bin has >2000 counts, and if more than 50% of those come from <1% of pixels, then it is considered to be noise-dominated and hence unusable.
| Quadrant | # 1 sec bins | Bins with >0 counts | Bins with >2000 counts | High rate bins dominated by noise | Noise dominated (total time) | Noise dominated (detector-on time) | Marked lightcurve |
|---|---|---|---|---|---|---|---|
| A | 919 | 127 | 0 | 0 | 0.00% | 0.00% | 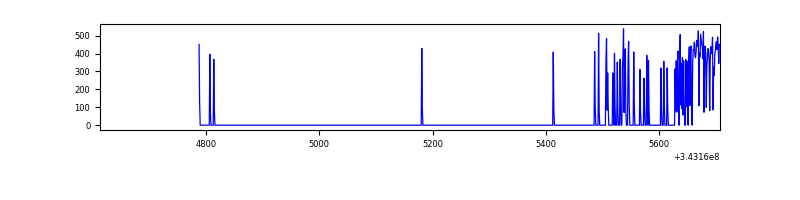 |
| B | 1093 | 107 | 0 | 0 | 0.00% | 0.00% | 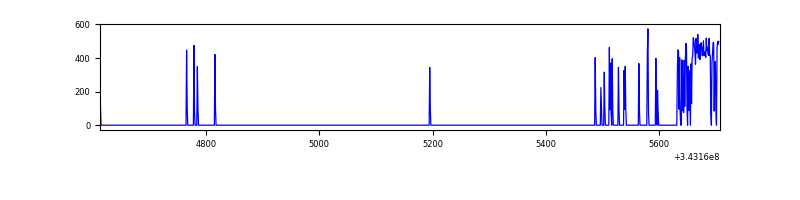 |
| C | 941 | 120 | 0 | 0 | 0.00% | 0.00% | 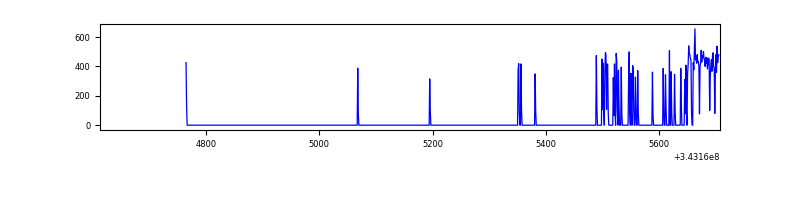 |
| D | 534 | 61 | 30 | 30 | 5.62% | 49.18% | 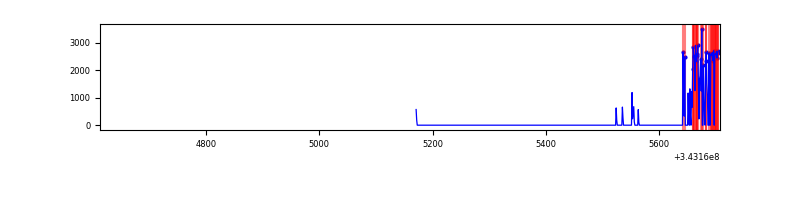 |
Top three noisy pixels from each quadrant. If the there are fewer than three noisy pixels in the level2.evt file, extra rows are filled as -1
| Pixel properties | Quadrant properties | ||||||
|---|---|---|---|---|---|---|---|
| Quadrant | DetID | PixID | Counts | Sigma | Mean | Median | Sigma |
| A | 13 | 254 | 169 | 42.24 | 9 | 9 | 3.8 |
| A | 3 | 137 | 103 | 24.82 | 9 | 9 | 3.8 |
| A | 0 | 226 | 73 | 16.9 | 9 | 9 | 3.8 |
| B | 12 | 111 | 227 | 63.84 | 8 | 8 | 3.4 |
| B | 14 | 111 | 196 | 54.8 | 8 | 8 | 3.4 |
| B | 11 | 111 | 182 | 50.72 | 8 | 8 | 3.4 |
| C | 14 | 238 | 1535 | 396.61 | 9 | 9 | 3.8 |
| C | 3 | 233 | 1219 | 314.48 | 9 | 9 | 3.8 |
| C | 2 | 16 | 75 | 17.15 | 9 | 9 | 3.8 |
| D | 1 | 52 | 72001 | 40555.28 | 3 | 3 | 1.8 |
| D | 2 | 250 | 15750 | 8870.02 | 3 | 3 | 1.8 |
| D | 8 | 195 | 2037 | 1145.72 | 3 | 3 | 1.8 |
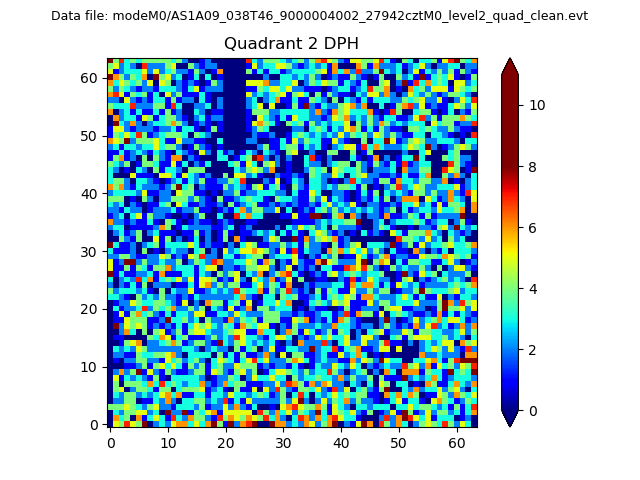
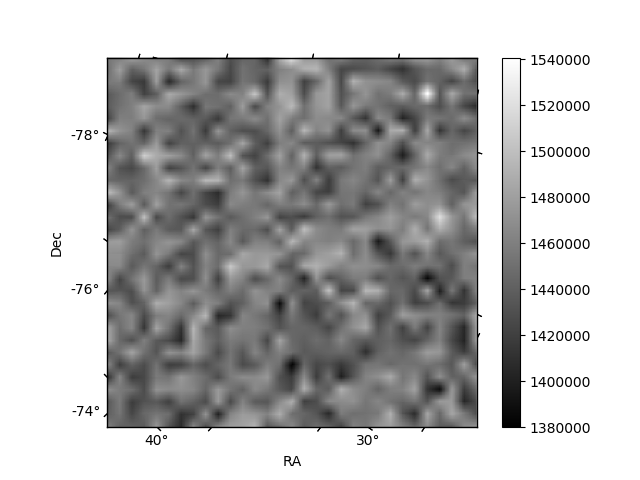
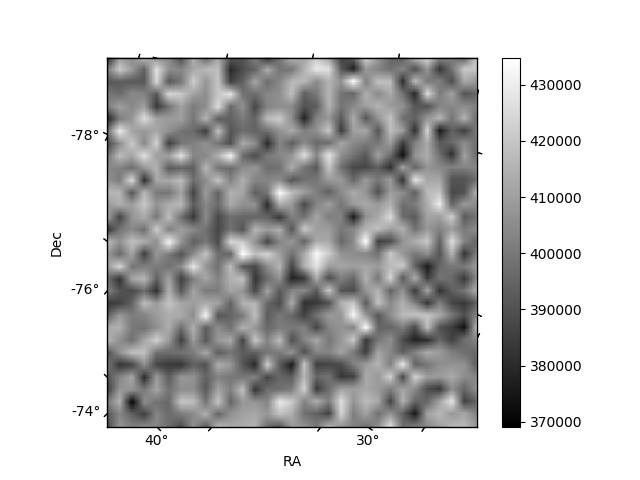
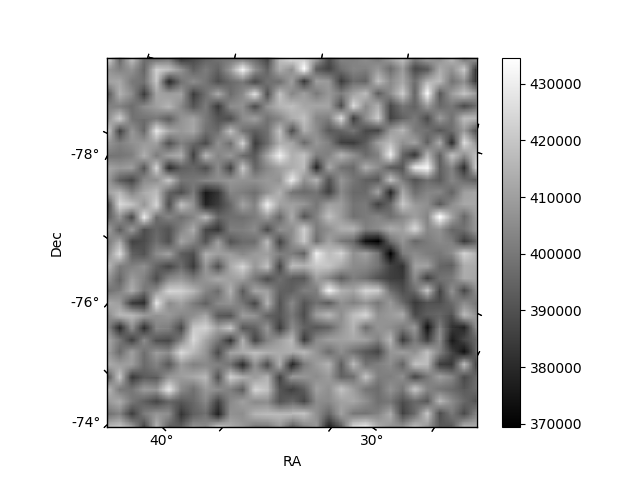
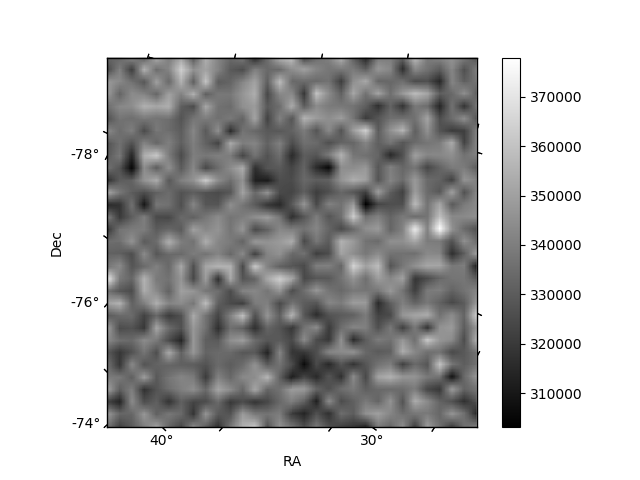
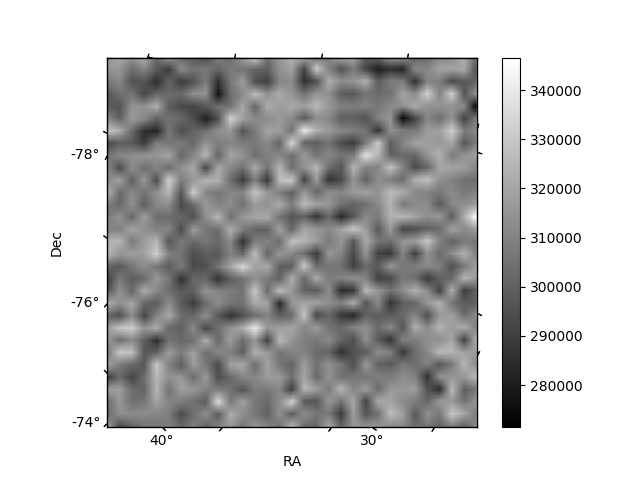
Histogram calculated using DETX and DETY for each event in the final _common_clean file
| Quadrant A | 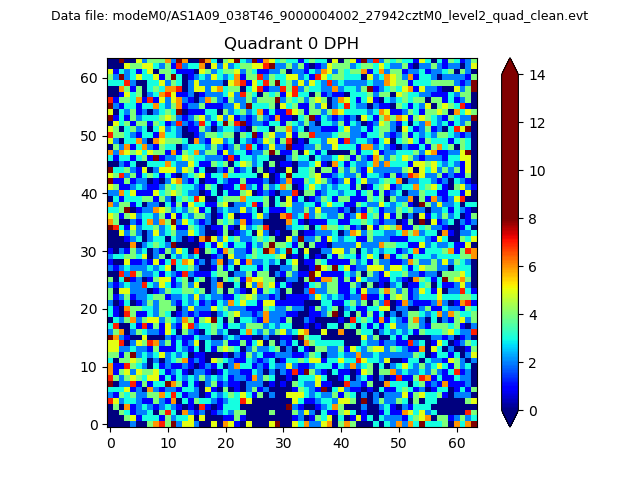 |
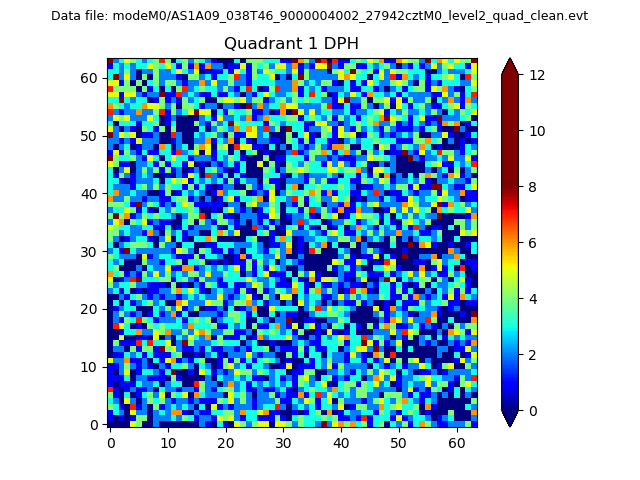 |
Quadrant B |
|---|---|---|---|
| Quadrant D | 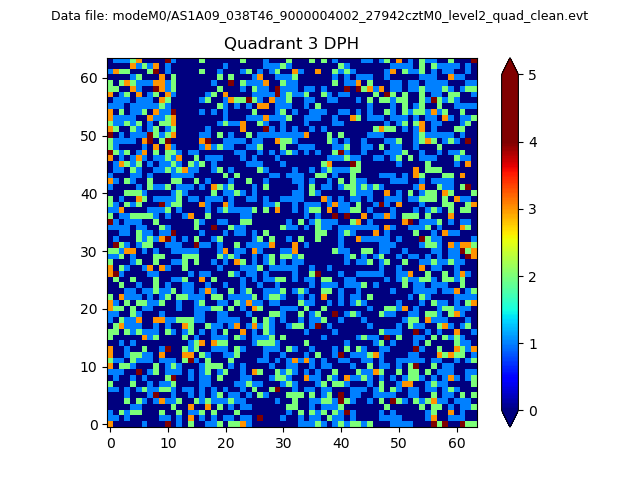 |
 |
Quadrant C |
| Plot type | Count rate plots | Images |
|---|---|---|
| Comparison with Poisson distribution Blue bars denote a histogram of data divided into 1 sec bins. Red curve is a Poisson curve with rate = median count rate of data. |
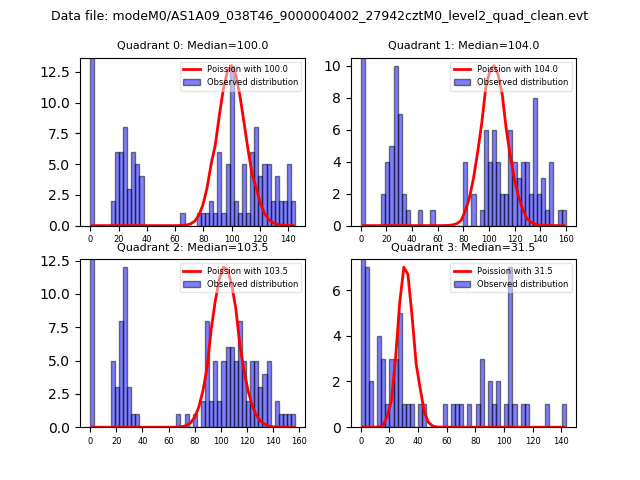 |
 |
| Quadrant-wise count rates Data is divided into 100 sec bins |
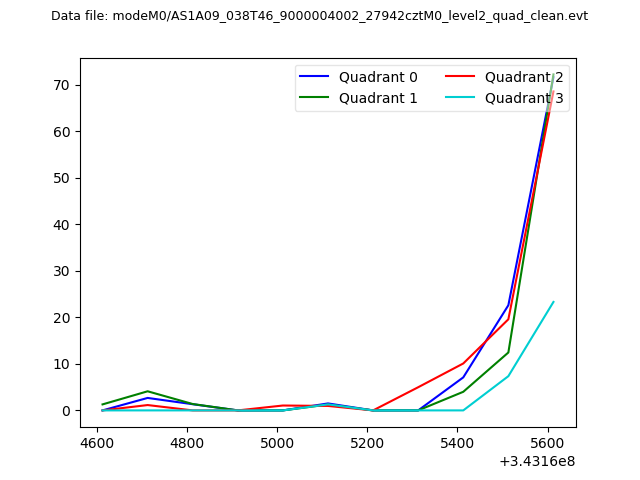 |
|
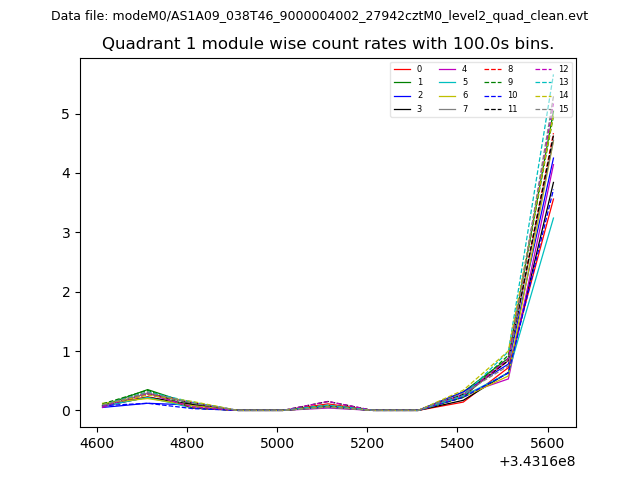
| Module-wise count rates for Quadrant A Data is divided into 100 sec bins |
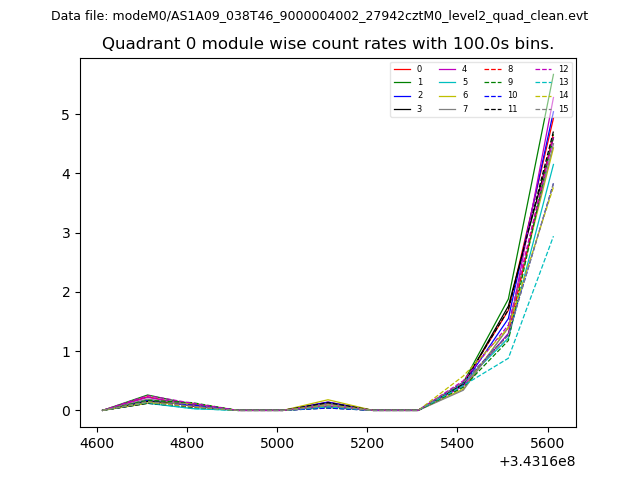 |
 |
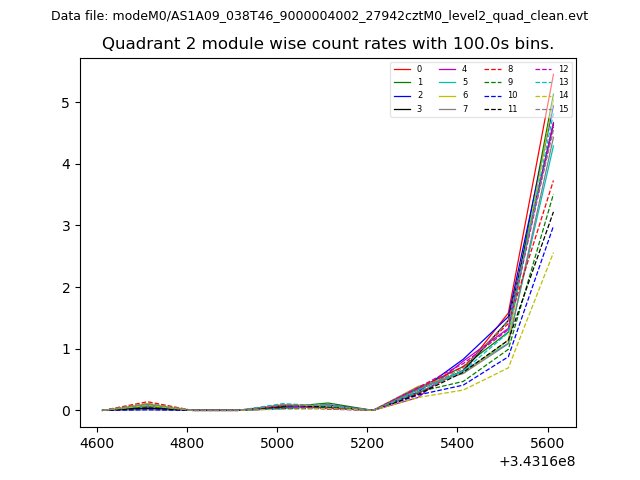
| Module-wise count rates for Quadrant B Data is divided into 100 sec bins |
 |
 |
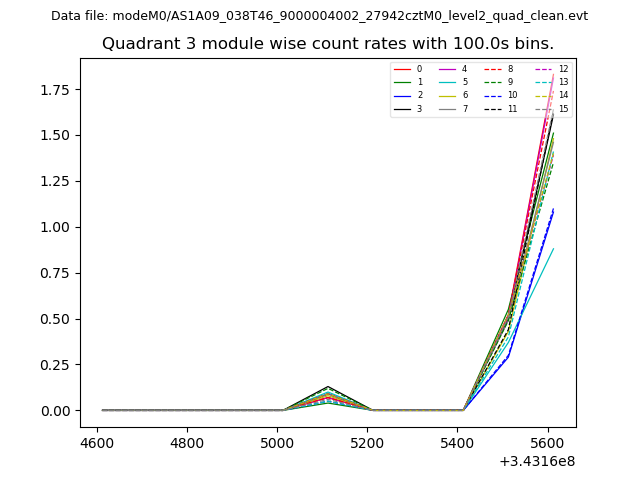
| Module-wise count rates for Quadrant C Data is divided into 100 sec bins |
 |
 |
| Module-wise count rates for Quadrant D Data is divided into 100 sec bins |
 |
 |
| Parameter | Plot |
|---|---|
| CZT HV Monitor | 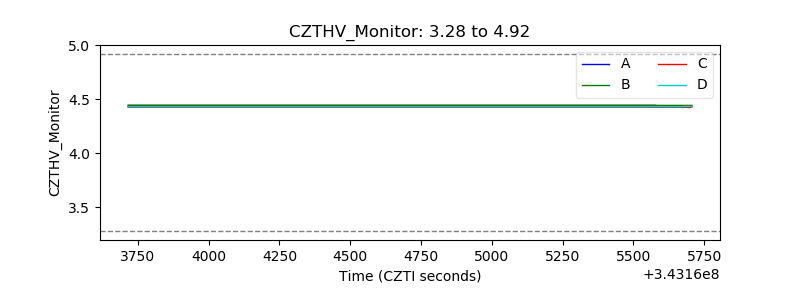 |
| D_VDD | 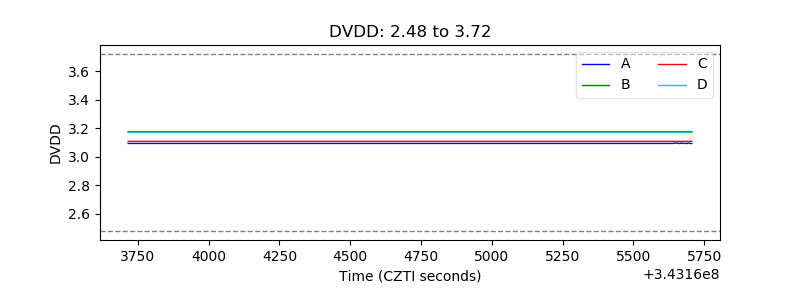 |
| Temperature 1 | 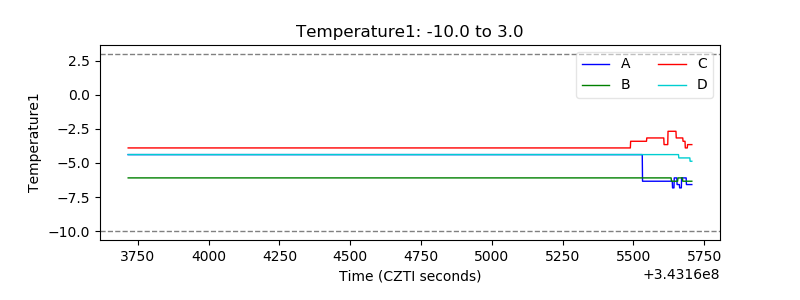 |
| Veto HV Monitor | 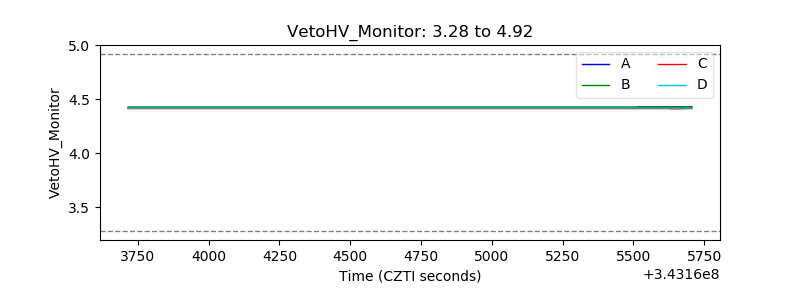 |
| Veto LLD | 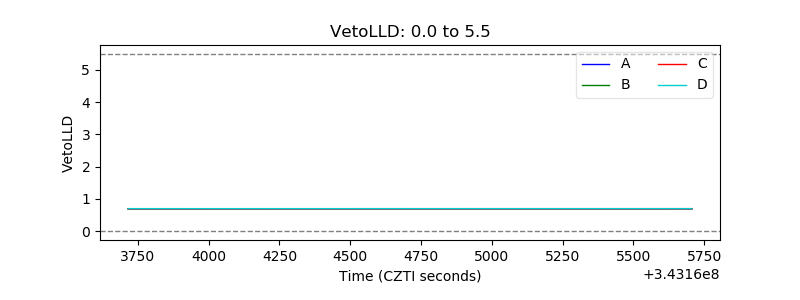 |
| Alpha Counter | 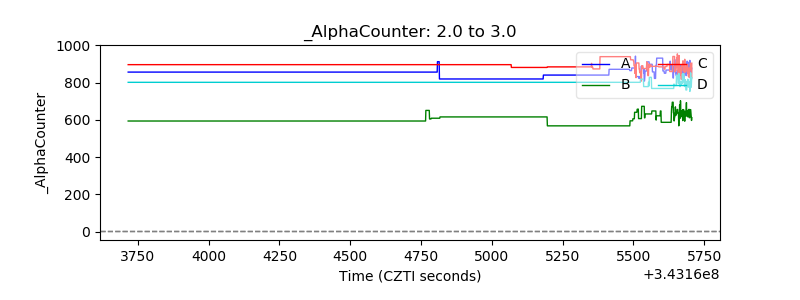 |
| _CPM_Rate | 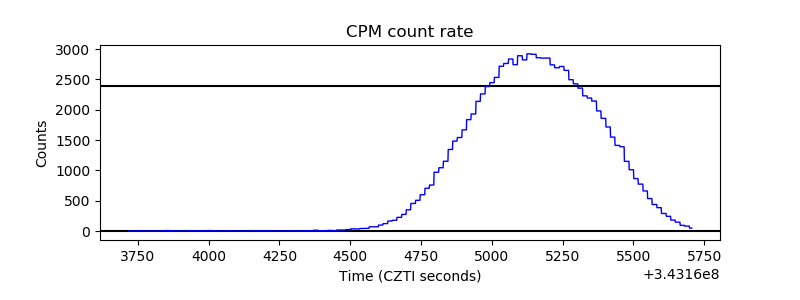 |
| CZT Counter | 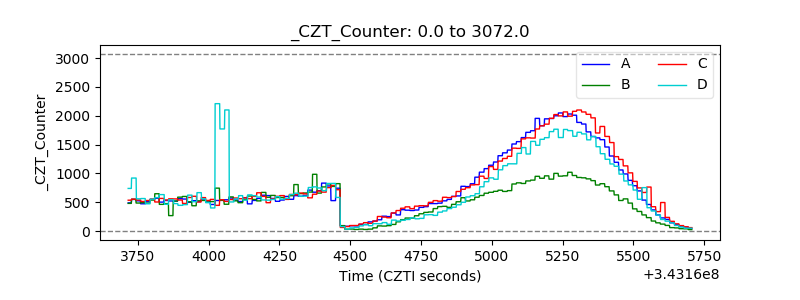 |
| +2.5 Volts monitor |  |
| +5 Volts monitor |  |
| _ROLL_ROT | 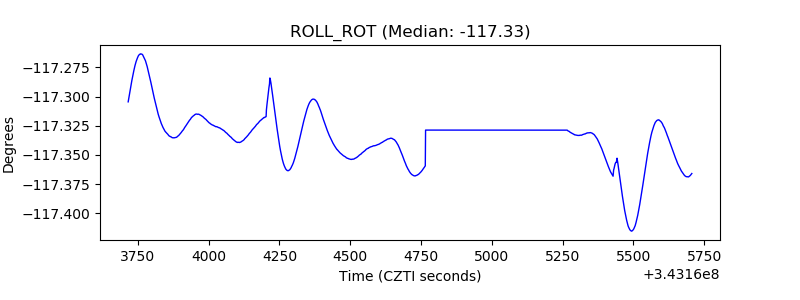 |
| _Roll_DEC |  |
| _Roll_RA | 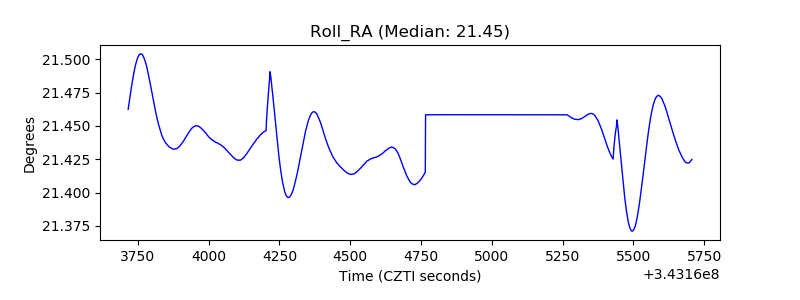 |
| Veto Counter | 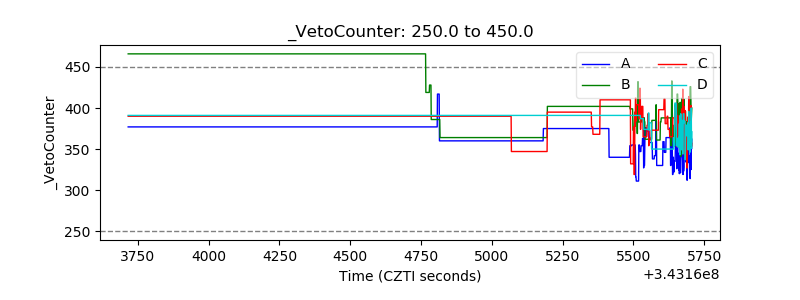 |