| Param | Original file | Final file |
|---|---|---|
| Filename | modeM0/AS1A09_038T47_9000004004cztM0_level2.fits | modeM0/AS1A09_038T47_9000004004cztM0_level2_quad_clean.evt |
| Size (bytes) | 45,541,440 | 37,520,640 |
| Size | 43.4 MB | 35.8 MB |
| Events in quadrant A | 290,444 | 230,297 |
| Events in quadrant B | 252,500 | 182,230 |
| Events in quadrant C | 282,594 | 211,168 |
| Events in quadrant D | 234,660 | 192,946 |
| Mode SS | |||
|---|---|---|---|
| Quadrant | BADHDUFLAG | Total packets | Discarded packets |
| A | 0 | 92 | 0 |
| B | 0 | 92 | 0 |
| C | 0 | 92 | 0 |
| D | 0 | 92 | 0 |
| Mode M0 | |||
|---|---|---|---|
| Quadrant | BADHDUFLAG | Total packets | Discarded packets |
| A | 0 | 9395 | 0 |
| B | 0 | 17743 | 0 |
| C | 0 | 9619 | 0 |
| D | 0 | 12728 | 0 |
| Mode M9 | |||
|---|---|---|---|
| Quadrant | BADHDUFLAG | Total packets | Discarded packets |
| A | 0 | 13 | 0 |
| B | 0 | 13 | 0 |
| C | 0 | 13 | 0 |
| D | 0 | 13 | 0 |
| Quadrant | Total seconds | Saturated seconds | Saturation percentage |
|---|---|---|---|
| A | 4533 | 14 | 0.308846% |
| B | 4533 | 963 | 21.244209% |
| C | 4533 | 51 | 1.125083% |
| D | 4533 | 398 | 8.780057% |
Noise dominated data is calculated using 1-second bins in cleaned event files. If a bin has >2000 counts, and if more than 50% of those come from <1% of pixels, then it is considered to be noise-dominated and hence unusable.
| Quadrant | # 1 sec bins | Bins with >0 counts | Bins with >2000 counts | High rate bins dominated by noise | Noise dominated (total time) | Noise dominated (detector-on time) | Marked lightcurve |
|---|---|---|---|---|---|---|---|
| A | 5808 | 4533 | 0 | 0 | 0.00% | 0.00% |  |
| B | 5808 | 4528 | 0 | 0 | 0.00% | 0.00% |  |
| C | 5808 | 4533 | 0 | 0 | 0.00% | 0.00% |  |
| D | 5808 | 4531 | 0 | 0 | 0.00% | 0.00% |  |
Top three noisy pixels from each quadrant. If the there are fewer than three noisy pixels in the level2.evt file, extra rows are filled as -1
| Pixel properties | Quadrant properties | ||||||
|---|---|---|---|---|---|---|---|
| Quadrant | DetID | PixID | Counts | Sigma | Mean | Median | Sigma |
| A | 0 | 29 | 285 | 10.54 | 75 | 71 | 20.3 |
| A | 7 | 110 | 235 | 8.07 | 75 | 71 | 20.3 |
| A | 14 | 79 | 216 | 7.14 | 75 | 71 | 20.3 |
| B | 2 | 9 | 203 | 9.02 | 67 | 64 | 15.4 |
| B | 5 | 128 | 186 | 7.92 | 67 | 64 | 15.4 |
| B | 4 | 227 | 177 | 7.33 | 67 | 64 | 15.4 |
| C | 12 | 241 | 209 | 6.73 | 74 | 70 | 20.7 |
| C | 1 | 65 | 203 | 6.44 | 74 | 70 | 20.7 |
| C | 12 | 242 | 196 | 6.1 | 74 | 70 | 20.7 |
| D | 3 | 14 | 184 | 6.27 | 67 | 61 | 19.6 |
| D | 12 | 37 | 179 | 6.02 | 67 | 61 | 19.6 |
| D | 10 | 189 | 176 | 5.86 | 67 | 61 | 19.6 |
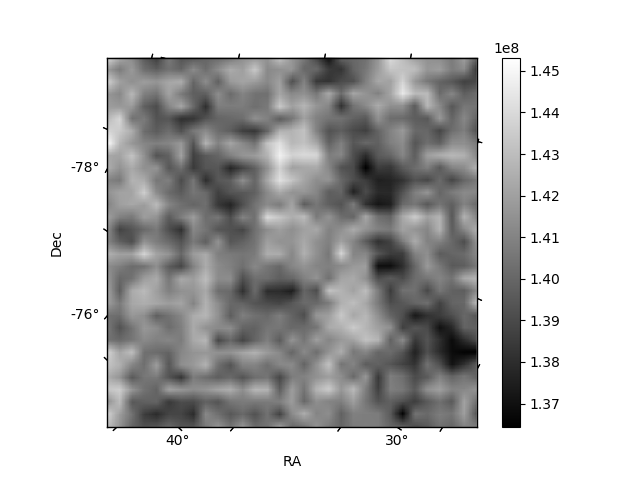
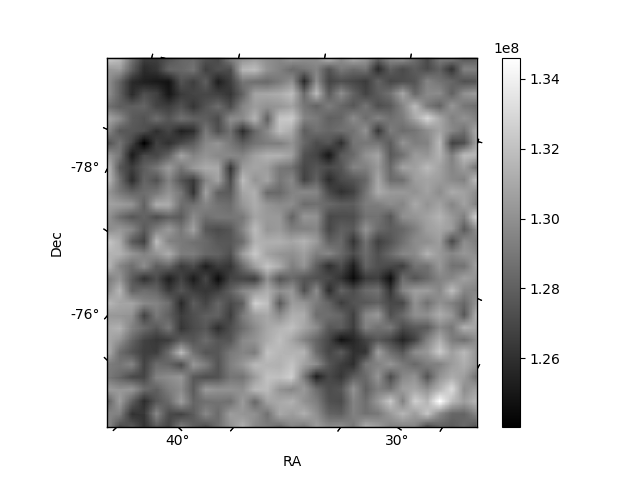
Histogram calculated using DETX and DETY for each event in the final _common_clean file
| Quadrant A |  |
 |
Quadrant B |
|---|---|---|---|
| Quadrant D |  |
 |
Quadrant C |
| Plot type | Count rate plots | Images |
|---|---|---|
| Comparison with Poisson distribution Blue bars denote a histogram of data divided into 1 sec bins. Red curve is a Poisson curve with rate = median count rate of data. |
 |
 |
| Quadrant-wise count rates Data is divided into 100 sec bins |
 |
|
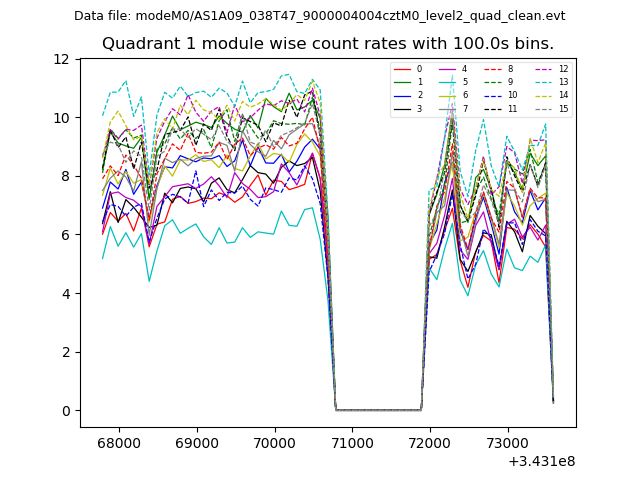
| Module-wise count rates for Quadrant A Data is divided into 100 sec bins |
 |
 |
| Module-wise count rates for Quadrant B Data is divided into 100 sec bins |
 |
 |
| Module-wise count rates for Quadrant C Data is divided into 100 sec bins |
 |
 |
| Module-wise count rates for Quadrant D Data is divided into 100 sec bins |
 |
 |
| Parameter | Plot |
|---|---|
| CZT HV Monitor |  |
| D_VDD | 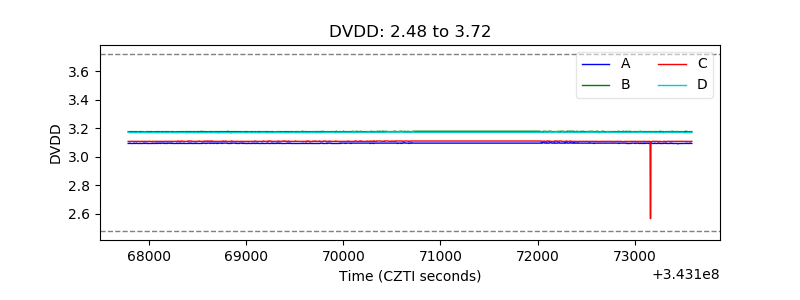 |
| Temperature 1 |  |
| Veto HV Monitor |  |
| Veto LLD | 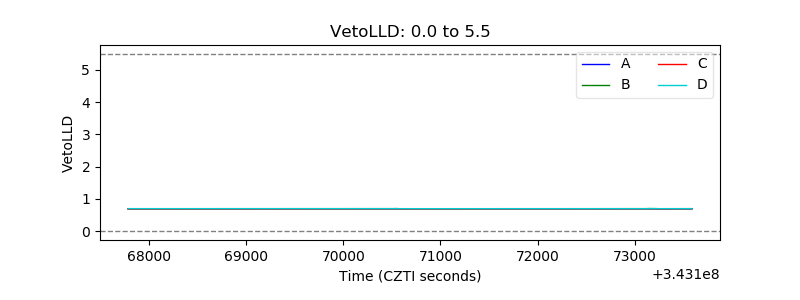 |
| Alpha Counter |  |
| _CPM_Rate |  |
| CZT Counter |  |
| +2.5 Volts monitor |  |
| +5 Volts monitor |  |
| _ROLL_ROT |  |
| _Roll_DEC |  |
| _Roll_RA |  |
| Veto Counter |  |