| Param | Original file | Final file |
|---|---|---|
| Filename | modeM0/AS1A09_038T47_9000004004_27764cztM0_level2.evt | modeM0/AS1A09_038T47_9000004004_27764cztM0_level2_quad_clean.evt |
| Size (bytes) | 402,212,160 | 85,654,080 |
| Size | 383.6 MB | 81.7 MB |
| Events in quadrant A | 2,060,794 | 606,925 |
| Events in quadrant B | 4,581,132 | 559,191 |
| Events in quadrant C | 2,159,666 | 583,723 |
| Events in quadrant D | 3,087,732 | 542,062 |
| Mode M0 | |||
|---|---|---|---|
| Quadrant | BADHDUFLAG | Total packets | Discarded packets |
| A | 0 | 8908 | 0 |
| B | 0 | 16484 | 0 |
| C | 0 | 9127 | 0 |
| D | 0 | 12085 | 0 |
| Mode M9 | |||
|---|---|---|---|
| Quadrant | BADHDUFLAG | Total packets | Discarded packets |
| A | 0 | 13 | 0 |
| B | 0 | 13 | 0 |
| C | 0 | 13 | 0 |
| D | 0 | 13 | 0 |
| Quadrant | Total seconds | Saturated seconds | Saturation percentage |
|---|---|---|---|
| A | 4289 | 14 | 0.326416% |
| B | 4288 | 884 | 20.615672% |
| C | 4288 | 51 | 1.189366% |
| D | 4288 | 378 | 8.815299% |
Noise dominated data is calculated using 1-second bins in cleaned event files. If a bin has >2000 counts, and if more than 50% of those come from <1% of pixels, then it is considered to be noise-dominated and hence unusable.
| Quadrant | # 1 sec bins | Bins with >0 counts | Bins with >2000 counts | High rate bins dominated by noise | Noise dominated (total time) | Noise dominated (detector-on time) | Marked lightcurve |
|---|---|---|---|---|---|---|---|
| A | 5564 | 4290 | 0 | 0 | 0.00% | 0.00% | 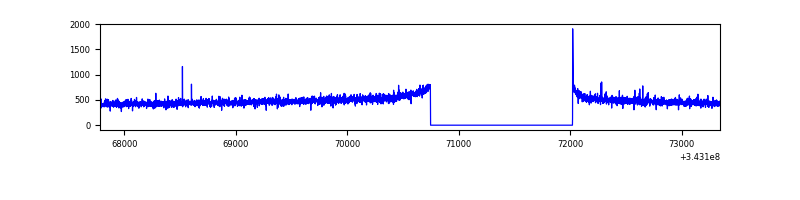 |
| B | 5563 | 4288 | 674 | 674 | 12.12% | 15.72% | 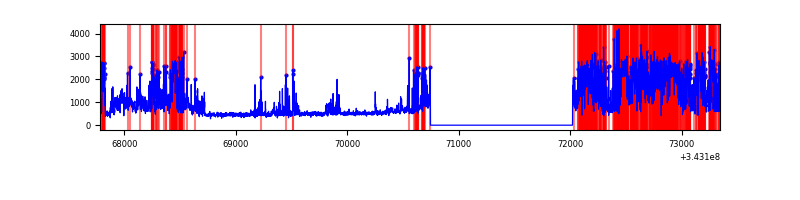 |
| C | 5563 | 4289 | 0 | 0 | 0.00% | 0.00% | 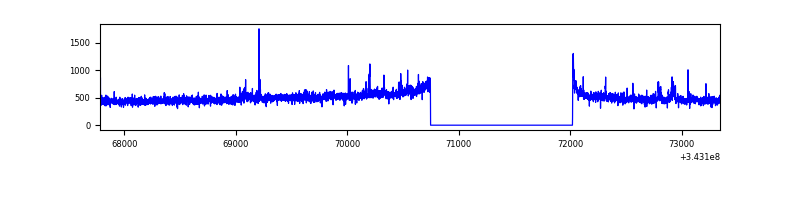 |
| D | 5563 | 4289 | 358 | 358 | 6.44% | 8.35% | 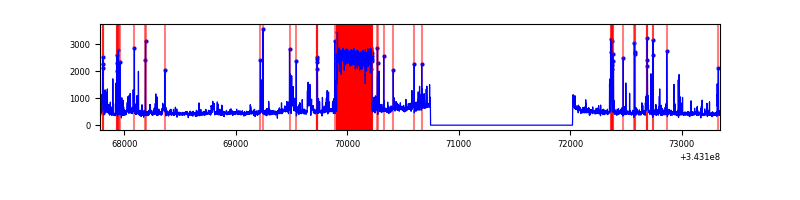 |
Top three noisy pixels from each quadrant. If the there are fewer than three noisy pixels in the level2.evt file, extra rows are filled as -1
| Pixel properties | Quadrant properties | ||||||
|---|---|---|---|---|---|---|---|
| Quadrant | DetID | PixID | Counts | Sigma | Mean | Median | Sigma |
| A | 13 | 254 | 7204 | 62.59 | 532 | 522 | 106.7 |
| A | 8 | 192 | 6167 | 52.88 | 532 | 522 | 106.7 |
| A | 3 | 137 | 4857 | 40.61 | 532 | 522 | 106.7 |
| B | 3 | 64 | 2401371 | 26085.67 | 492 | 481 | 92.0 |
| B | 10 | 245 | 201413 | 2183.13 | 492 | 481 | 92.0 |
| B | 0 | 190 | 11991 | 125.06 | 492 | 481 | 92.0 |
| C | 14 | 238 | 84424 | 701.86 | 514 | 516 | 119.6 |
| C | 3 | 233 | 67029 | 556.36 | 514 | 516 | 119.6 |
| C | 0 | 10 | 3710 | 26.72 | 514 | 516 | 119.6 |
| D | 1 | 52 | 1038805 | 8773.45 | 493 | 478 | 118.3 |
| D | 2 | 250 | 87189 | 732.67 | 493 | 478 | 118.3 |
| D | 13 | 104 | 55302 | 463.24 | 493 | 478 | 118.3 |
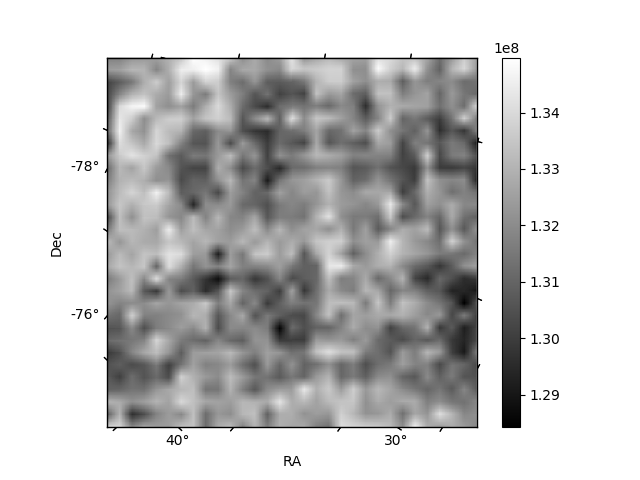
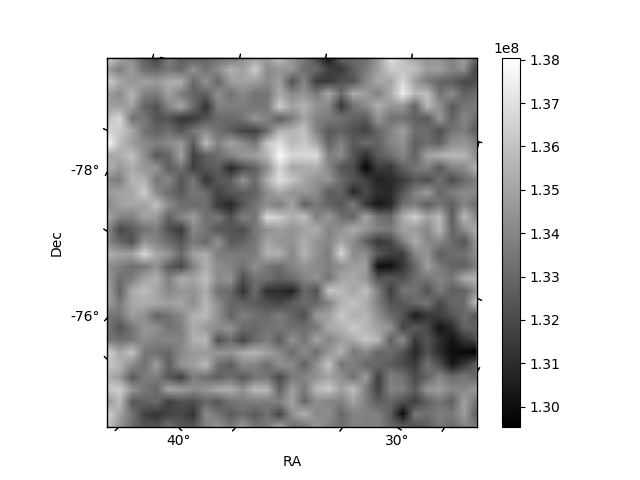
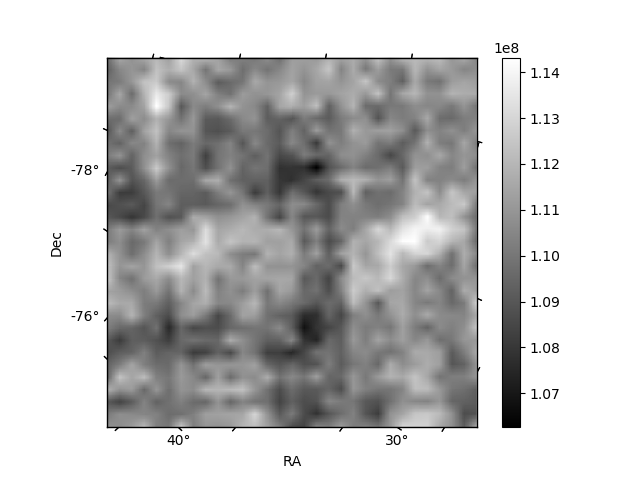
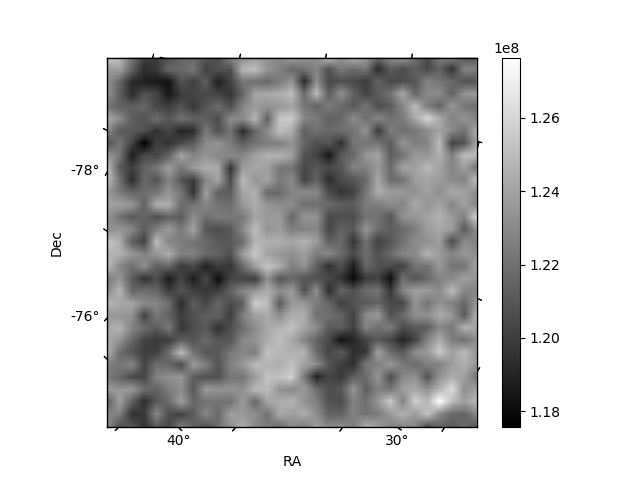
Histogram calculated using DETX and DETY for each event in the final _common_clean file
| Quadrant A | 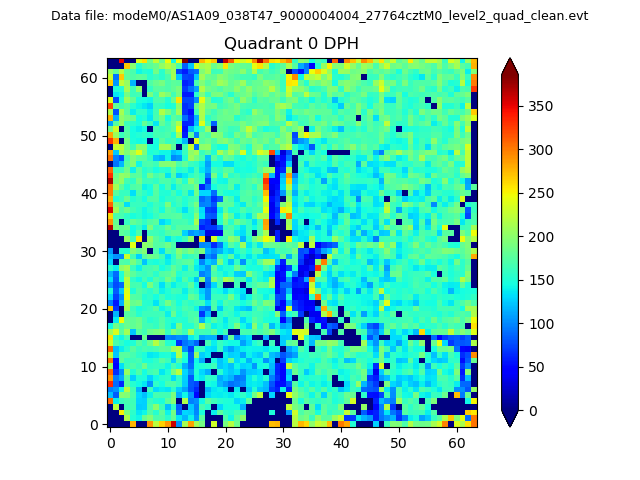 |
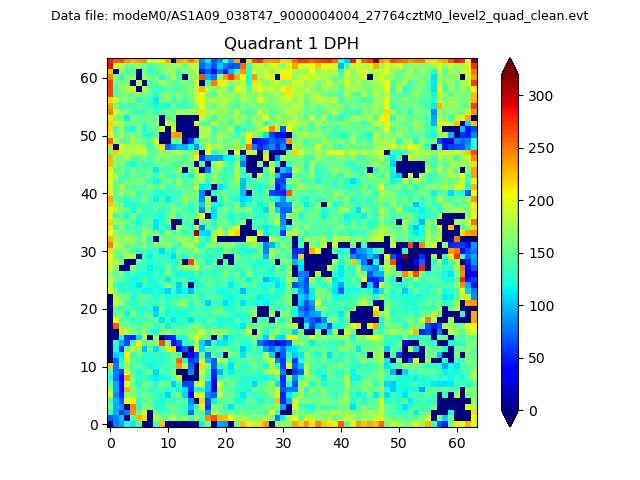 |
Quadrant B |
|---|---|---|---|
| Quadrant D | 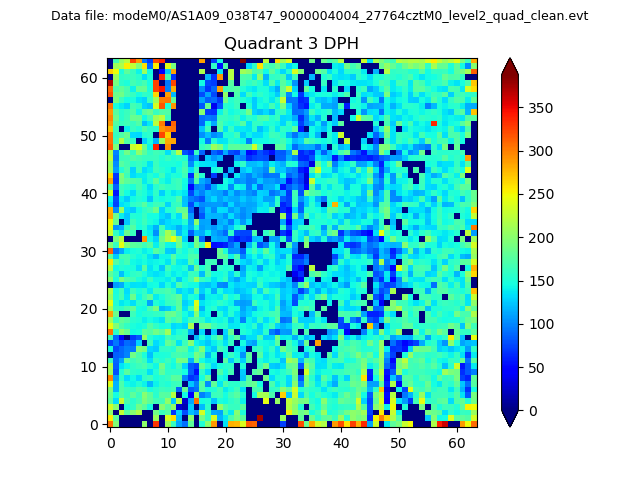 |
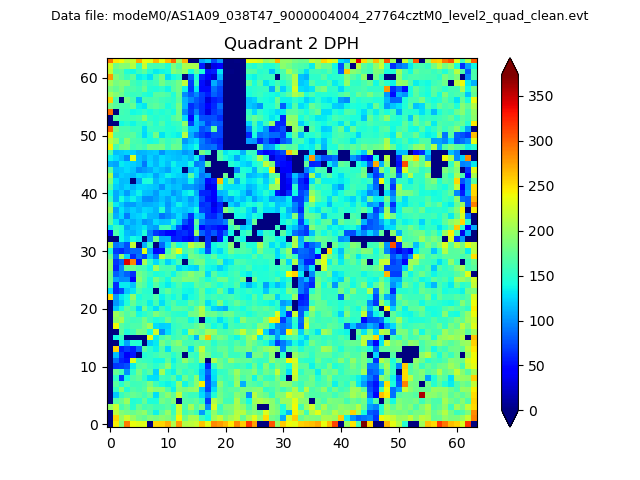 |
Quadrant C |
| Plot type | Count rate plots | Images |
|---|---|---|
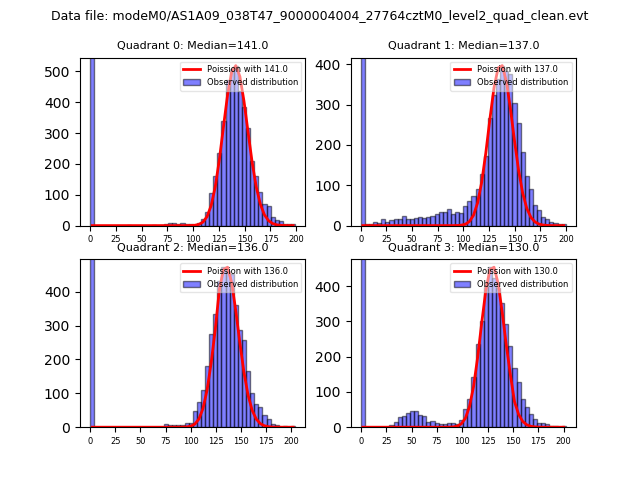
| Comparison with Poisson distribution Blue bars denote a histogram of data divided into 1 sec bins. Red curve is a Poisson curve with rate = median count rate of data. |
 |
 |
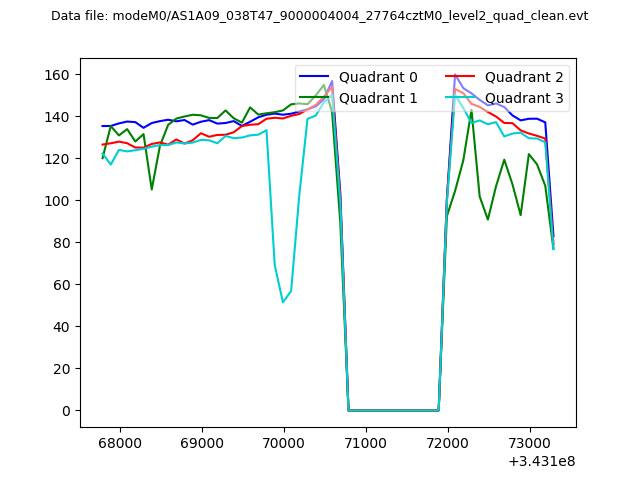
| Quadrant-wise count rates Data is divided into 100 sec bins |
 |
|
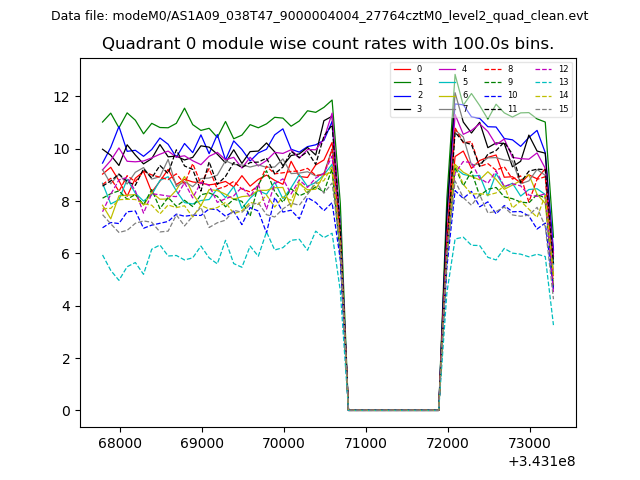
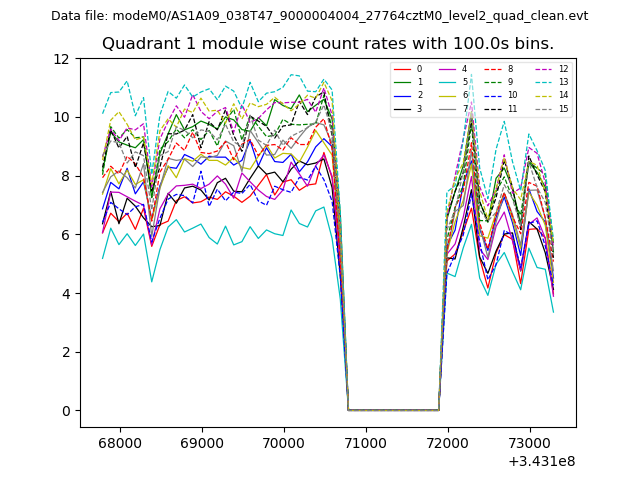
| Module-wise count rates for Quadrant A Data is divided into 100 sec bins |
 |
 |
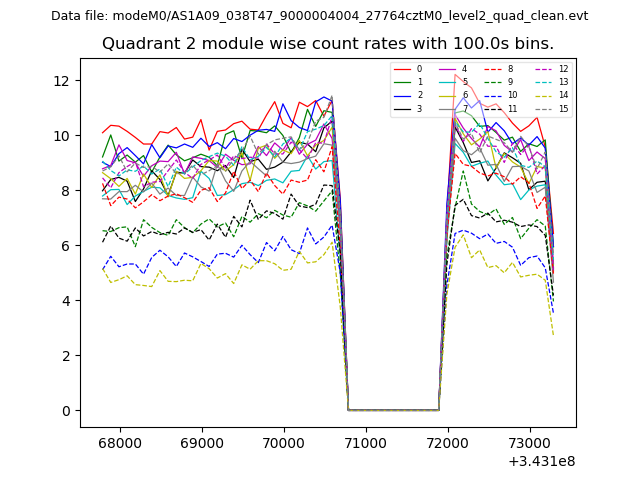
| Module-wise count rates for Quadrant B Data is divided into 100 sec bins |
 |
 |
| Module-wise count rates for Quadrant C Data is divided into 100 sec bins |
 |
 |
| Module-wise count rates for Quadrant D Data is divided into 100 sec bins |
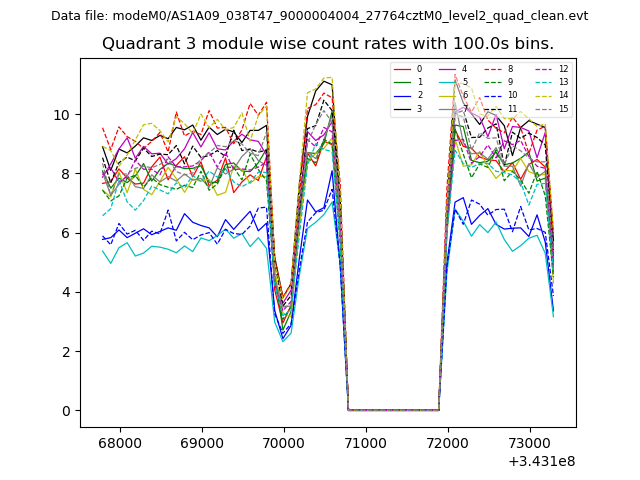 |
 |
| Parameter | Plot |
|---|---|
| CZT HV Monitor | 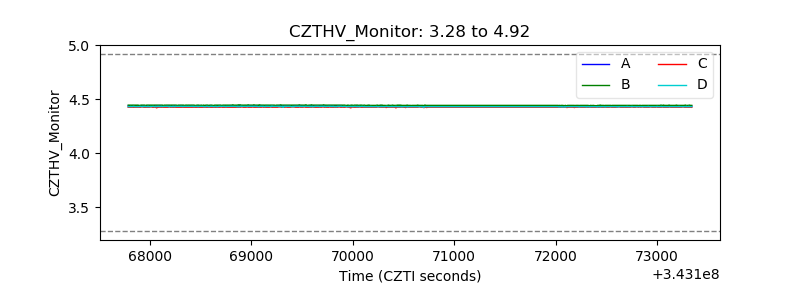 |
| D_VDD | 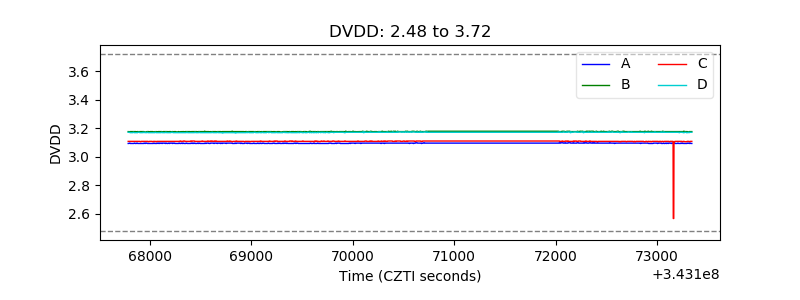 |
| Temperature 1 | 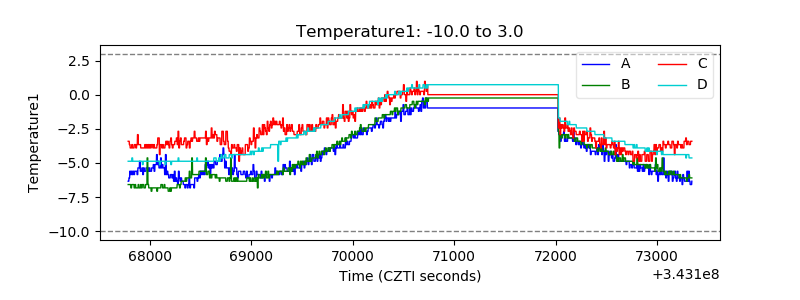 |
| Veto HV Monitor | 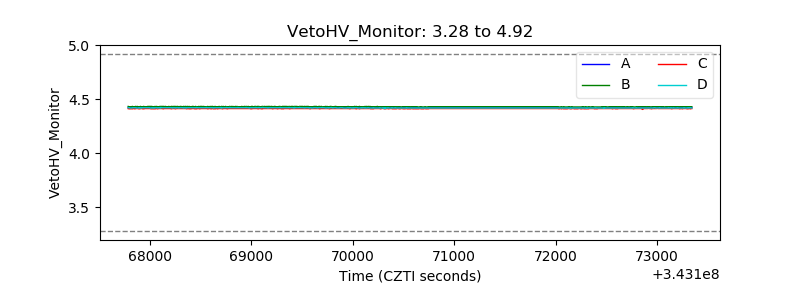 |
| Veto LLD | 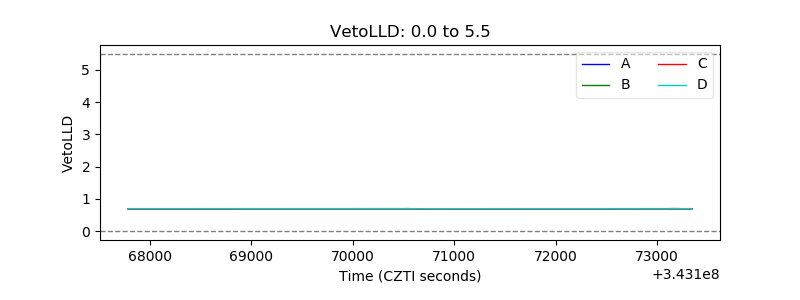 |
| Alpha Counter | 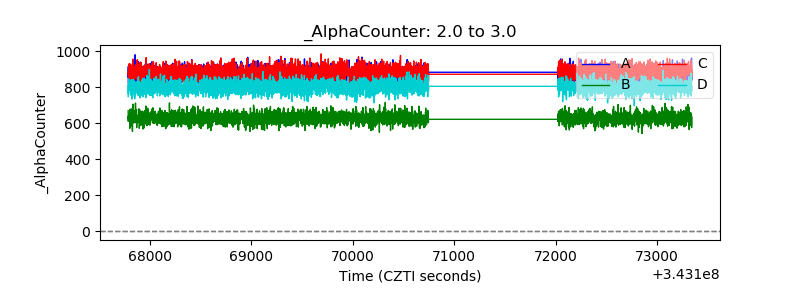 |
| _CPM_Rate |  |
| CZT Counter | 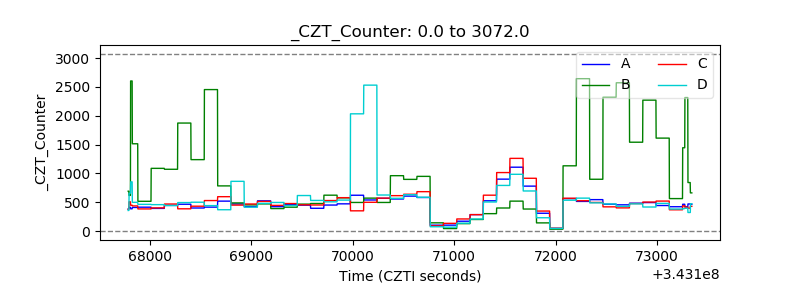 |
| +2.5 Volts monitor |  |
| +5 Volts monitor |  |
| _ROLL_ROT |  |
| _Roll_DEC | 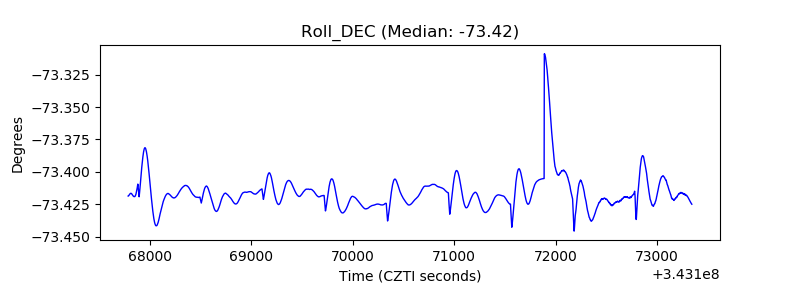 |
| _Roll_RA | 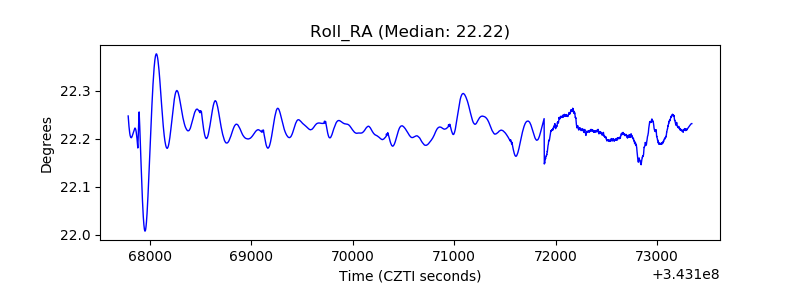 |
| Veto Counter | 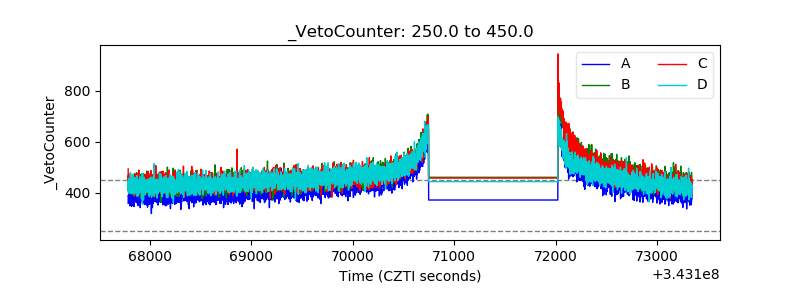 |