| Param | Original file | Final file |
|---|---|---|
| Filename | modeM0/AS1A09_038T47_9000004004_27765cztM0_level2.evt | modeM0/AS1A09_038T47_9000004004_27765cztM0_level2_quad_clean.evt |
| Size (bytes) | 171,175,680 | 31,288,320 |
| Size | 163.2 MB | 29.8 MB |
| Events in quadrant A | 743,149 | 225,668 |
| Events in quadrant B | 2,681,247 | 179,265 |
| Events in quadrant C | 768,290 | 216,673 |
| Events in quadrant D | 882,186 | 209,221 |
| Mode M0 | |||
|---|---|---|---|
| Quadrant | BADHDUFLAG | Total packets | Discarded packets |
| A | 0 | 3227 | 0 |
| B | 0 | 9055 | 0 |
| C | 0 | 3282 | 0 |
| D | 0 | 3692 | 0 |
| Mode M9 | |||
|---|---|---|---|
| Quadrant | BADHDUFLAG | Total packets | Discarded packets |
| A | 0 | 3 | 0 |
| B | 0 | 4 | 0 |
| C | 0 | 4 | 0 |
| D | 0 | 4 | 0 |
| Quadrant | Total seconds | Saturated seconds | Saturation percentage |
|---|---|---|---|
| A | 1567 | 10 | 0.638162% |
| B | 1567 | 775 | 49.457562% |
| C | 1567 | 16 | 1.021059% |
| D | 1567 | 41 | 2.616465% |
Noise dominated data is calculated using 1-second bins in cleaned event files. If a bin has >2000 counts, and if more than 50% of those come from <1% of pixels, then it is considered to be noise-dominated and hence unusable.
| Quadrant | # 1 sec bins | Bins with >0 counts | Bins with >2000 counts | High rate bins dominated by noise | Noise dominated (total time) | Noise dominated (detector-on time) | Marked lightcurve |
|---|---|---|---|---|---|---|---|
| A | 1567 | 1567 | 0 | 0 | 0.00% | 0.00% | 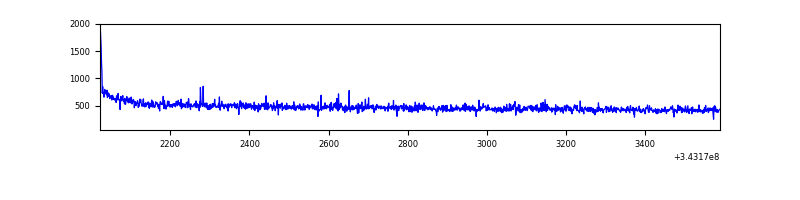 |
| B | 1567 | 1567 | 612 | 612 | 39.06% | 39.06% | 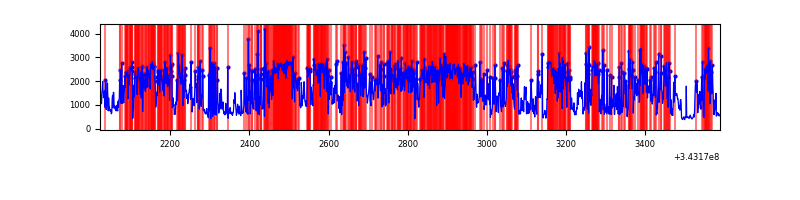 |
| C | 1567 | 1567 | 0 | 0 | 0.00% | 0.00% | 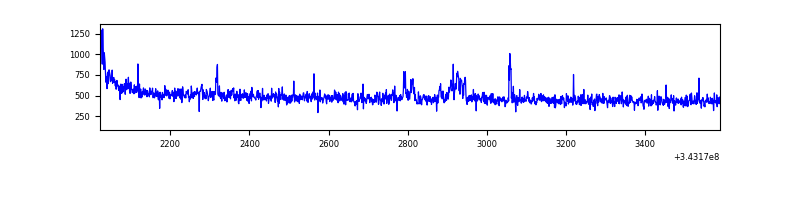 |
| D | 1567 | 1567 | 38 | 38 | 2.43% | 2.43% | 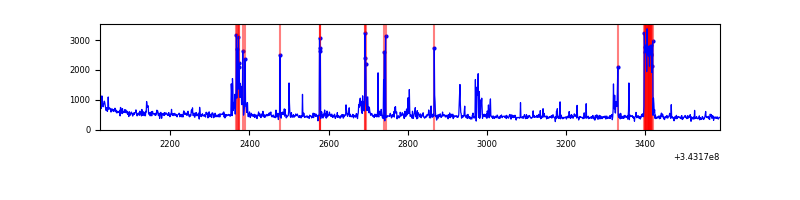 |
Top three noisy pixels from each quadrant. If the there are fewer than three noisy pixels in the level2.evt file, extra rows are filled as -1
| Pixel properties | Quadrant properties | ||||||
|---|---|---|---|---|---|---|---|
| Quadrant | DetID | PixID | Counts | Sigma | Mean | Median | Sigma |
| A | 8 | 192 | 5679 | 136.63 | 190 | 187 | 40.2 |
| A | 13 | 254 | 2987 | 69.66 | 190 | 187 | 40.2 |
| A | 3 | 137 | 1738 | 38.59 | 190 | 187 | 40.2 |
| B | 3 | 64 | 1966932 | 61212.69 | 161 | 158 | 32.1 |
| B | 10 | 245 | 51677 | 1603.45 | 161 | 158 | 32.1 |
| B | 0 | 190 | 11446 | 351.32 | 161 | 158 | 32.1 |
| C | 14 | 238 | 29714 | 668.01 | 181 | 183 | 44.2 |
| C | 3 | 233 | 26550 | 596.44 | 181 | 183 | 44.2 |
| C | 0 | 10 | 3329 | 71.16 | 181 | 183 | 44.2 |
| D | 1 | 52 | 100536 | 2287.22 | 178 | 173 | 43.9 |
| D | 2 | 250 | 67971 | 1545.08 | 178 | 173 | 43.9 |
| D | 2 | 120 | 8746 | 195.37 | 178 | 173 | 43.9 |
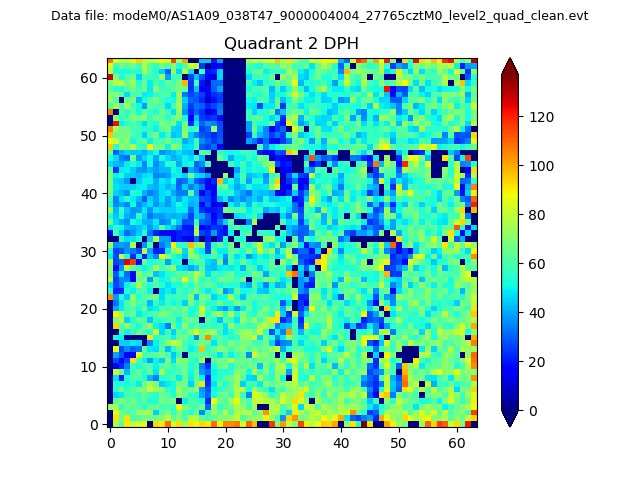
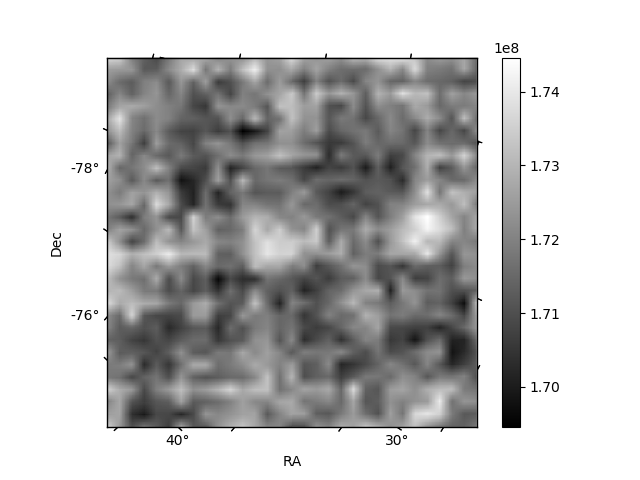
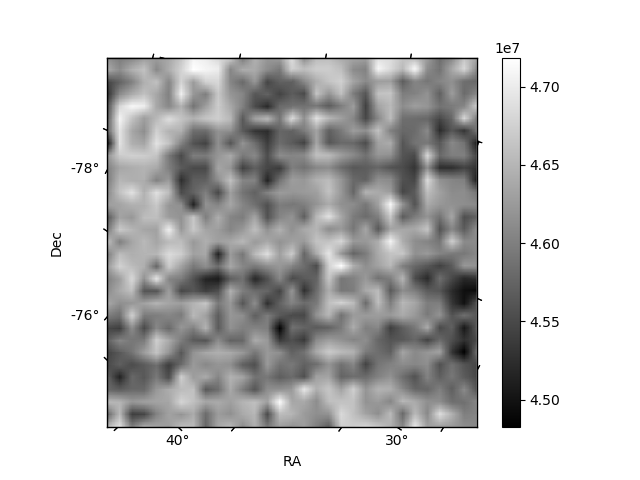
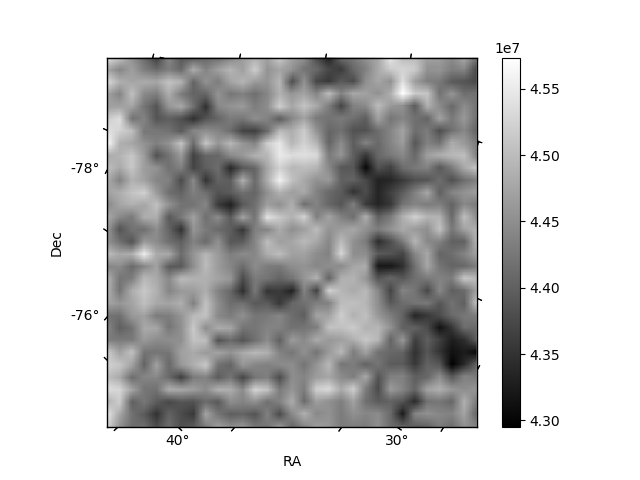
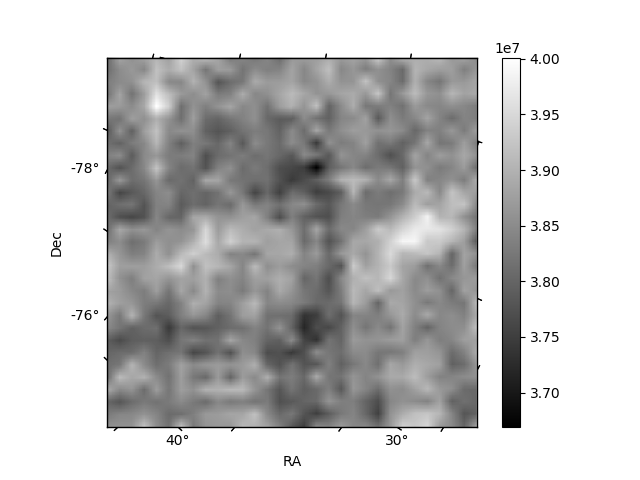
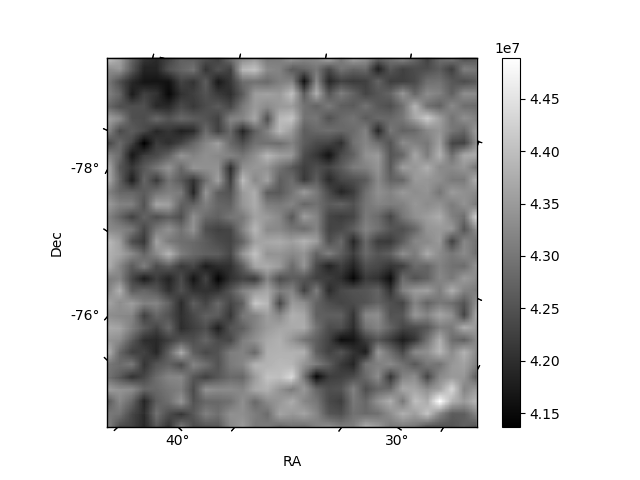
Histogram calculated using DETX and DETY for each event in the final _common_clean file
| Quadrant A | 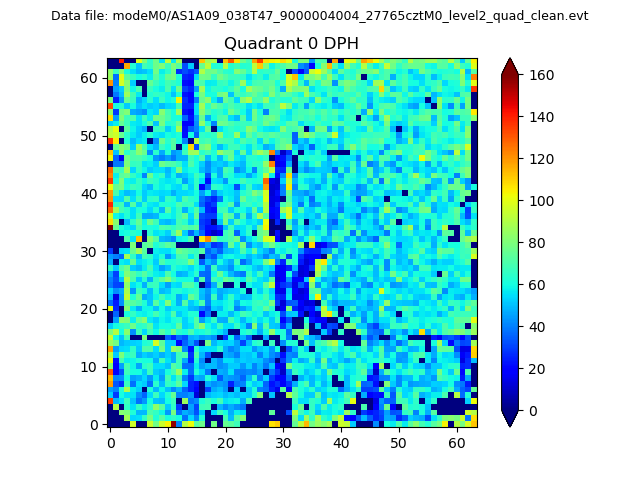 |
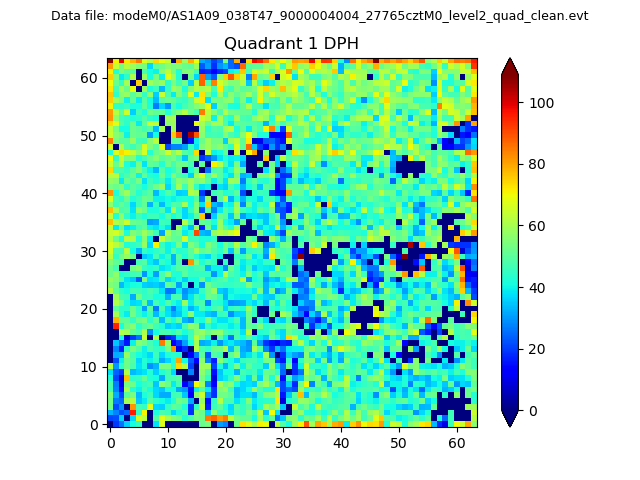 |
Quadrant B |
|---|---|---|---|
| Quadrant D | 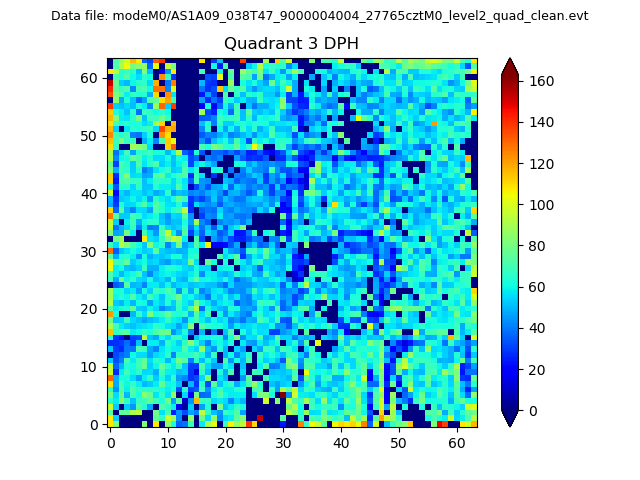 |
 |
Quadrant C |
| Plot type | Count rate plots | Images |
|---|---|---|
| Comparison with Poisson distribution Blue bars denote a histogram of data divided into 1 sec bins. Red curve is a Poisson curve with rate = median count rate of data. |
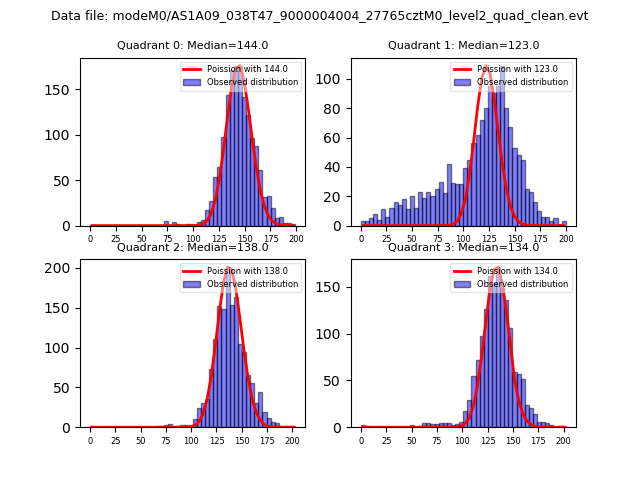 |
 |
| Quadrant-wise count rates Data is divided into 100 sec bins |
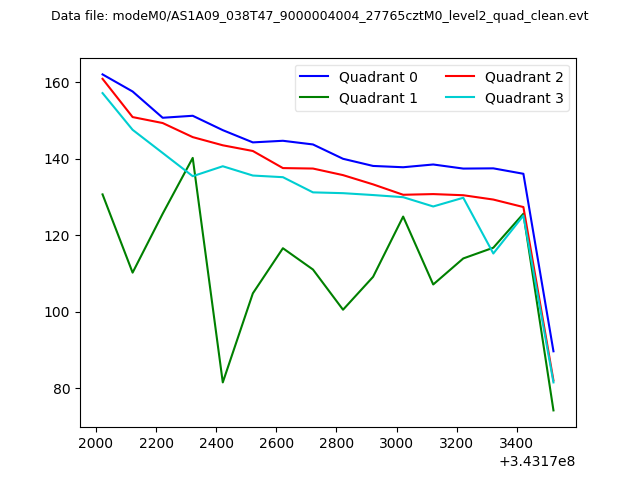 |
|
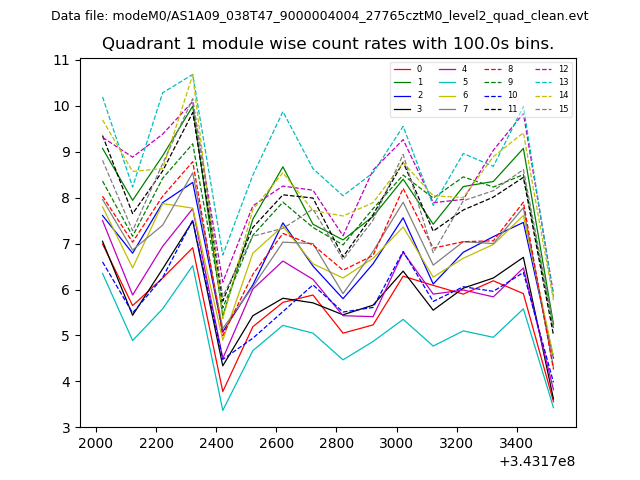
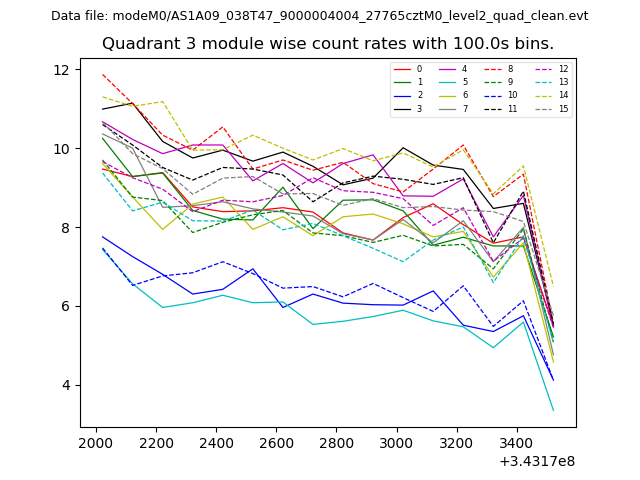
| Module-wise count rates for Quadrant A Data is divided into 100 sec bins |
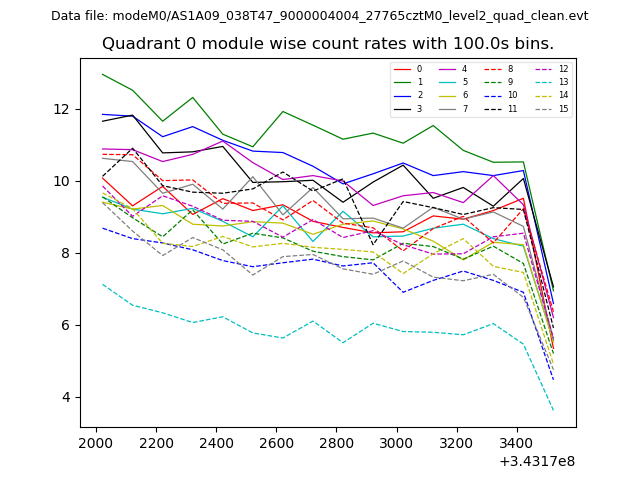 |
 |
| Module-wise count rates for Quadrant B Data is divided into 100 sec bins |
 |
 |
| Module-wise count rates for Quadrant C Data is divided into 100 sec bins |
 |
 |
| Module-wise count rates for Quadrant D Data is divided into 100 sec bins |
 |
 |
| Parameter | Plot |
|---|---|
| CZT HV Monitor | 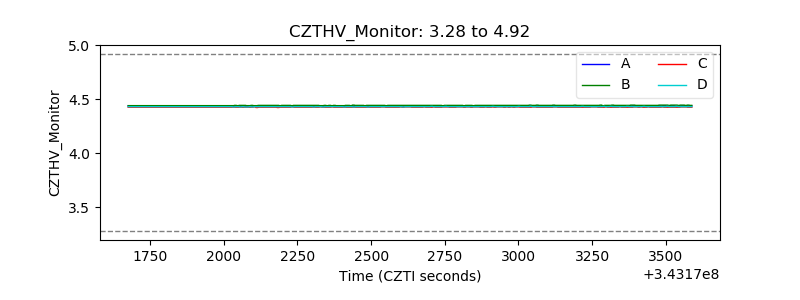 |
| D_VDD | 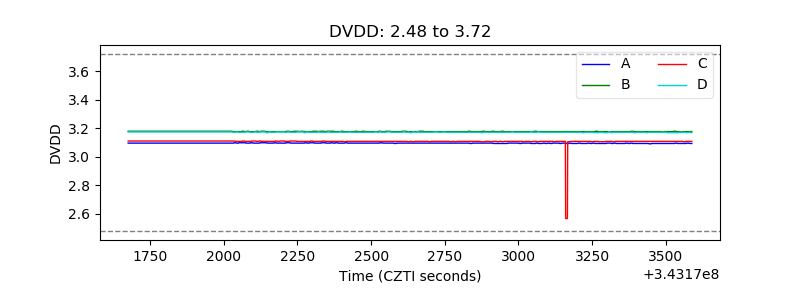 |
| Temperature 1 | 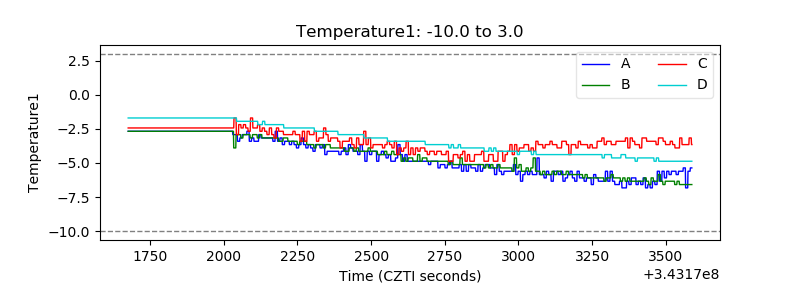 |
| Veto HV Monitor | 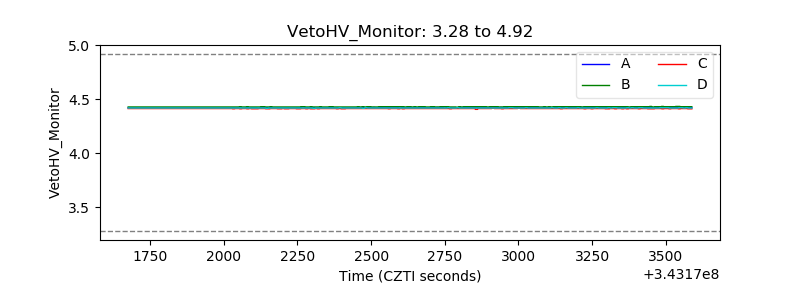 |
| Veto LLD | 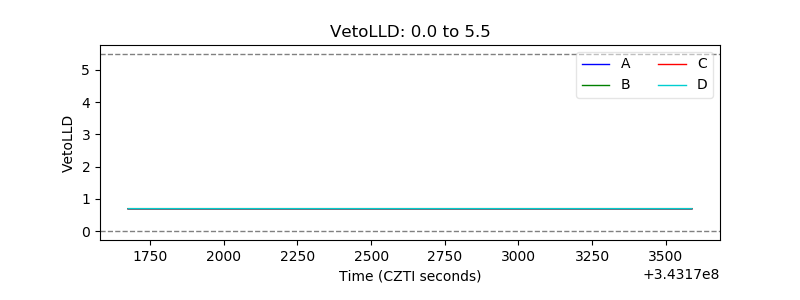 |
| Alpha Counter |  |
| _CPM_Rate | 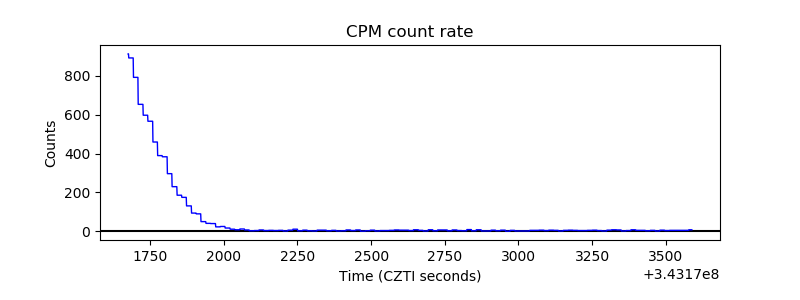 |
| CZT Counter | 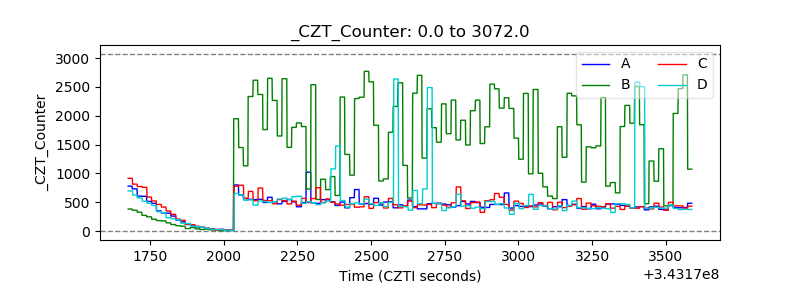 |
| +2.5 Volts monitor | 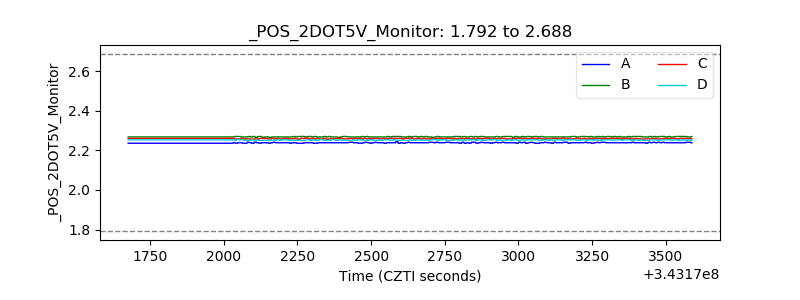 |
| +5 Volts monitor | 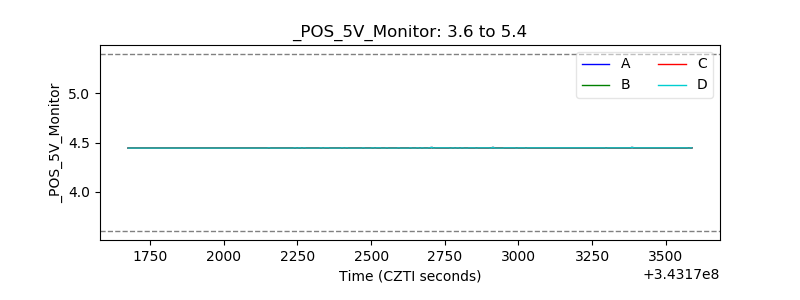 |
| _ROLL_ROT | 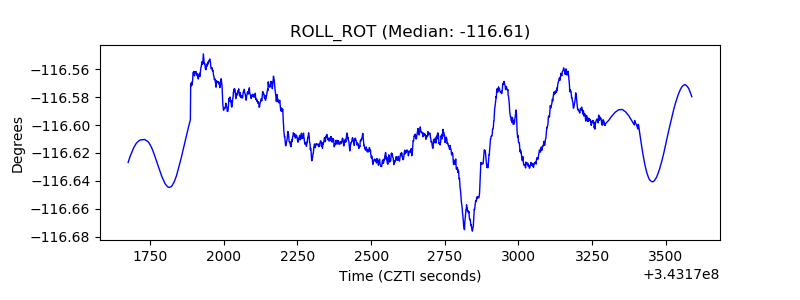 |
| _Roll_DEC | 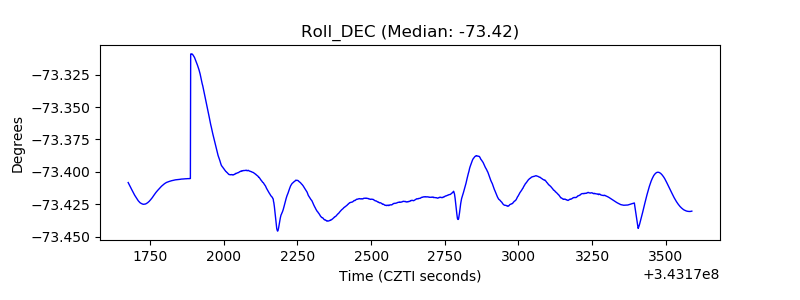 |
| _Roll_RA | 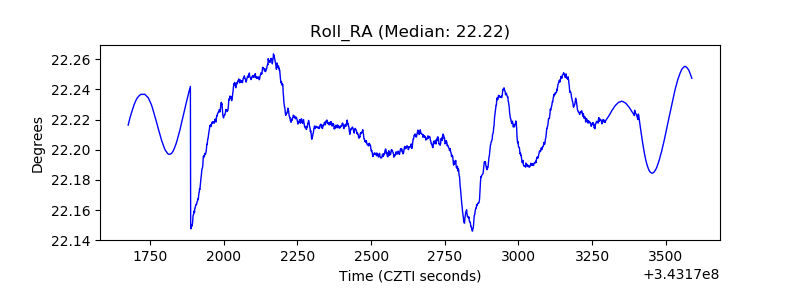 |
| Veto Counter | 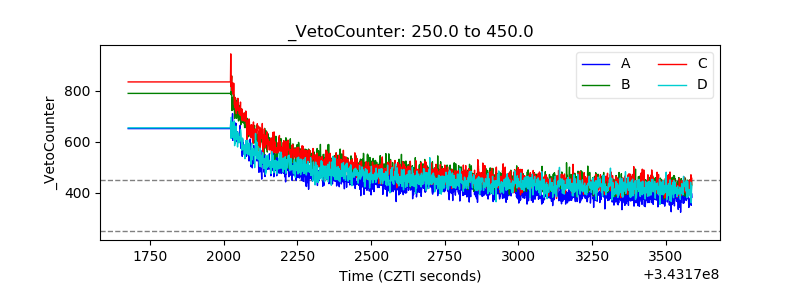 |