| Param | Original file | Final file |
|---|---|---|
| Filename | modeM0/AS1A09_038T34_9000004008cztM0_level2.fits | modeM0/AS1A09_038T34_9000004008cztM0_level2_quad_clean.evt |
| Size (bytes) | 96,897,600 | 134,046,720 |
| Size | 92.4 MB | 127.8 MB |
| Events in quadrant A | 588,918 | 876,588 |
| Events in quadrant B | 559,154 | 877,137 |
| Events in quadrant C | 564,870 | 820,183 |
| Events in quadrant D | 501,524 | 765,584 |
| Mode M9 | |||
|---|---|---|---|
| Quadrant | BADHDUFLAG | Total packets | Discarded packets |
| A | 0 | 2 | 0 |
| B | 0 | 2 | 0 |
| C | 0 | 2 | 0 |
| D | 0 | 2 | 0 |
| Mode M0 | |||
|---|---|---|---|
| Quadrant | BADHDUFLAG | Total packets | Discarded packets |
| A | 0 | 21257 | 0 |
| B | 0 | 22024 | 0 |
| C | 0 | 23307 | 0 |
| D | 0 | 23598 | 0 |
| Mode SS | |||
|---|---|---|---|
| Quadrant | BADHDUFLAG | Total packets | Discarded packets |
| A | 0 | 212 | 0 |
| B | 0 | 212 | 0 |
| C | 0 | 212 | 0 |
| D | 0 | 212 | 0 |
| Quadrant | Total seconds | Saturated seconds | Saturation percentage |
|---|---|---|---|
| A | 10390 | 120 | 1.154957% |
| B | 10390 | 190 | 1.828681% |
| C | 10390 | 261 | 2.512031% |
| D | 10390 | 178 | 1.713186% |
Noise dominated data is calculated using 1-second bins in cleaned event files. If a bin has >2000 counts, and if more than 50% of those come from <1% of pixels, then it is considered to be noise-dominated and hence unusable.
| Quadrant | # 1 sec bins | Bins with >0 counts | Bins with >2000 counts | High rate bins dominated by noise | Noise dominated (total time) | Noise dominated (detector-on time) | Marked lightcurve |
|---|---|---|---|---|---|---|---|
| A | 10645 | 10389 | 0 | 0 | 0.00% | 0.00% |  |
| B | 10645 | 10389 | 0 | 0 | 0.00% | 0.00% | 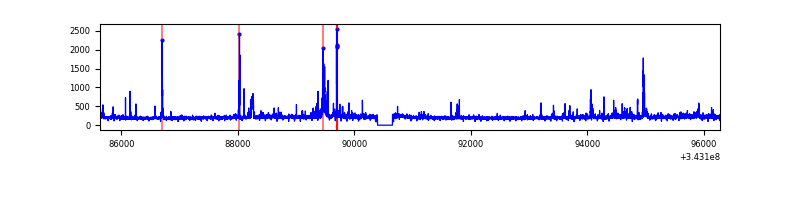 |
| C | 10645 | 10389 | 0 | 0 | 0.00% | 0.00% |  |
| D | 10645 | 10385 | 0 | 0 | 0.00% | 0.00% |  |
Top three noisy pixels from each quadrant. If the there are fewer than three noisy pixels in the level2.evt file, extra rows are filled as -1
| Pixel properties | Quadrant properties | ||||||
|---|---|---|---|---|---|---|---|
| Quadrant | DetID | PixID | Counts | Sigma | Mean | Median | Sigma |
| A | 0 | 29 | 579 | 10.95 | 153 | 143 | 39.8 |
| A | 7 | 110 | 490 | 8.72 | 153 | 143 | 39.8 |
| A | 0 | 30 | 438 | 7.41 | 153 | 143 | 39.8 |
| B | 2 | 9 | 457 | 9.96 | 148 | 142 | 31.6 |
| B | 14 | 254 | 400 | 8.16 | 148 | 142 | 31.6 |
| B | 2 | 8 | 365 | 7.05 | 148 | 142 | 31.6 |
| C | 7 | 111 | 394 | 6.47 | 149 | 139 | 39.4 |
| C | 3 | 126 | 394 | 6.47 | 149 | 139 | 39.4 |
| C | 12 | 241 | 388 | 6.32 | 149 | 139 | 39.4 |
| D | 4 | 246 | 422 | 7.3 | 143 | 130 | 40.0 |
| D | 10 | 189 | 375 | 6.13 | 143 | 130 | 40.0 |
| D | 6 | 38 | 364 | 5.85 | 143 | 130 | 40.0 |
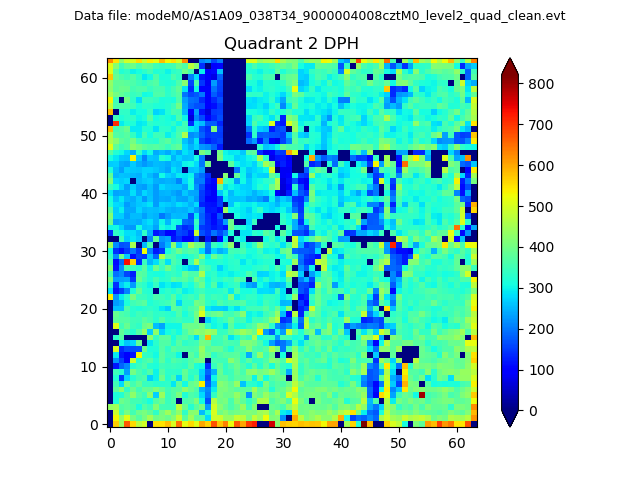
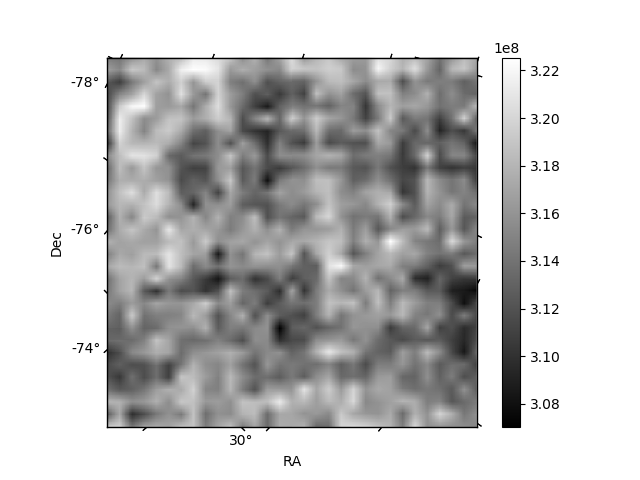
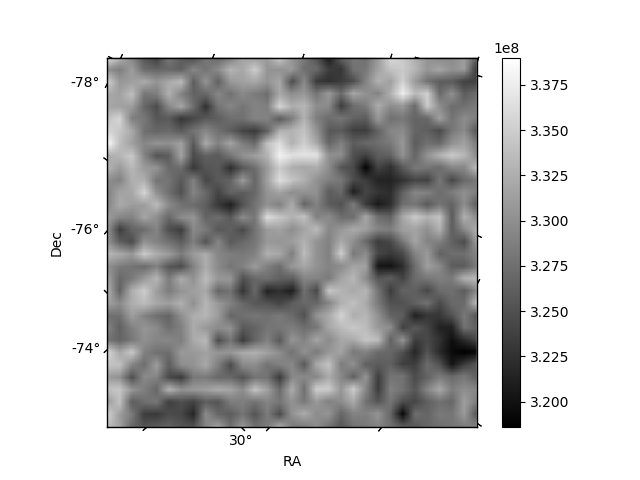
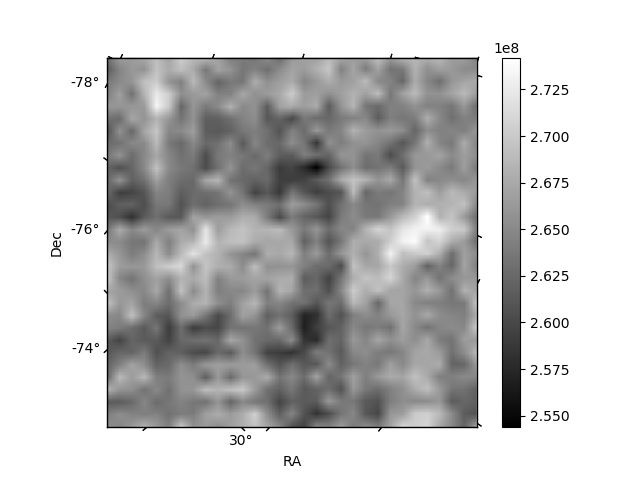
Histogram calculated using DETX and DETY for each event in the final _common_clean file
| Quadrant A | 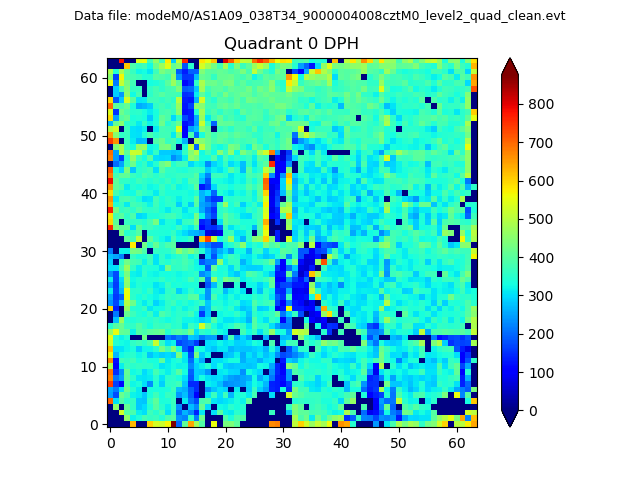 |
 |
Quadrant B |
|---|---|---|---|
| Quadrant D |  |
 |
Quadrant C |
| Plot type | Count rate plots | Images |
|---|---|---|
| Comparison with Poisson distribution Blue bars denote a histogram of data divided into 1 sec bins. Red curve is a Poisson curve with rate = median count rate of data. |
 |
 |
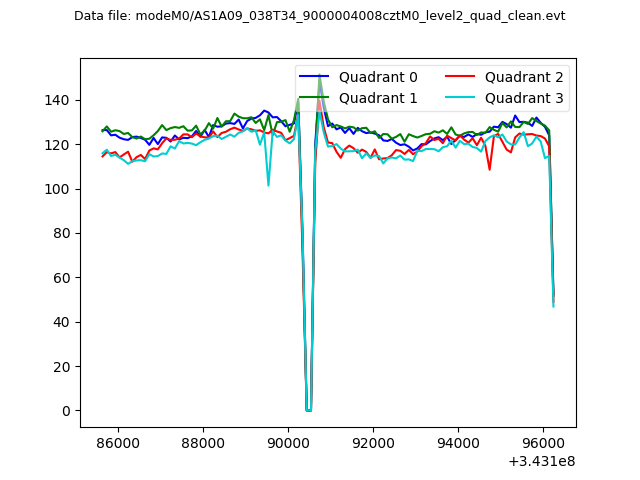
| Quadrant-wise count rates Data is divided into 100 sec bins |
 |
|
| Module-wise count rates for Quadrant A Data is divided into 100 sec bins |
 |
 |
| Module-wise count rates for Quadrant B Data is divided into 100 sec bins |
 |
 |
| Module-wise count rates for Quadrant C Data is divided into 100 sec bins |
 |
 |
| Module-wise count rates for Quadrant D Data is divided into 100 sec bins |
 |
 |
| Parameter | Plot |
|---|---|
| CZT HV Monitor | 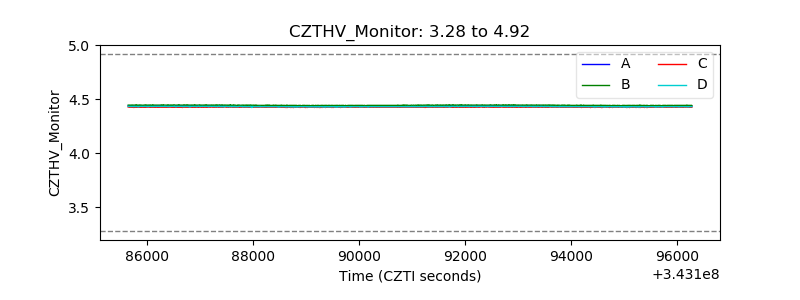 |
| D_VDD | 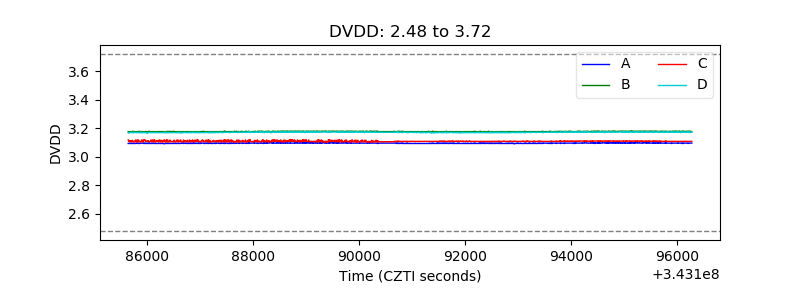 |
| Temperature 1 |  |
| Veto HV Monitor |  |
| Veto LLD |  |
| Alpha Counter |  |
| _CPM_Rate |  |
| CZT Counter |  |
| +2.5 Volts monitor |  |
| +5 Volts monitor | 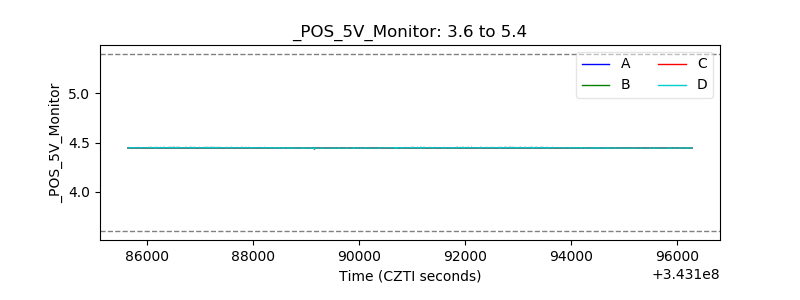 |
| _ROLL_ROT | 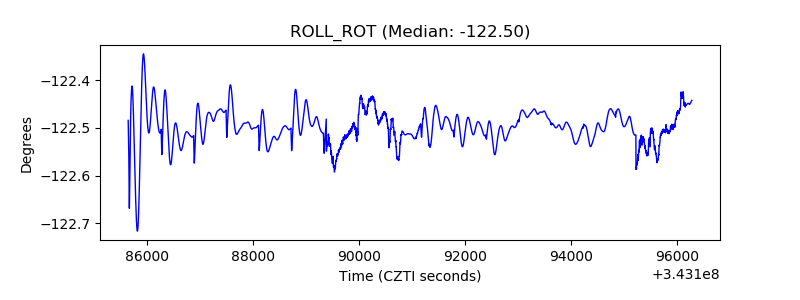 |
| _Roll_DEC |  |
| _Roll_RA | 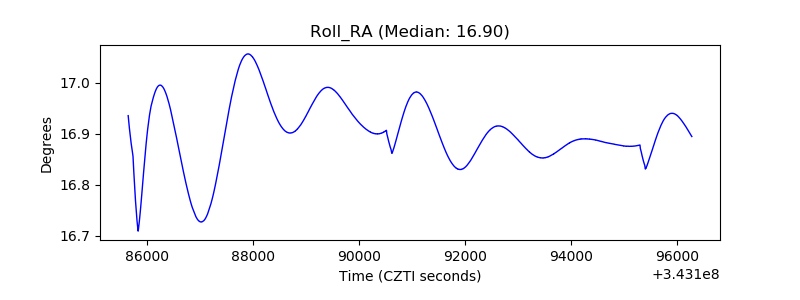 |
| Veto Counter |  |