| Param | Original file | Final file |
|---|---|---|
| Filename | modeM0/AS1A09_038T34_9000004008_27766cztM0_level2.evt | modeM0/AS1A09_038T34_9000004008_27766cztM0_level2_quad_clean.evt |
| Size (bytes) | 33,134,400 | 9,961,920 |
| Size | 31.6 MB | 9.5 MB |
| Events in quadrant A | 220,778 | 66,060 |
| Events in quadrant B | 243,913 | 67,276 |
| Events in quadrant C | 277,347 | 61,268 |
| Events in quadrant D | 221,844 | 61,552 |
| Mode M0 | |||
|---|---|---|---|
| Quadrant | BADHDUFLAG | Total packets | Discarded packets |
| A | 0 | 1065 | 0 |
| B | 0 | 1095 | 0 |
| C | 0 | 1143 | 0 |
| D | 0 | 1073 | 0 |
| Quadrant | Total seconds | Saturated seconds | Saturation percentage |
|---|---|---|---|
| A | 533 | 0 | 0.000000% |
| B | 533 | 0 | 0.000000% |
| C | 533 | 2 | 0.375235% |
| D | 533 | 0 | 0.000000% |
Noise dominated data is calculated using 1-second bins in cleaned event files. If a bin has >2000 counts, and if more than 50% of those come from <1% of pixels, then it is considered to be noise-dominated and hence unusable.
| Quadrant | # 1 sec bins | Bins with >0 counts | Bins with >2000 counts | High rate bins dominated by noise | Noise dominated (total time) | Noise dominated (detector-on time) | Marked lightcurve |
|---|---|---|---|---|---|---|---|
| A | 533 | 533 | 0 | 0 | 0.00% | 0.00% | 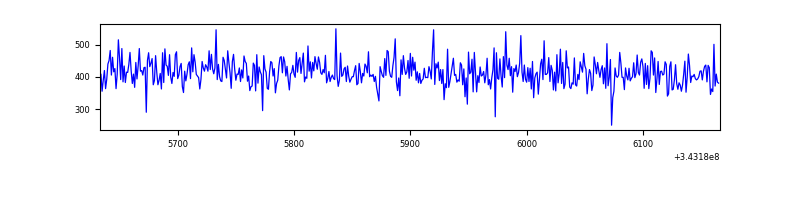 |
| B | 533 | 533 | 0 | 0 | 0.00% | 0.00% | 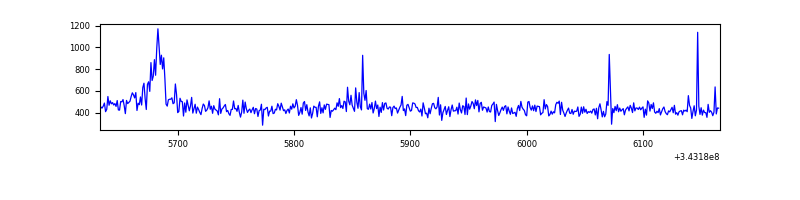 |
| C | 533 | 533 | 0 | 0 | 0.00% | 0.00% | 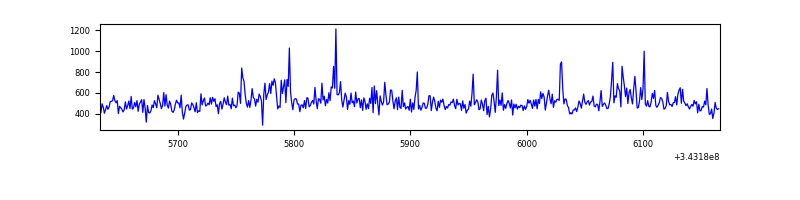 |
| D | 533 | 533 | 0 | 0 | 0.00% | 0.00% | 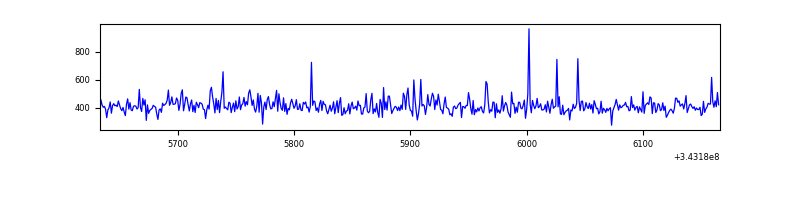 |
Top three noisy pixels from each quadrant. If the there are fewer than three noisy pixels in the level2.evt file, extra rows are filled as -1
| Pixel properties | Quadrant properties | ||||||
|---|---|---|---|---|---|---|---|
| Quadrant | DetID | PixID | Counts | Sigma | Mean | Median | Sigma |
| A | 13 | 254 | 923 | 63.72 | 56 | 55 | 13.6 |
| A | 3 | 137 | 517 | 33.92 | 56 | 55 | 13.6 |
| A | 0 | 226 | 479 | 31.13 | 56 | 55 | 13.6 |
| B | 0 | 230 | 13831 | 1041.76 | 57 | 56 | 13.2 |
| B | 3 | 64 | 2455 | 181.43 | 57 | 56 | 13.2 |
| B | 12 | 111 | 1271 | 91.89 | 57 | 56 | 13.2 |
| C | 3 | 233 | 45807 | 3044.22 | 56 | 56 | 15.0 |
| C | 14 | 238 | 9401 | 621.81 | 56 | 56 | 15.0 |
| C | 8 | 128 | 1116 | 70.53 | 56 | 56 | 15.0 |
| D | 1 | 52 | 8602 | 544.13 | 55 | 53 | 15.7 |
| D | 2 | 234 | 1774 | 109.54 | 55 | 53 | 15.7 |
| D | 13 | 104 | 1621 | 99.8 | 55 | 53 | 15.7 |
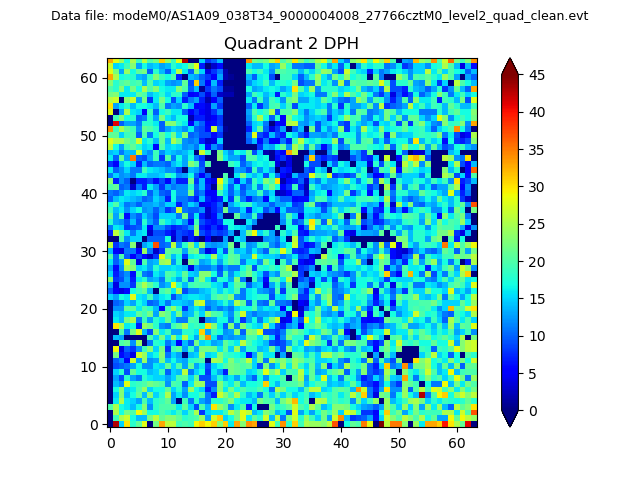
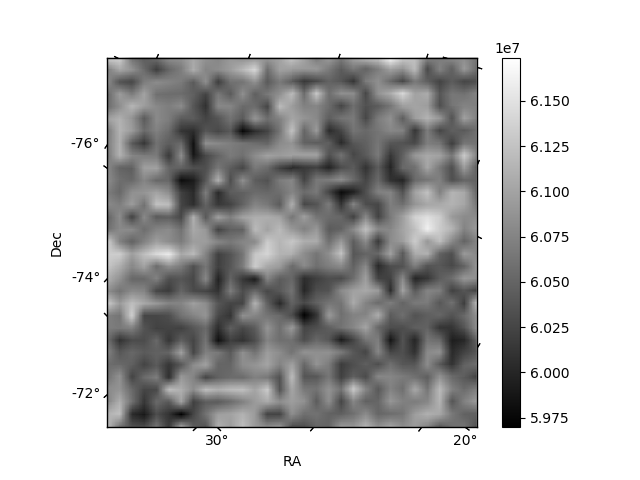
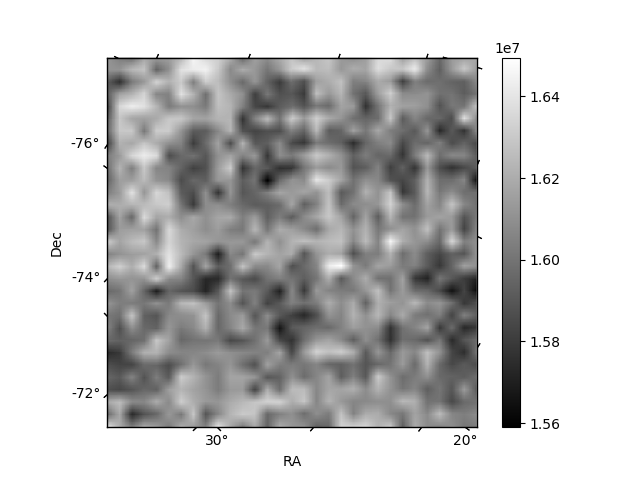
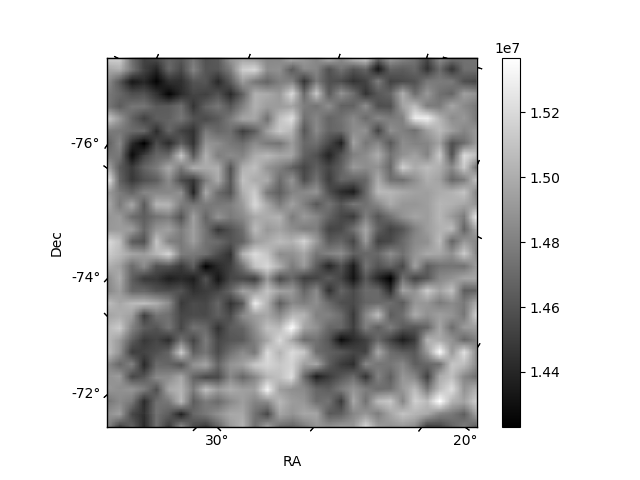
Histogram calculated using DETX and DETY for each event in the final _common_clean file
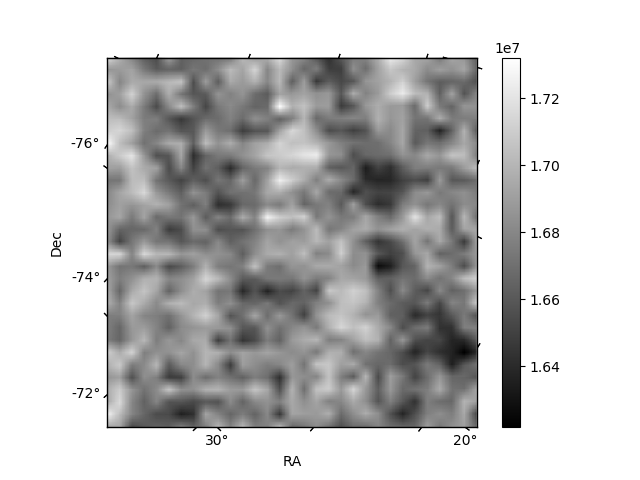
| Quadrant A | 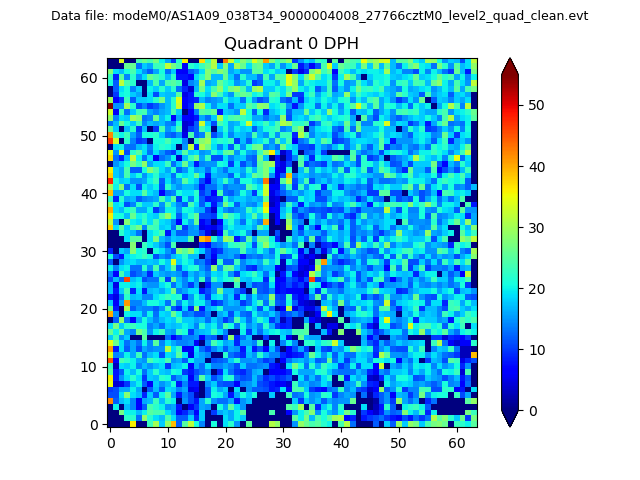 |
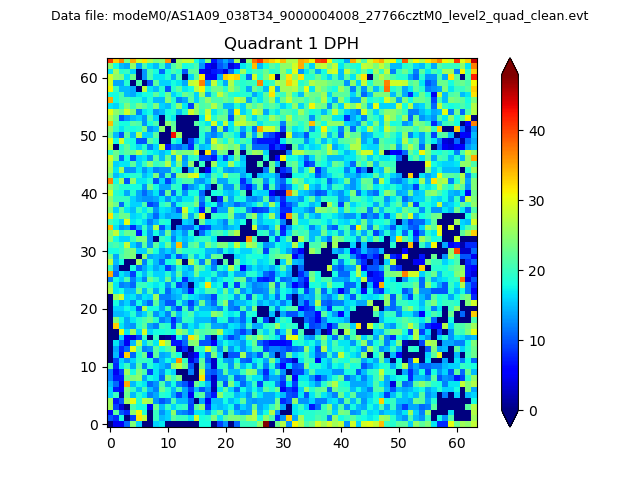 |
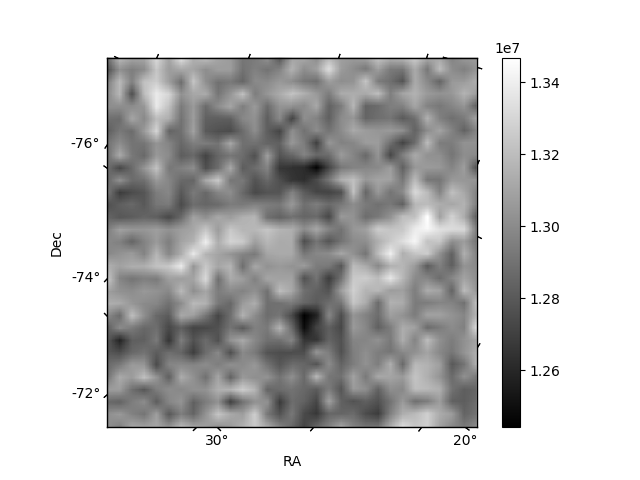
Quadrant B |
|---|---|---|---|
| Quadrant D | 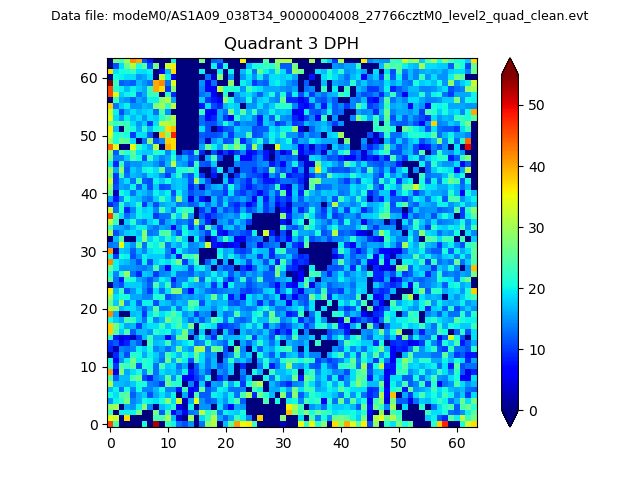 |
 |
Quadrant C |
| Plot type | Count rate plots | Images |
|---|---|---|
| Comparison with Poisson distribution Blue bars denote a histogram of data divided into 1 sec bins. Red curve is a Poisson curve with rate = median count rate of data. |
 |
 |
| Quadrant-wise count rates Data is divided into 100 sec bins |
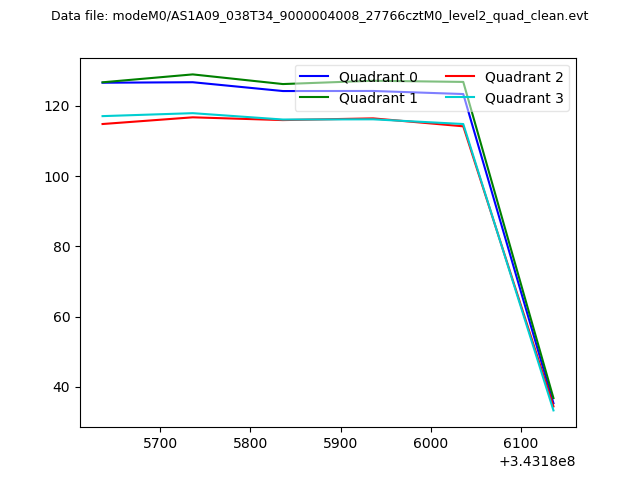 |
|
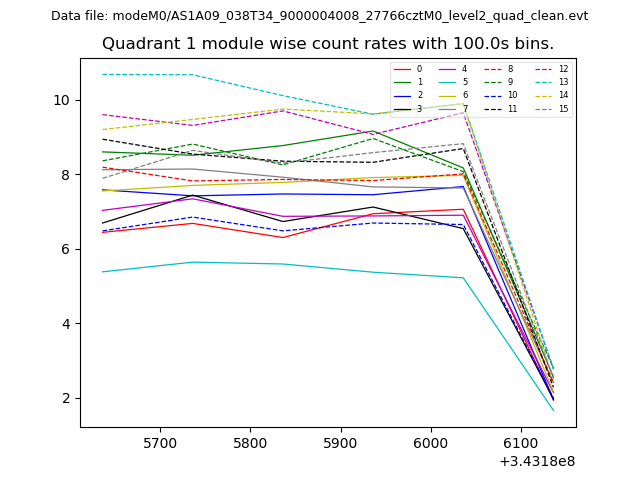
| Module-wise count rates for Quadrant A Data is divided into 100 sec bins |
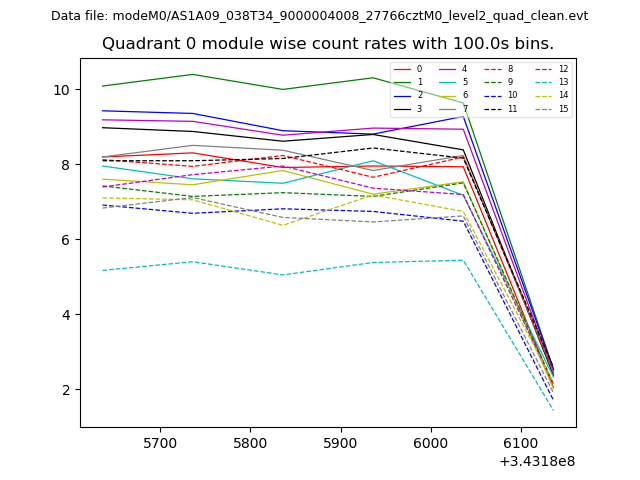 |
 |
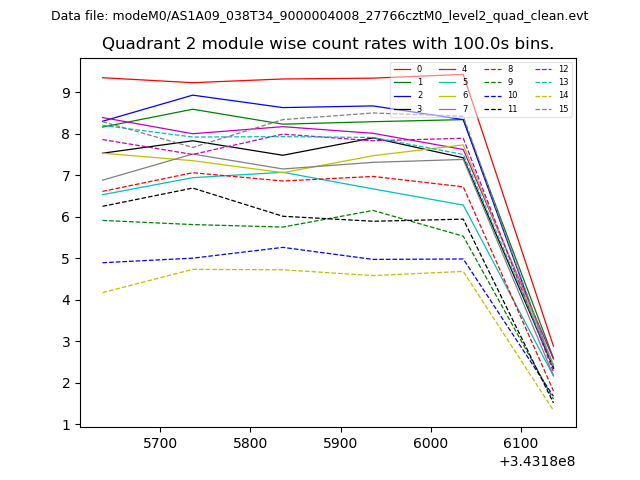
| Module-wise count rates for Quadrant B Data is divided into 100 sec bins |
 |
 |
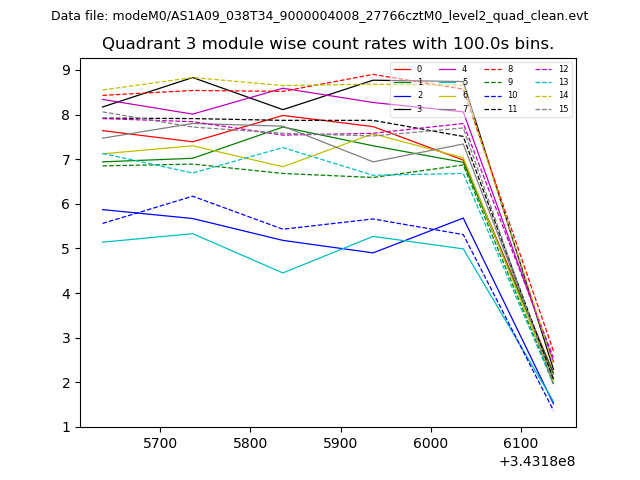
| Module-wise count rates for Quadrant C Data is divided into 100 sec bins |
 |
 |
| Module-wise count rates for Quadrant D Data is divided into 100 sec bins |
 |
 |
| Parameter | Plot |
|---|---|
| CZT HV Monitor | 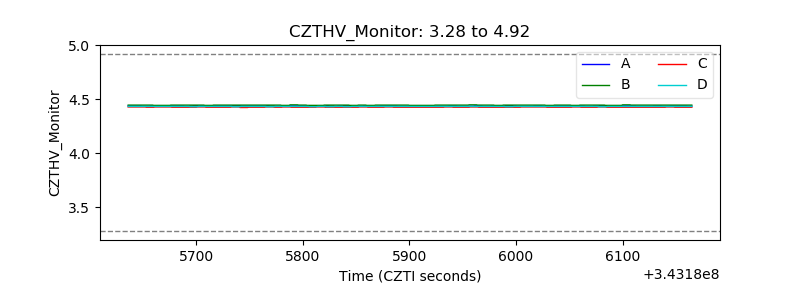 |
| D_VDD | 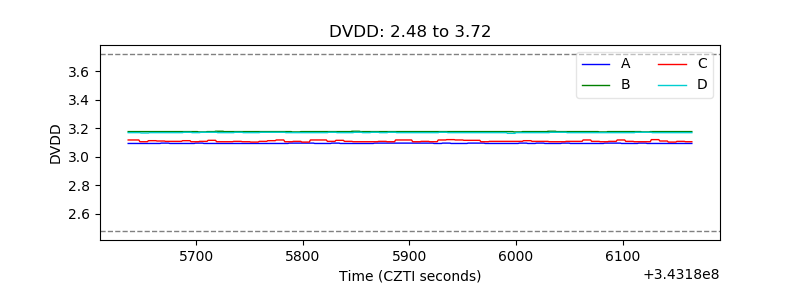 |
| Temperature 1 | 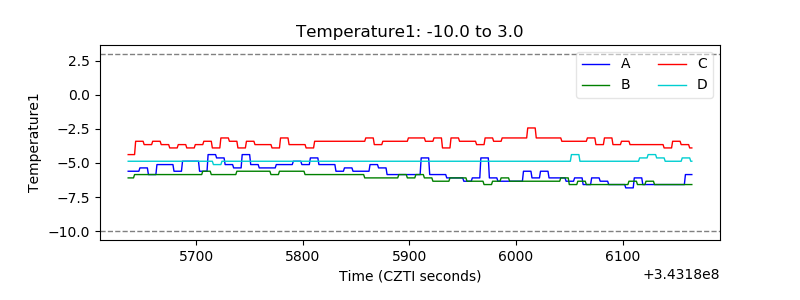 |
| Veto HV Monitor | 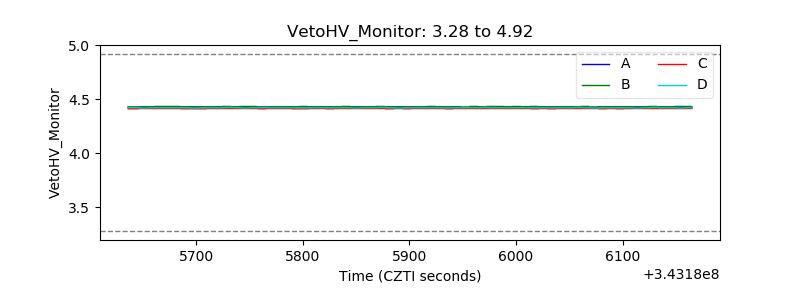 |
| Veto LLD | 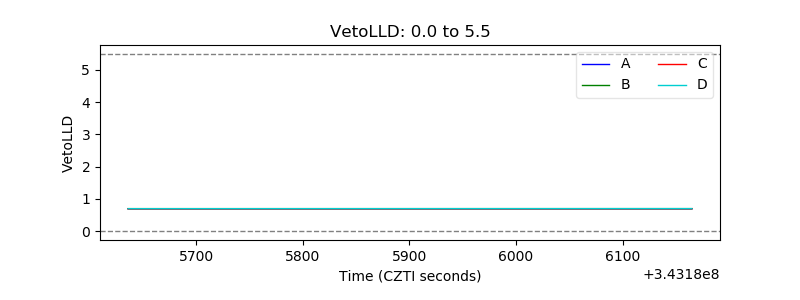 |
| Alpha Counter | 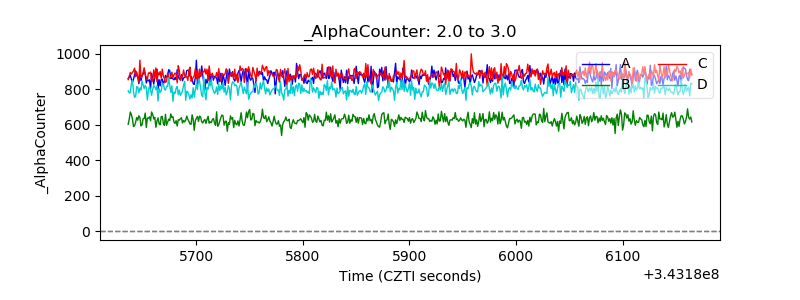 |
| _CPM_Rate | 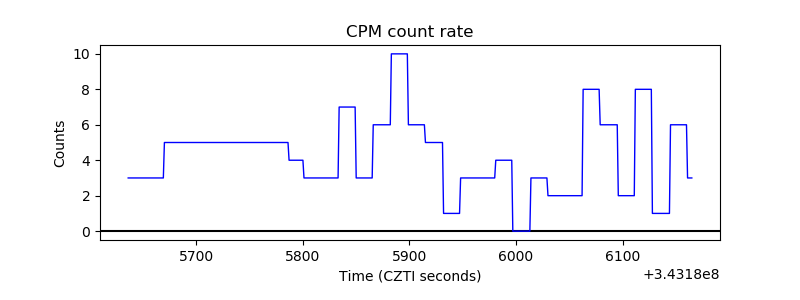 |
| CZT Counter | 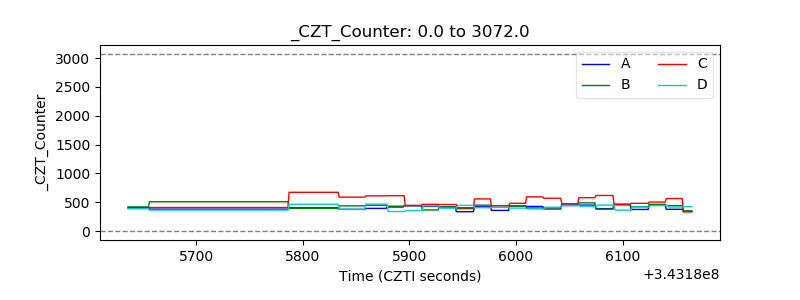 |
| +2.5 Volts monitor |  |
| +5 Volts monitor |  |
| _ROLL_ROT | 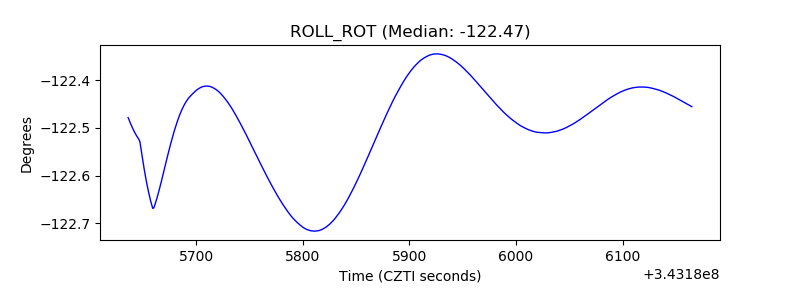 |
| _Roll_DEC | 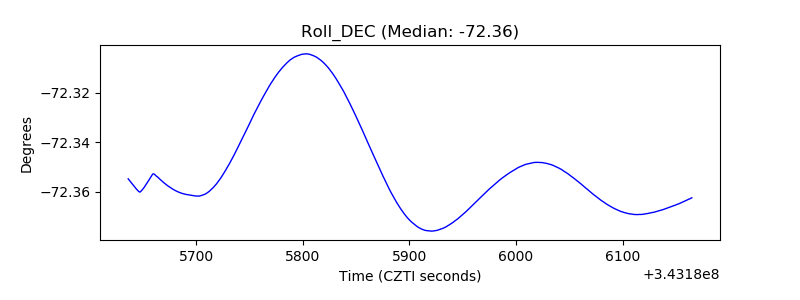 |
| _Roll_RA | 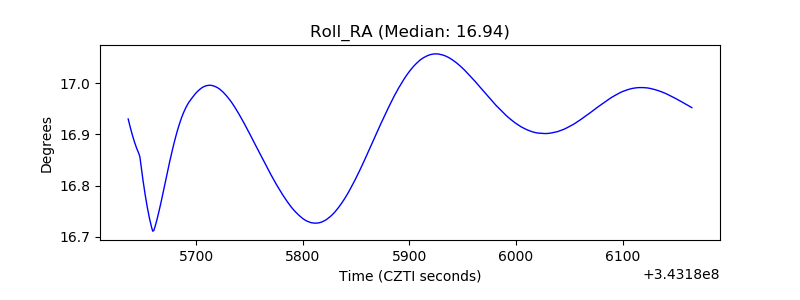 |
| Veto Counter |  |