| Param | Original file | Final file |
|---|---|---|
| Filename | modeM0/AS1A09_038T34_9000004008_27767cztM0_level2.evt | modeM0/AS1A09_038T34_9000004008_27767cztM0_level2_quad_clean.evt |
| Size (bytes) | 439,574,400 | 119,888,640 |
| Size | 419.2 MB | 114.3 MB |
| Events in quadrant A | 2,986,311 | 815,692 |
| Events in quadrant B | 3,207,461 | 823,040 |
| Events in quadrant C | 3,492,515 | 777,603 |
| Events in quadrant D | 3,189,515 | 766,840 |
| Mode M9 | |||
|---|---|---|---|
| Quadrant | BADHDUFLAG | Total packets | Discarded packets |
| A | 0 | 2 | 0 |
| B | 0 | 2 | 0 |
| C | 0 | 2 | 0 |
| D | 0 | 2 | 0 |
| Mode M0 | |||
|---|---|---|---|
| Quadrant | BADHDUFLAG | Total packets | Discarded packets |
| A | 0 | 13290 | 0 |
| B | 0 | 13791 | 0 |
| C | 0 | 14377 | 0 |
| D | 0 | 14018 | 0 |
| Quadrant | Total seconds | Saturated seconds | Saturation percentage |
|---|---|---|---|
| A | 6412 | 119 | 1.855895% |
| B | 6411 | 181 | 2.823273% |
| C | 6411 | 189 | 2.948058% |
| D | 6411 | 151 | 2.355327% |
Noise dominated data is calculated using 1-second bins in cleaned event files. If a bin has >2000 counts, and if more than 50% of those come from <1% of pixels, then it is considered to be noise-dominated and hence unusable.
| Quadrant | # 1 sec bins | Bins with >0 counts | Bins with >2000 counts | High rate bins dominated by noise | Noise dominated (total time) | Noise dominated (detector-on time) | Marked lightcurve |
|---|---|---|---|---|---|---|---|
| A | 6667 | 6413 | 0 | 0 | 0.00% | 0.00% | 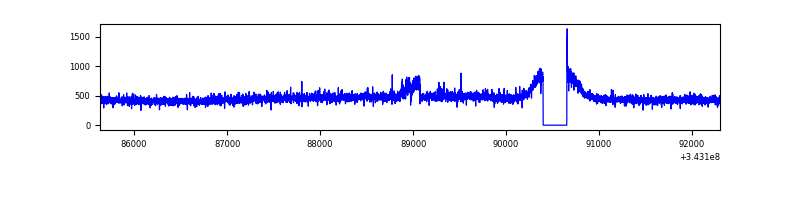 |
| B | 6666 | 6411 | 19 | 19 | 0.29% | 0.30% | 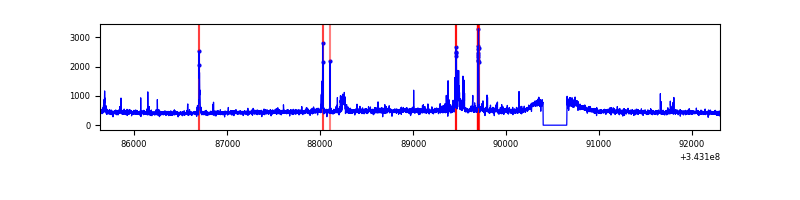 |
| C | 6666 | 6411 | 7 | 7 | 0.11% | 0.11% | 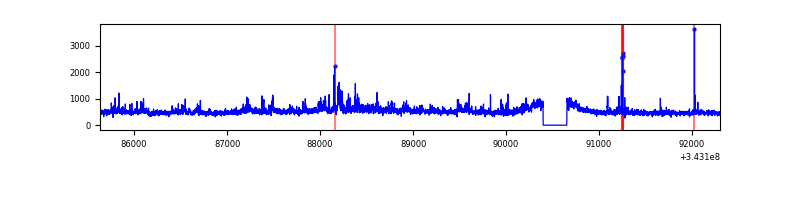 |
| D | 6666 | 6411 | 57 | 57 | 0.86% | 0.89% | 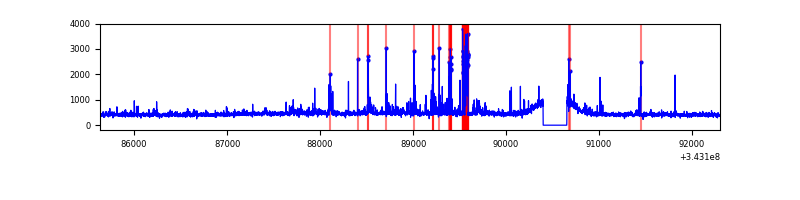 |
Top three noisy pixels from each quadrant. If the there are fewer than three noisy pixels in the level2.evt file, extra rows are filled as -1
| Pixel properties | Quadrant properties | ||||||
|---|---|---|---|---|---|---|---|
| Quadrant | DetID | PixID | Counts | Sigma | Mean | Median | Sigma |
| A | 13 | 170 | 35521 | 227.38 | 762 | 743 | 152.9 |
| A | 13 | 254 | 11147 | 68.02 | 762 | 743 | 152.9 |
| A | 3 | 137 | 7269 | 42.67 | 762 | 743 | 152.9 |
| B | 3 | 64 | 115409 | 795.57 | 757 | 737 | 144.1 |
| B | 0 | 190 | 30435 | 206.04 | 757 | 737 | 144.1 |
| B | 0 | 230 | 25763 | 173.63 | 757 | 737 | 144.1 |
| C | 3 | 233 | 482262 | 2809.75 | 730 | 733 | 171.4 |
| C | 14 | 238 | 115757 | 671.17 | 730 | 733 | 171.4 |
| C | 2 | 16 | 32429 | 184.95 | 730 | 733 | 171.4 |
| D | 1 | 52 | 130399 | 734.91 | 736 | 711 | 176.5 |
| D | 14 | 35 | 115241 | 649.02 | 736 | 711 | 176.5 |
| D | 2 | 250 | 95504 | 537.17 | 736 | 711 | 176.5 |
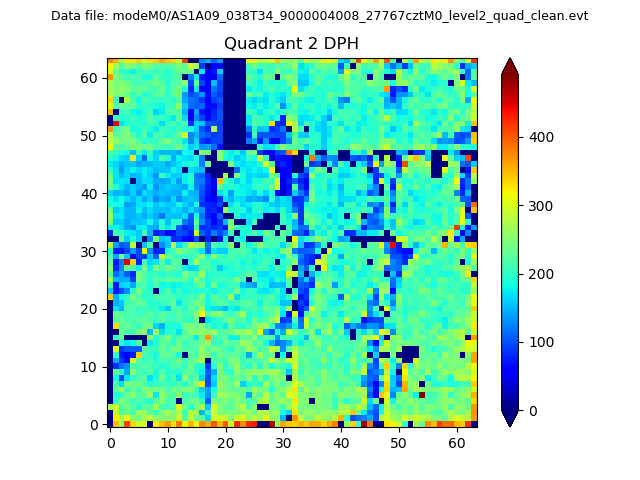
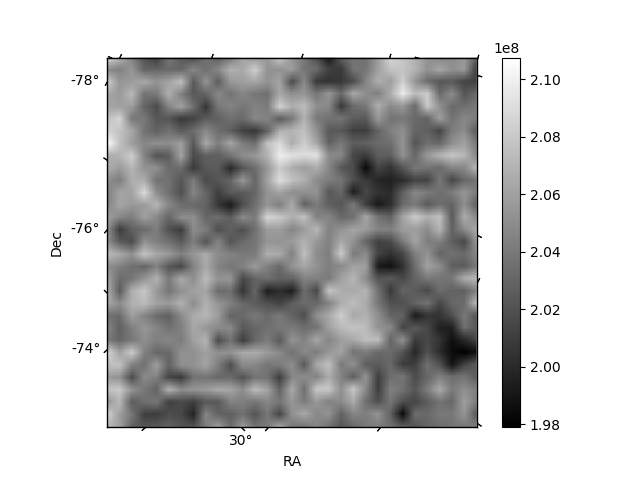
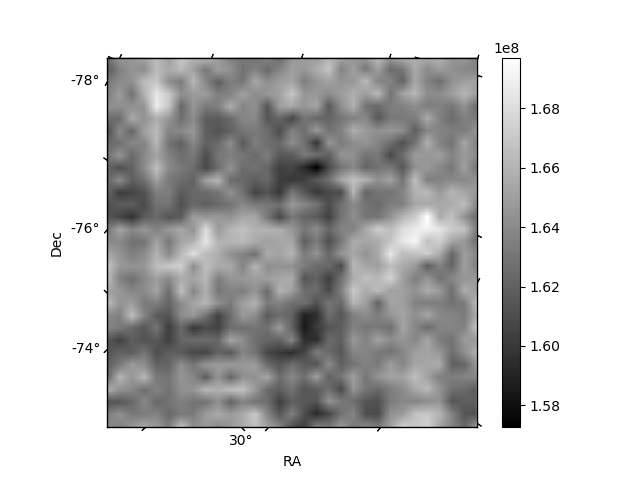
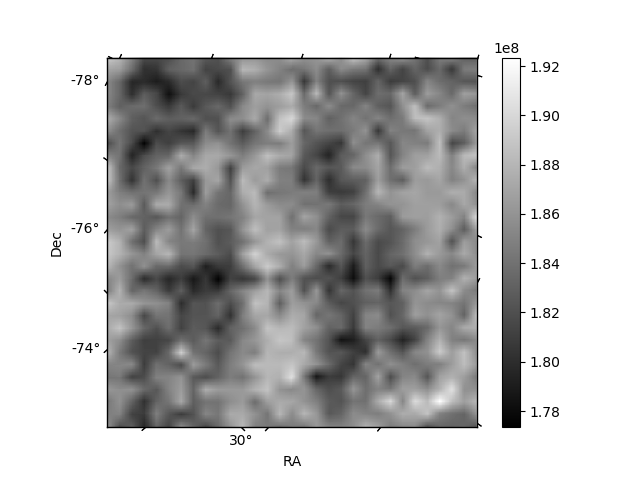
Histogram calculated using DETX and DETY for each event in the final _common_clean file
| Quadrant A | 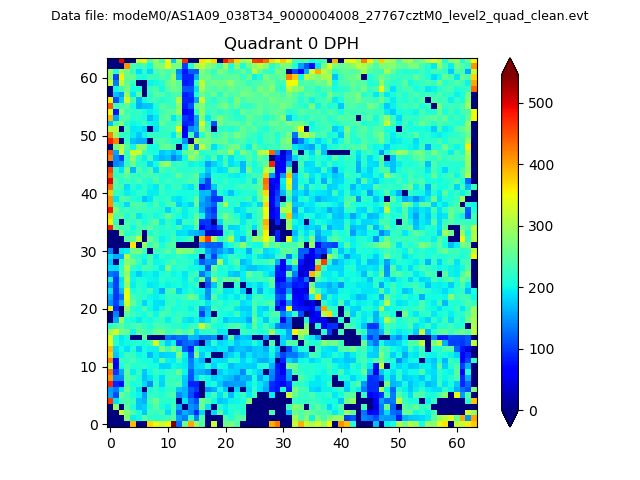 |
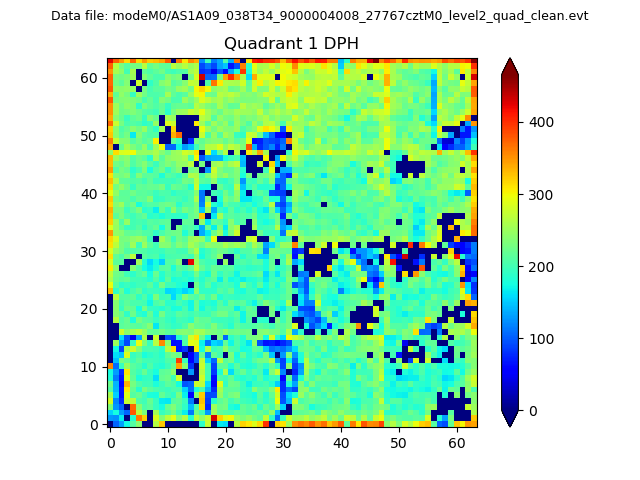 |
Quadrant B |
|---|---|---|---|
| Quadrant D | 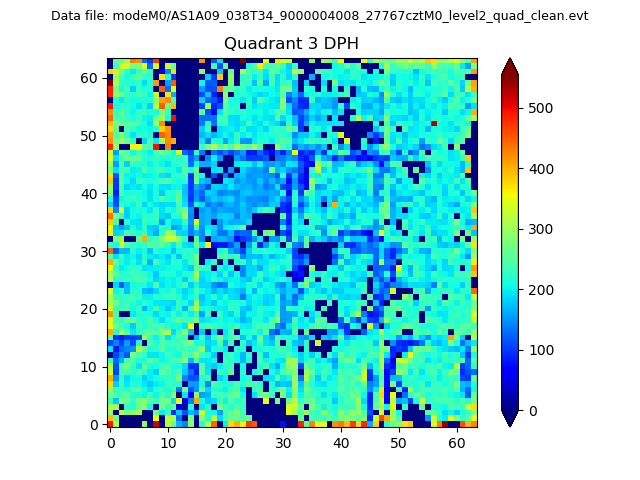 |
 |
Quadrant C |
| Plot type | Count rate plots | Images |
|---|---|---|
| Comparison with Poisson distribution Blue bars denote a histogram of data divided into 1 sec bins. Red curve is a Poisson curve with rate = median count rate of data. |
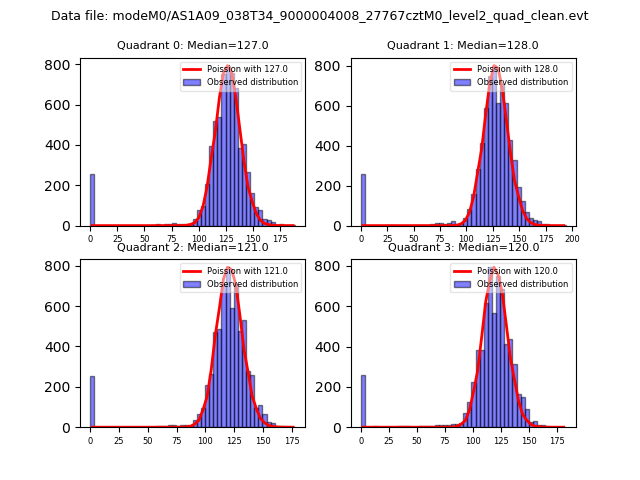 |
 |
| Quadrant-wise count rates Data is divided into 100 sec bins |
 |
|
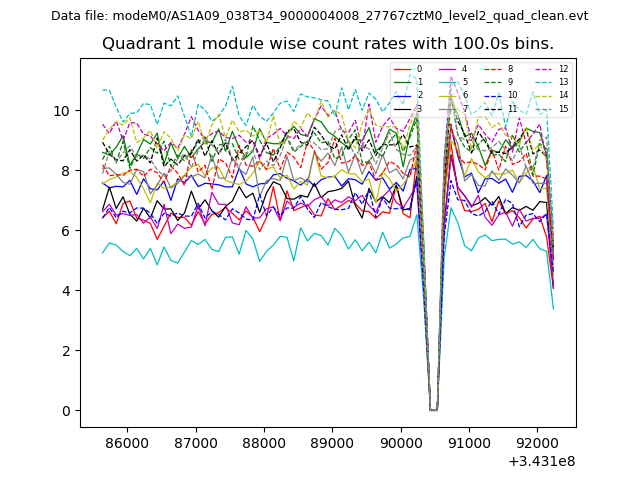
| Module-wise count rates for Quadrant A Data is divided into 100 sec bins |
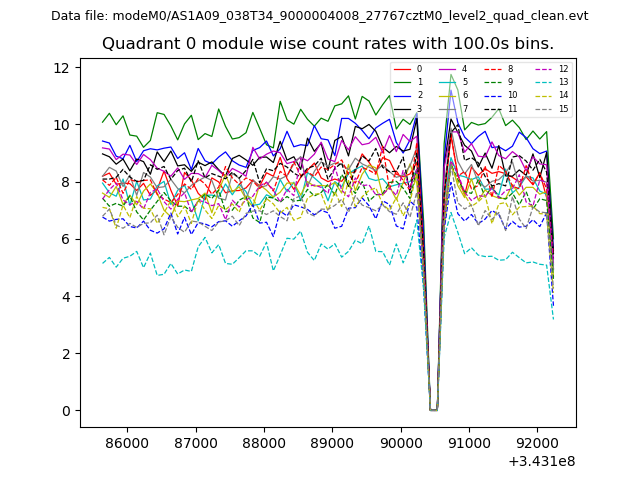 |
 |
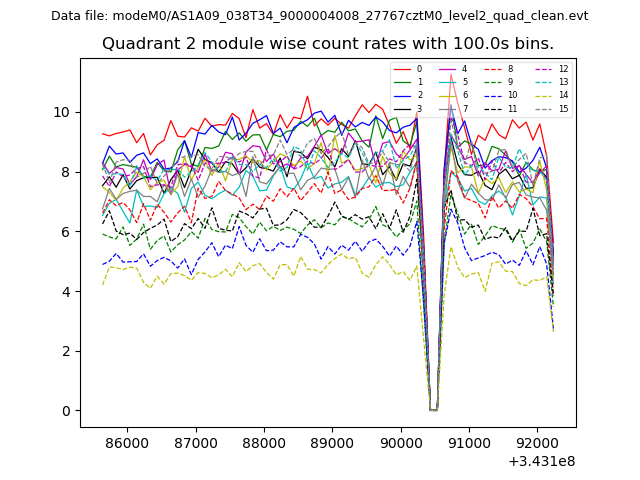
| Module-wise count rates for Quadrant B Data is divided into 100 sec bins |
 |
 |
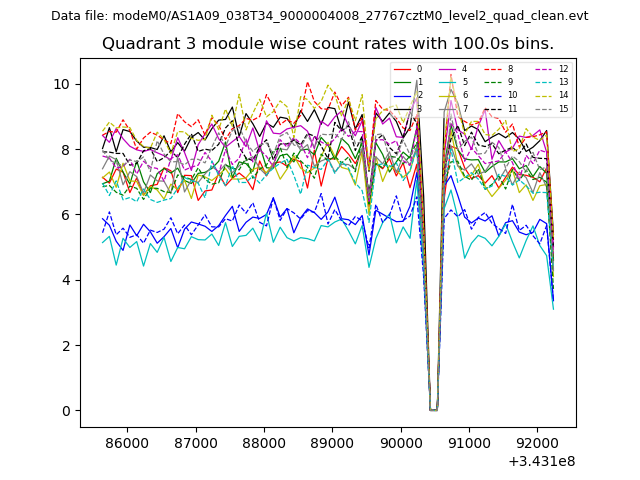
| Module-wise count rates for Quadrant C Data is divided into 100 sec bins |
 |
 |
| Module-wise count rates for Quadrant D Data is divided into 100 sec bins |
 |
 |
| Parameter | Plot |
|---|---|
| CZT HV Monitor | 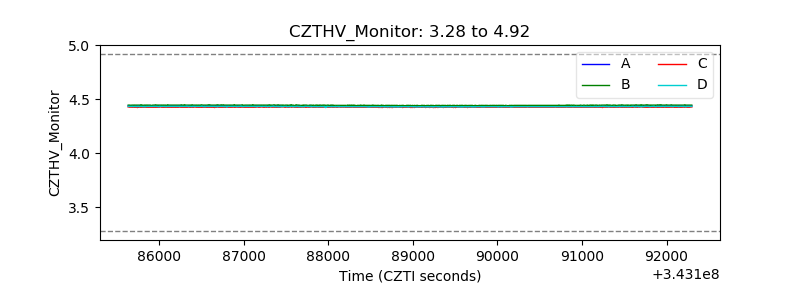 |
| D_VDD | 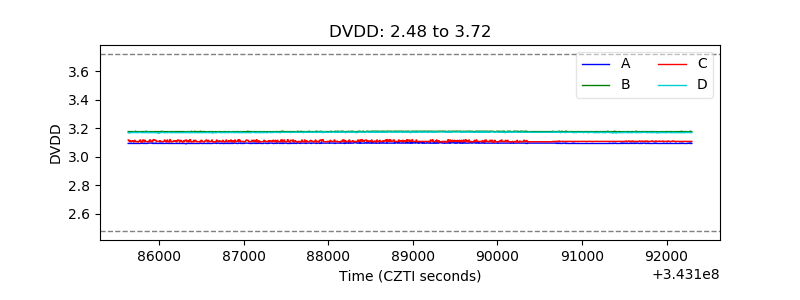 |
| Temperature 1 | 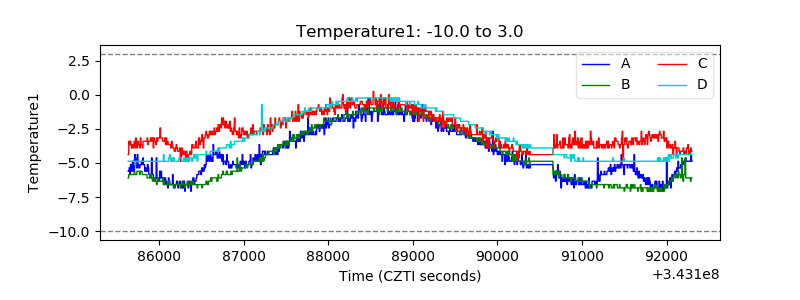 |
| Veto HV Monitor | 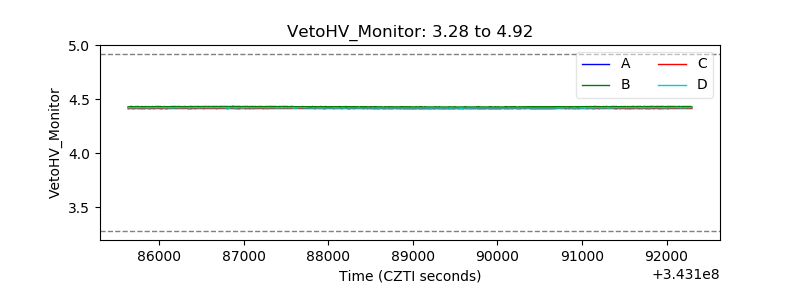 |
| Veto LLD | 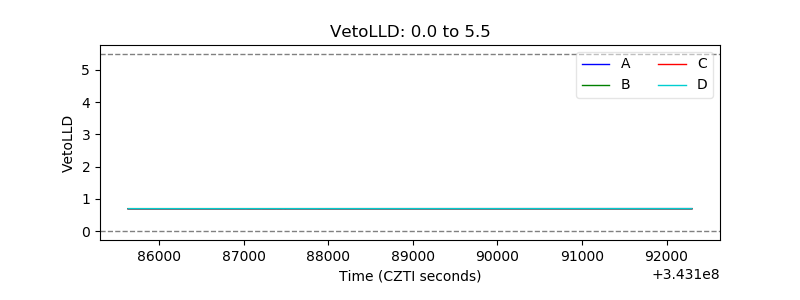 |
| Alpha Counter | 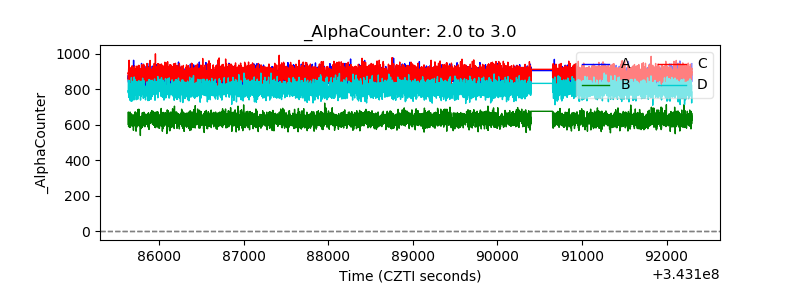 |
| _CPM_Rate |  |
| CZT Counter | 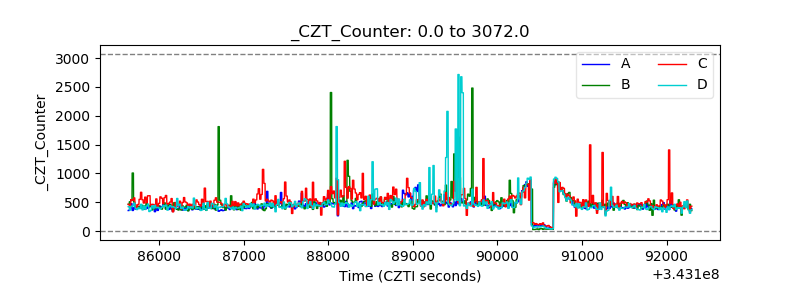 |
| +2.5 Volts monitor |  |
| +5 Volts monitor |  |
| _ROLL_ROT | 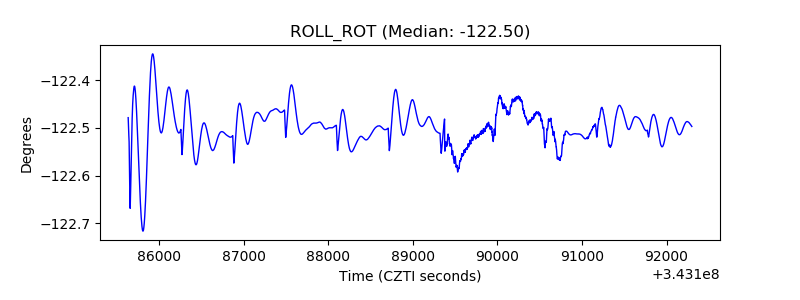 |
| _Roll_DEC | 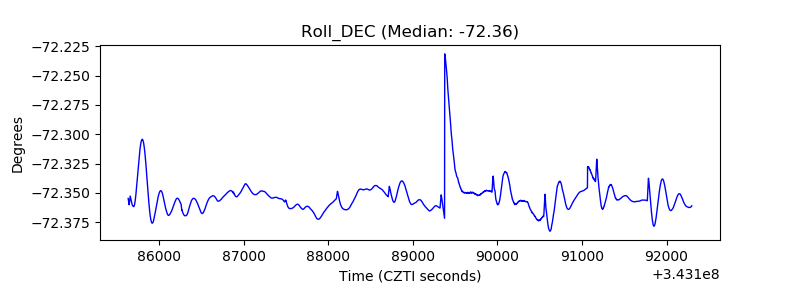 |
| _Roll_RA | 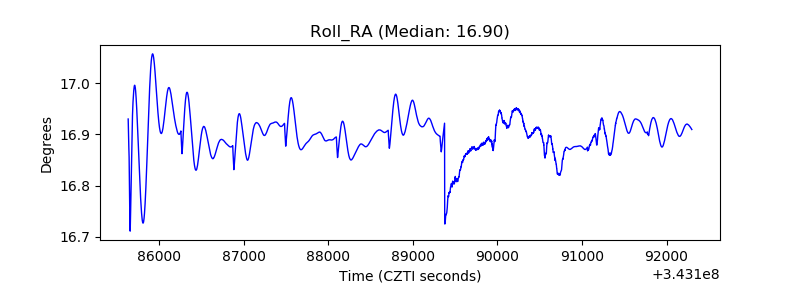 |
| Veto Counter | 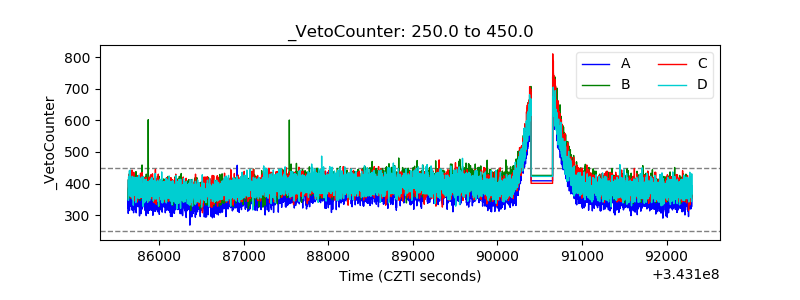 |