| Param | Original file | Final file |
|---|---|---|
| Filename | modeM0/AS1A09_038T34_9000004008_27768cztM0_level2.evt | modeM0/AS1A09_038T34_9000004008_27768cztM0_level2_quad_clean.evt |
| Size (bytes) | 349,960,320 | 95,411,520 |
| Size | 333.7 MB | 91.0 MB |
| Events in quadrant A | 2,279,213 | 645,635 |
| Events in quadrant B | 2,438,295 | 653,358 |
| Events in quadrant C | 2,760,359 | 618,075 |
| Events in quadrant D | 2,768,466 | 610,256 |
| Mode M0 | |||
|---|---|---|---|
| Quadrant | BADHDUFLAG | Total packets | Discarded packets |
| A | 0 | 10348 | 0 |
| B | 0 | 10629 | 0 |
| C | 0 | 11414 | 0 |
| D | 0 | 11983 | 0 |
| Quadrant | Total seconds | Saturated seconds | Saturation percentage |
|---|---|---|---|
| A | 5168 | 2 | 0.038700% |
| B | 5168 | 10 | 0.193498% |
| C | 5168 | 87 | 1.683437% |
| D | 5169 | 29 | 0.561037% |
Noise dominated data is calculated using 1-second bins in cleaned event files. If a bin has >2000 counts, and if more than 50% of those come from <1% of pixels, then it is considered to be noise-dominated and hence unusable.
| Quadrant | # 1 sec bins | Bins with >0 counts | Bins with >2000 counts | High rate bins dominated by noise | Noise dominated (total time) | Noise dominated (detector-on time) | Marked lightcurve |
|---|---|---|---|---|---|---|---|
| A | 5168 | 5168 | 0 | 0 | 0.00% | 0.00% | 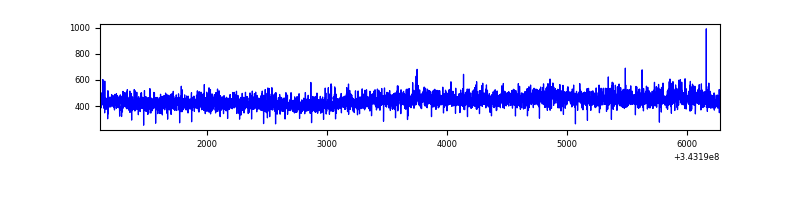 |
| B | 5168 | 5168 | 3 | 3 | 0.06% | 0.06% | 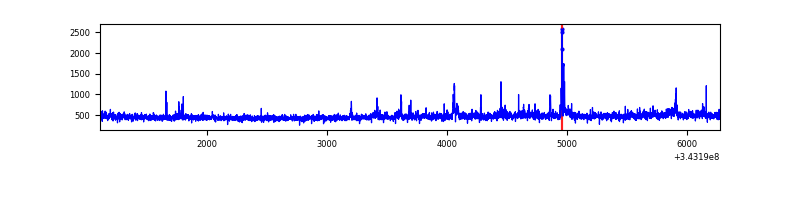 |
| C | 5168 | 5168 | 49 | 49 | 0.95% | 0.95% | 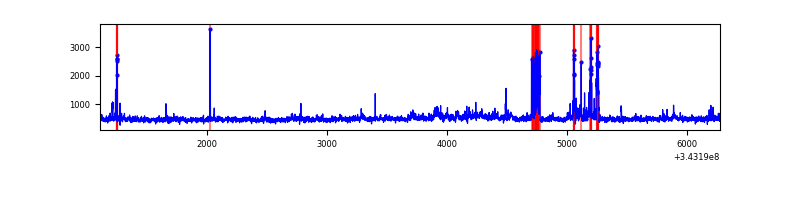 |
| D | 5169 | 5169 | 23 | 23 | 0.44% | 0.44% | 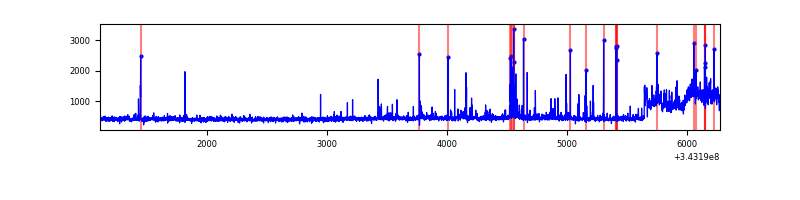 |
Top three noisy pixels from each quadrant. If the there are fewer than three noisy pixels in the level2.evt file, extra rows are filled as -1
| Pixel properties | Quadrant properties | ||||||
|---|---|---|---|---|---|---|---|
| Quadrant | DetID | PixID | Counts | Sigma | Mean | Median | Sigma |
| A | 13 | 254 | 8866 | 68.89 | 590 | 577 | 120.3 |
| A | 3 | 137 | 5490 | 40.83 | 590 | 577 | 120.3 |
| A | 0 | 226 | 5104 | 37.62 | 590 | 577 | 120.3 |
| B | 3 | 64 | 57490 | 510.01 | 588 | 577 | 111.6 |
| B | 0 | 190 | 18936 | 164.52 | 588 | 577 | 111.6 |
| B | 4 | 52 | 16795 | 145.33 | 588 | 577 | 111.6 |
| C | 3 | 233 | 444491 | 3364.31 | 562 | 567 | 132.0 |
| C | 14 | 238 | 92096 | 693.66 | 562 | 567 | 132.0 |
| C | 2 | 16 | 29340 | 218.06 | 562 | 567 | 132.0 |
| D | 1 | 52 | 432608 | 3185.87 | 569 | 552 | 135.6 |
| D | 2 | 250 | 123120 | 903.79 | 569 | 552 | 135.6 |
| D | 2 | 234 | 22471 | 161.63 | 569 | 552 | 135.6 |
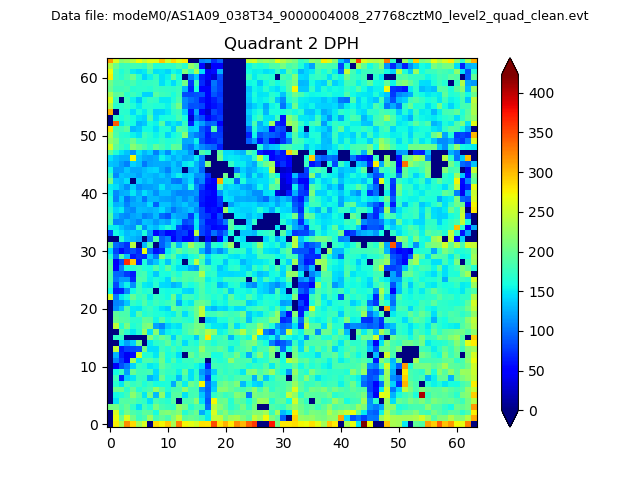
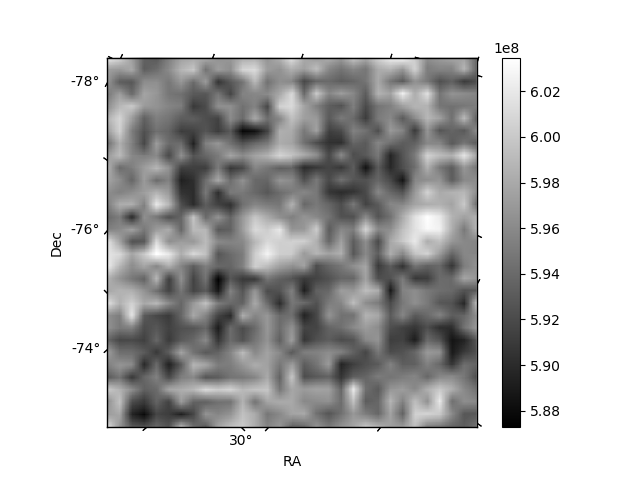
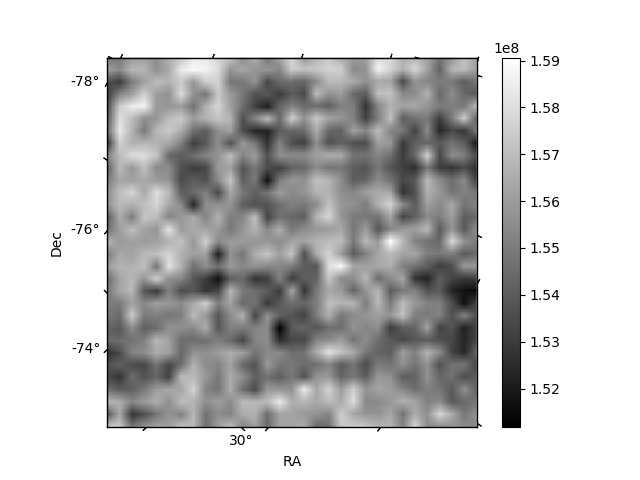
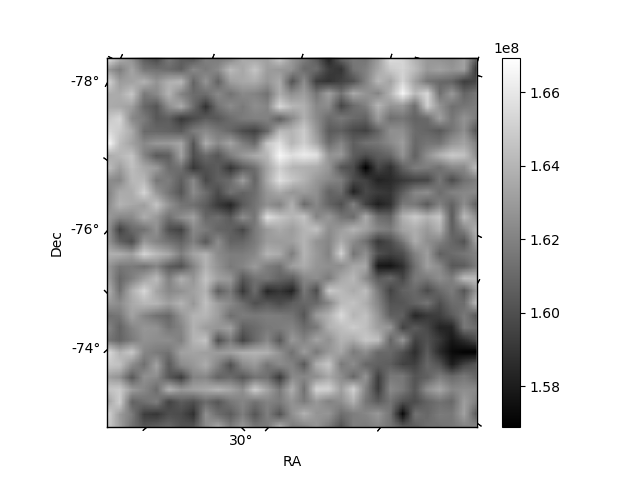
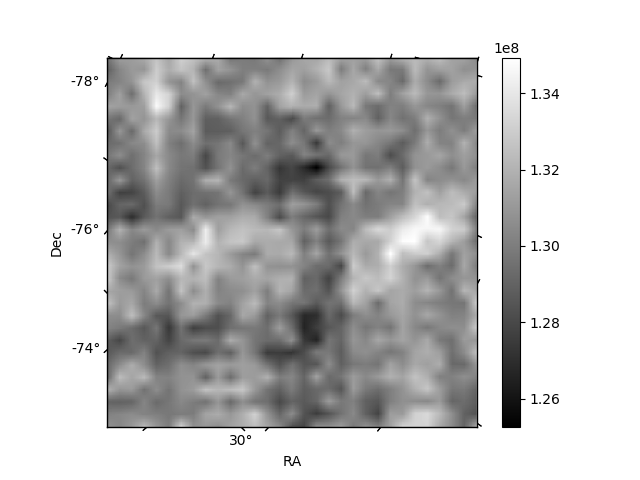
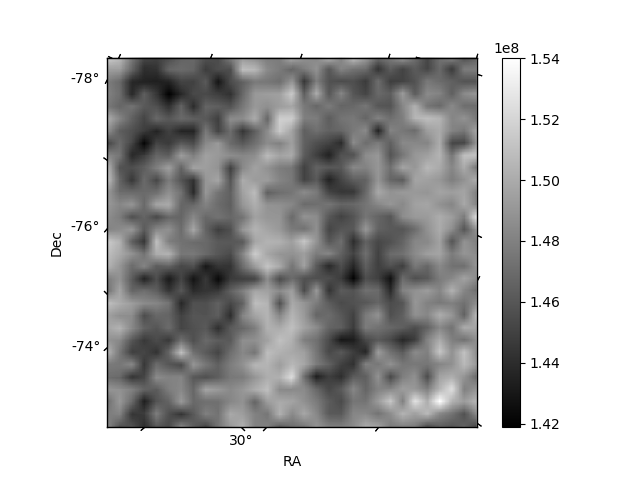
Histogram calculated using DETX and DETY for each event in the final _common_clean file
| Quadrant A | 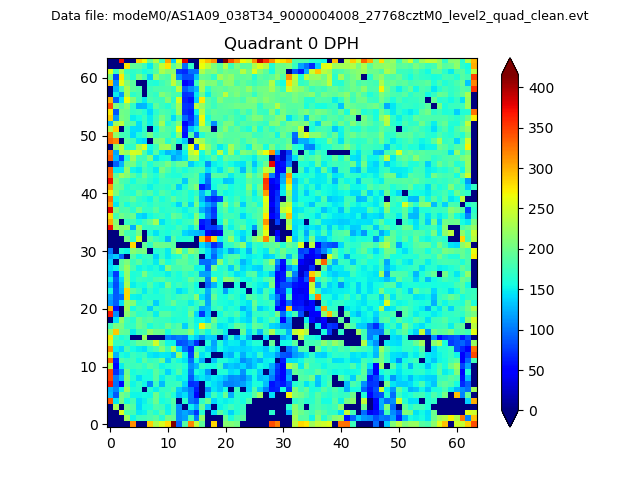 |
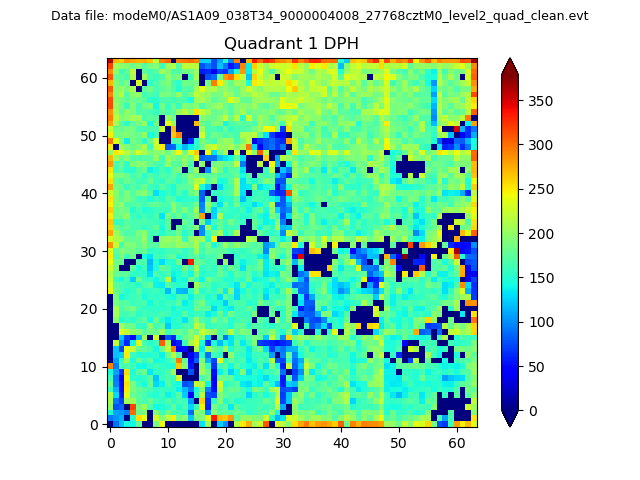 |
Quadrant B |
|---|---|---|---|
| Quadrant D | 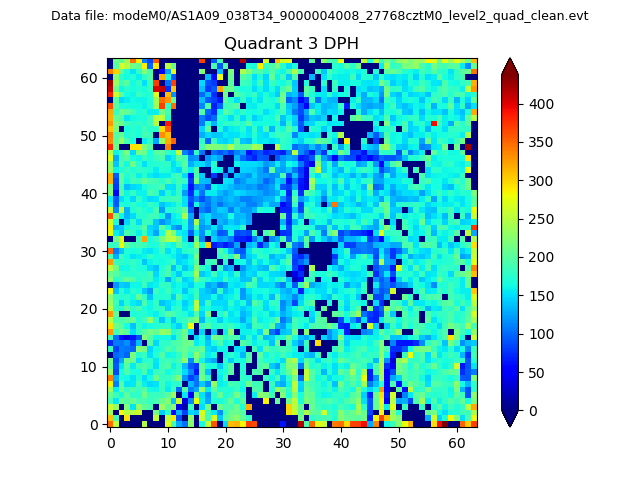 |
 |
Quadrant C |
| Plot type | Count rate plots | Images |
|---|---|---|
| Comparison with Poisson distribution Blue bars denote a histogram of data divided into 1 sec bins. Red curve is a Poisson curve with rate = median count rate of data. |
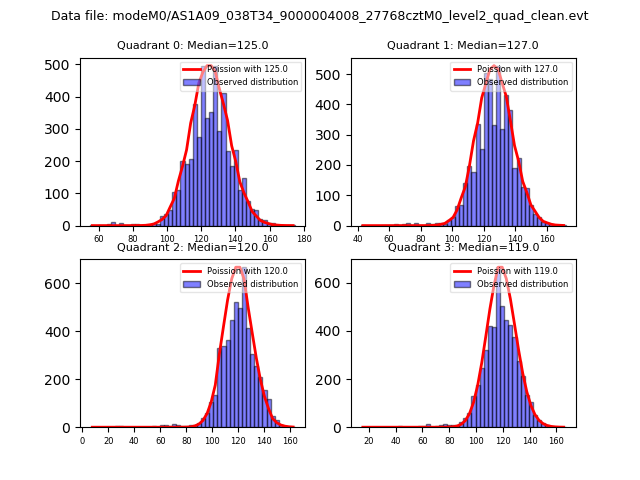 |
 |
| Quadrant-wise count rates Data is divided into 100 sec bins |
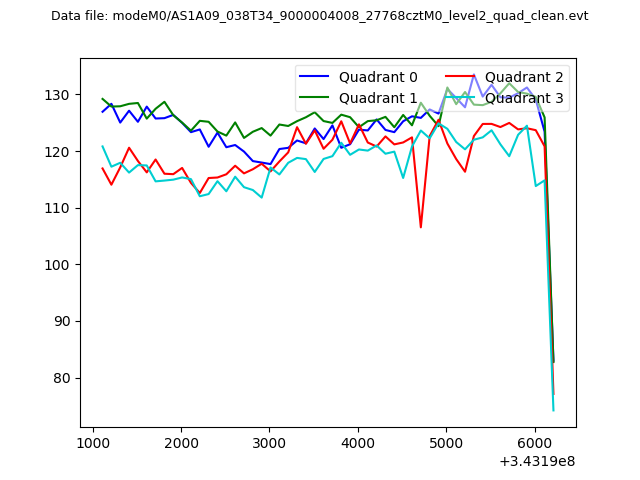 |
|
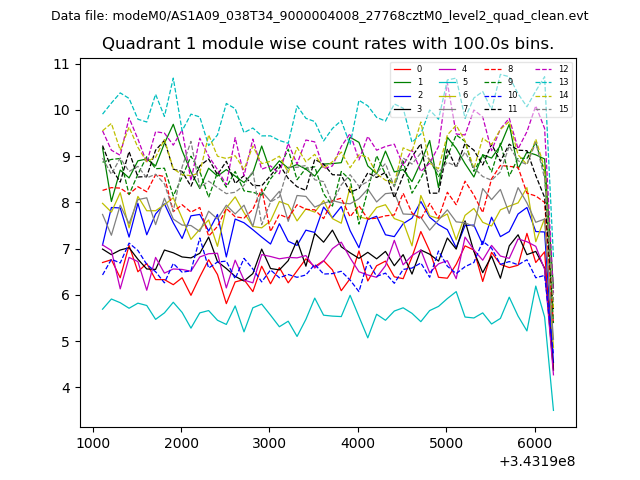
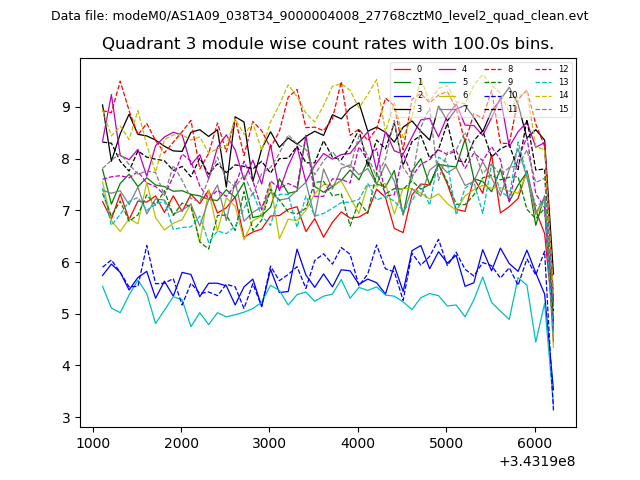
| Module-wise count rates for Quadrant A Data is divided into 100 sec bins |
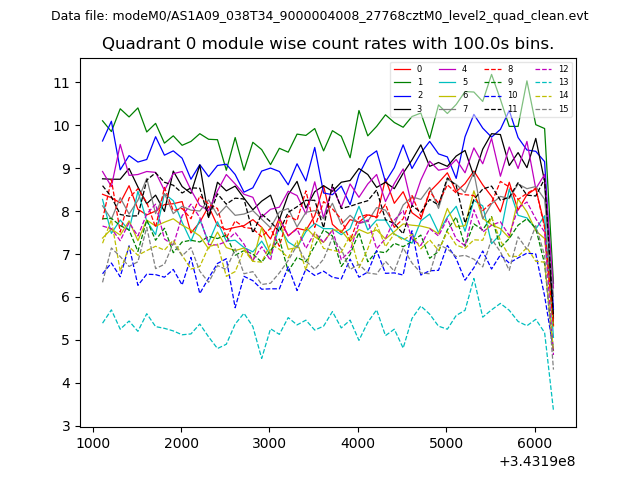 |
 |
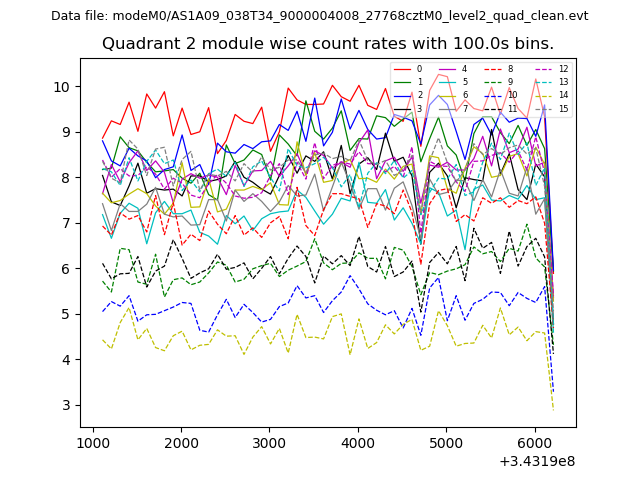
| Module-wise count rates for Quadrant B Data is divided into 100 sec bins |
 |
 |
| Module-wise count rates for Quadrant C Data is divided into 100 sec bins |
 |
 |
| Module-wise count rates for Quadrant D Data is divided into 100 sec bins |
 |
 |
| Parameter | Plot |
|---|---|
| CZT HV Monitor | 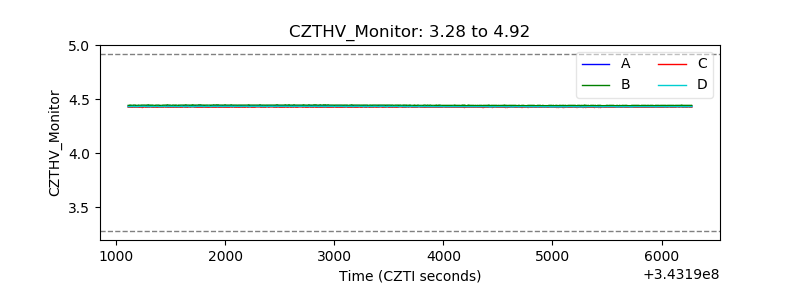 |
| D_VDD | 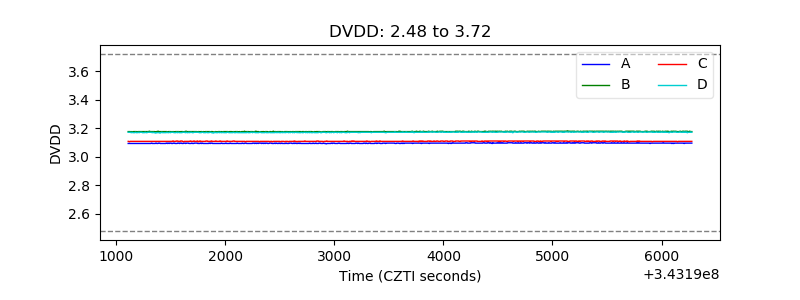 |
| Temperature 1 | 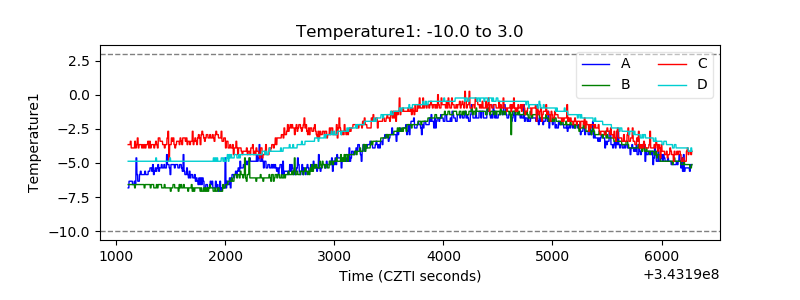 |
| Veto HV Monitor | 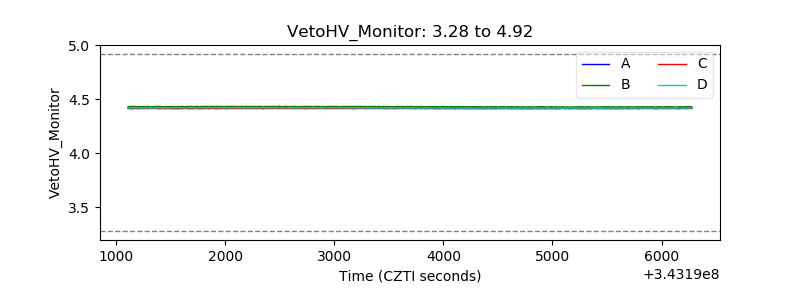 |
| Veto LLD | 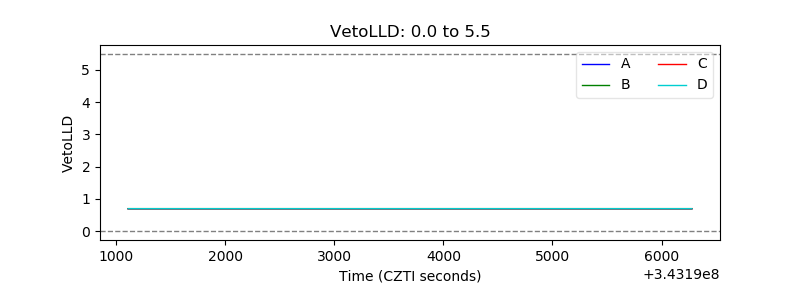 |
| Alpha Counter | 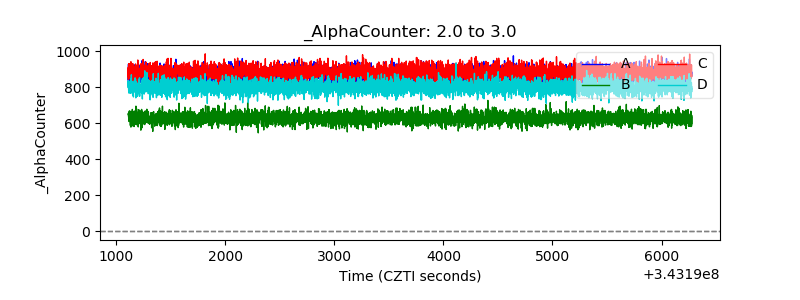 |
| _CPM_Rate | 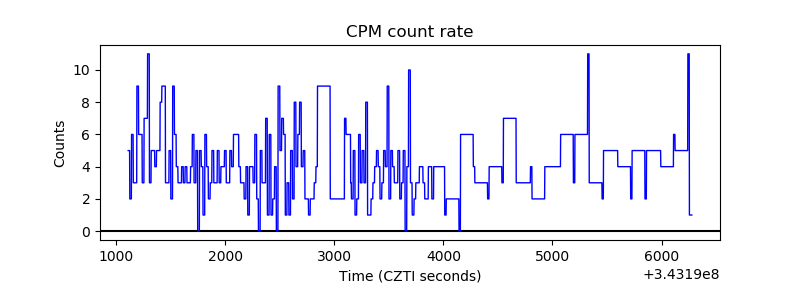 |
| CZT Counter | 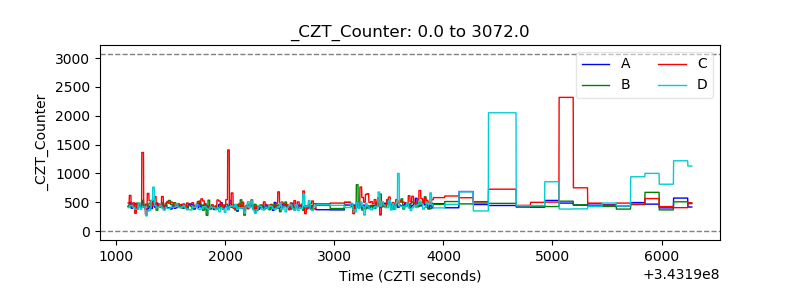 |
| +2.5 Volts monitor |  |
| +5 Volts monitor | 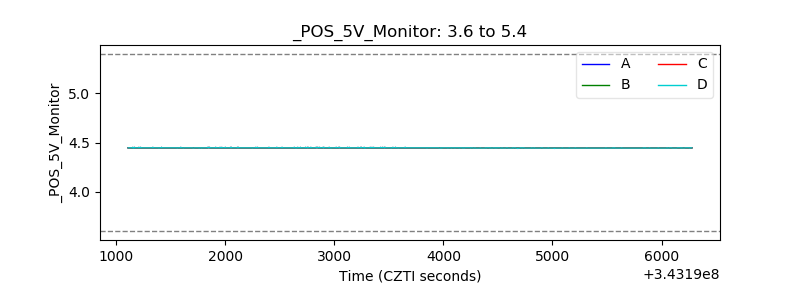 |
| _ROLL_ROT | 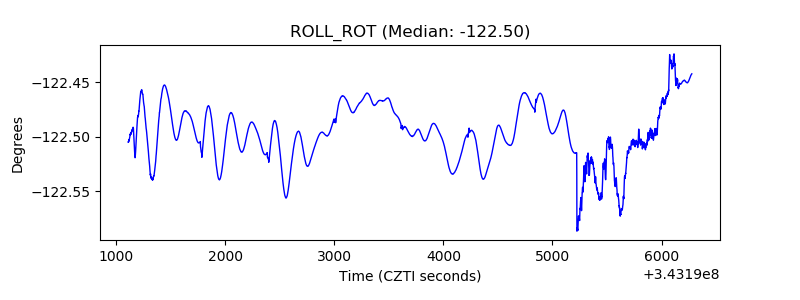 |
| _Roll_DEC | 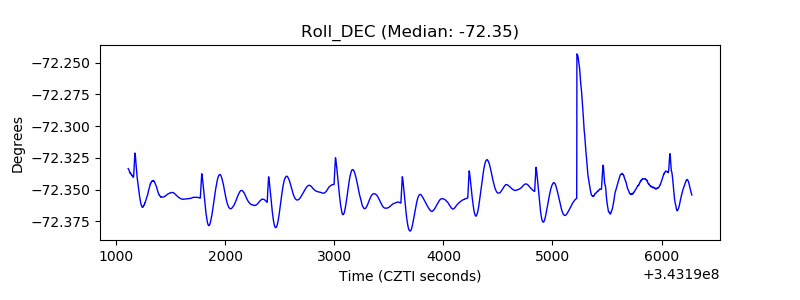 |
| _Roll_RA | 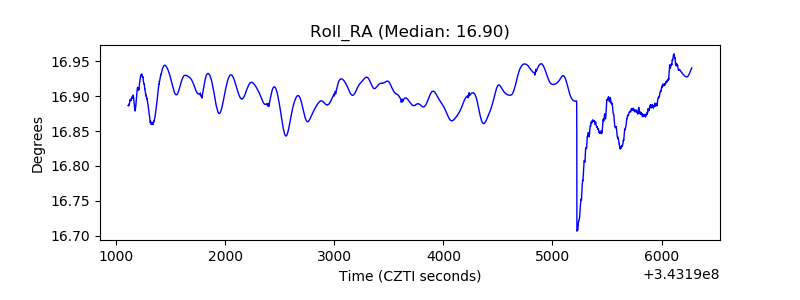 |
| Veto Counter | 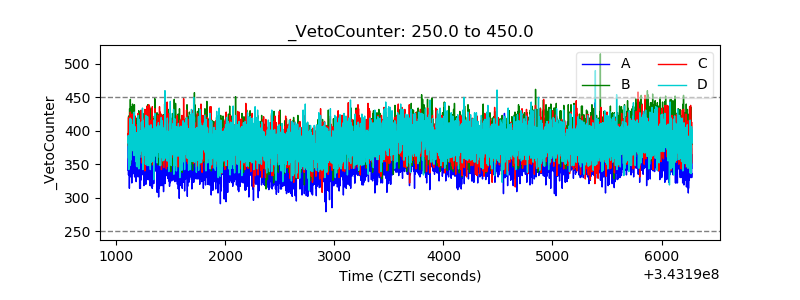 |