| Param | Original file | Final file |
|---|---|---|
| Filename | modeM0/AS1A09_038T40_9000004012cztM0_level2.fits | modeM0/AS1A09_038T40_9000004012cztM0_level2_quad_clean.evt |
| Size (bytes) | 54,345,600 | 62,593,920 |
| Size | 51.8 MB | 59.7 MB |
| Events in quadrant A | 334,156 | 396,867 |
| Events in quadrant B | 319,016 | 395,843 |
| Events in quadrant C | 320,033 | 369,567 |
| Events in quadrant D | 284,004 | 344,158 |
| Mode M9 | |||
|---|---|---|---|
| Quadrant | BADHDUFLAG | Total packets | Discarded packets |
| A | 0 | 8 | 0 |
| B | 0 | 9 | 0 |
| C | 0 | 9 | 0 |
| D | 0 | 8 | 0 |
| Mode SS | |||
|---|---|---|---|
| Quadrant | BADHDUFLAG | Total packets | Discarded packets |
| A | 0 | 118 | 0 |
| B | 0 | 116 | 0 |
| C | 0 | 112 | 0 |
| D | 0 | 112 | 0 |
| Mode M0 | |||
|---|---|---|---|
| Quadrant | BADHDUFLAG | Total packets | Discarded packets |
| A | 0 | 11395 | 0 |
| B | 0 | 12292 | 0 |
| C | 0 | 12226 | 0 |
| D | 0 | 12375 | 0 |
| Quadrant | Total seconds | Saturated seconds | Saturation percentage |
|---|---|---|---|
| A | 5534 | 28 | 0.505963% |
| B | 5575 | 46 | 0.825112% |
| C | 5549 | 69 | 1.243467% |
| D | 5535 | 56 | 1.011743% |
Noise dominated data is calculated using 1-second bins in cleaned event files. If a bin has >2000 counts, and if more than 50% of those come from <1% of pixels, then it is considered to be noise-dominated and hence unusable.
| Quadrant | # 1 sec bins | Bins with >0 counts | Bins with >2000 counts | High rate bins dominated by noise | Noise dominated (total time) | Noise dominated (detector-on time) | Marked lightcurve |
|---|---|---|---|---|---|---|---|
| A | 6776 | 5745 | 0 | 0 | 0.00% | 0.00% | 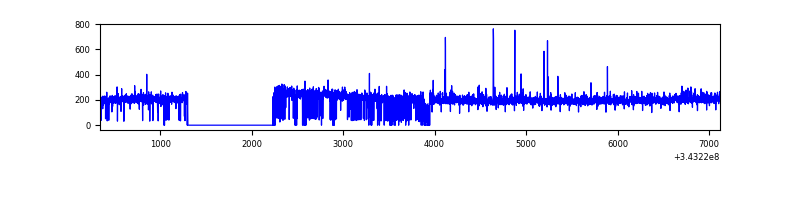 |
| B | 6776 | 5765 | 0 | 0 | 0.00% | 0.00% |  |
| C | 6776 | 5726 | 0 | 0 | 0.00% | 0.00% |  |
| D | 6776 | 5744 | 0 | 0 | 0.00% | 0.00% |  |
Top three noisy pixels from each quadrant. If the there are fewer than three noisy pixels in the level2.evt file, extra rows are filled as -1
| Pixel properties | Quadrant properties | ||||||
|---|---|---|---|---|---|---|---|
| Quadrant | DetID | PixID | Counts | Sigma | Mean | Median | Sigma |
| A | 0 | 29 | 317 | 9.94 | 87 | 82 | 23.6 |
| A | 7 | 110 | 278 | 8.29 | 87 | 82 | 23.6 |
| A | 14 | 79 | 266 | 7.78 | 87 | 82 | 23.6 |
| B | 2 | 9 | 248 | 9.14 | 84 | 81 | 18.3 |
| B | 5 | 232 | 230 | 8.15 | 84 | 81 | 18.3 |
| B | 3 | 17 | 225 | 7.88 | 84 | 81 | 18.3 |
| C | 1 | 80 | 266 | 8.17 | 84 | 78 | 23.0 |
| C | 1 | 81 | 250 | 7.47 | 84 | 78 | 23.0 |
| C | 12 | 241 | 248 | 7.39 | 84 | 78 | 23.0 |
| D | 3 | 14 | 210 | 5.8 | 81 | 74 | 23.4 |
| D | 6 | 62 | 203 | 5.5 | 81 | 74 | 23.4 |
| D | 1 | 31 | 200 | 5.37 | 81 | 74 | 23.4 |
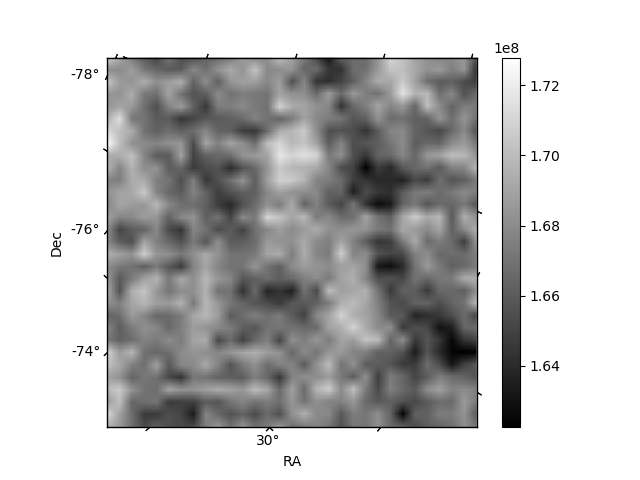
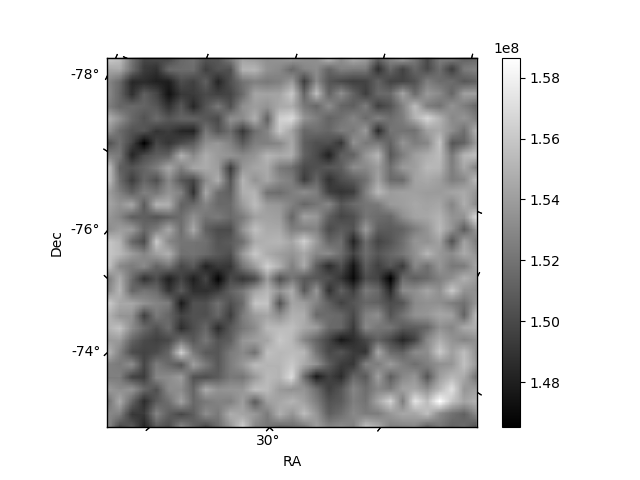
Histogram calculated using DETX and DETY for each event in the final _common_clean file
| Quadrant A | 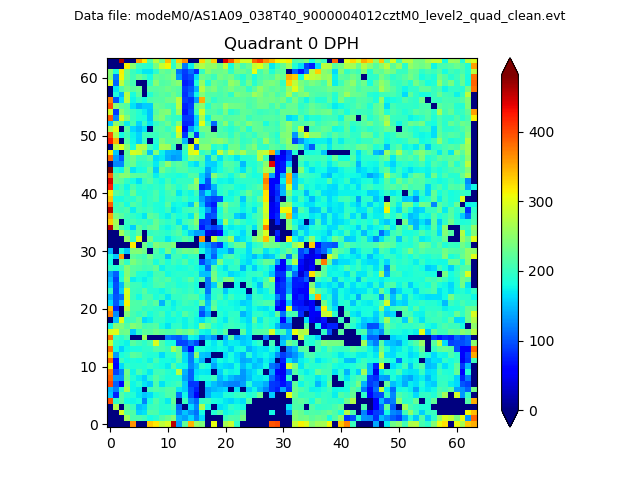 |
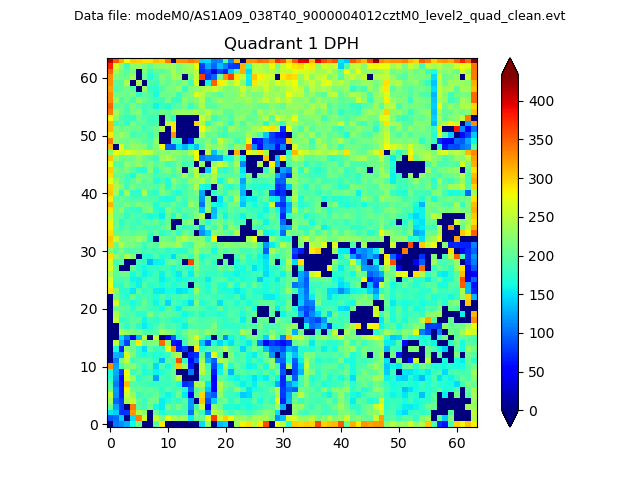 |
Quadrant B |
|---|---|---|---|
| Quadrant D |  |
 |
Quadrant C |
| Plot type | Count rate plots | Images |
|---|---|---|
| Comparison with Poisson distribution Blue bars denote a histogram of data divided into 1 sec bins. Red curve is a Poisson curve with rate = median count rate of data. |
 |
 |
| Quadrant-wise count rates Data is divided into 100 sec bins |
 |
|
| Module-wise count rates for Quadrant A Data is divided into 100 sec bins |
 |
 |
| Module-wise count rates for Quadrant B Data is divided into 100 sec bins |
 |
 |
| Module-wise count rates for Quadrant C Data is divided into 100 sec bins |
 |
 |
| Module-wise count rates for Quadrant D Data is divided into 100 sec bins |
 |
 |
| Parameter | Plot |
|---|---|
| CZT HV Monitor |  |
| D_VDD |  |
| Temperature 1 |  |
| Veto HV Monitor |  |
| Veto LLD |  |
| Alpha Counter |  |
| _CPM_Rate |  |
| CZT Counter | 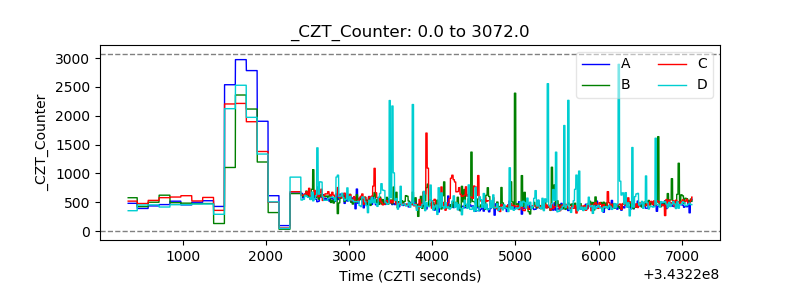 |
| +2.5 Volts monitor |  |
| +5 Volts monitor |  |
| _ROLL_ROT |  |
| _Roll_DEC |  |
| _Roll_RA | 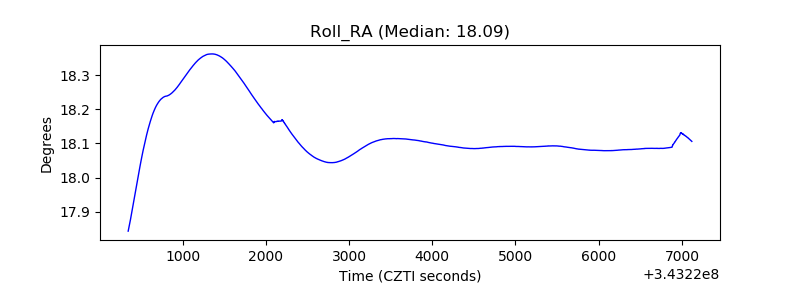 |
| Veto Counter |  |