| Param | Original file | Final file |
|---|---|---|
| Filename | modeM0/AS1A09_038T40_9000004012_27772cztM0_level2.evt | modeM0/AS1A09_038T40_9000004012_27772cztM0_level2_quad_clean.evt |
| Size (bytes) | 176,316,480 | 48,784,320 |
| Size | 168.1 MB | 46.5 MB |
| Events in quadrant A | 1,210,226 | 332,674 |
| Events in quadrant B | 1,310,564 | 338,001 |
| Events in quadrant C | 1,338,000 | 319,021 |
| Events in quadrant D | 1,315,701 | 315,013 |
| Mode M9 | |||
|---|---|---|---|
| Quadrant | BADHDUFLAG | Total packets | Discarded packets |
| A | 0 | 9 | 1 |
| B | 0 | 9 | 0 |
| C | 0 | 9 | 0 |
| D | 0 | 9 | 1 |
| Mode M0 | |||
|---|---|---|---|
| Quadrant | BADHDUFLAG | Total packets | Discarded packets |
| A | 0 | 5024 | 0 |
| B | 0 | 5335 | 0 |
| C | 0 | 5501 | 0 |
| D | 0 | 5368 | 0 |
| Quadrant | Total seconds | Saturated seconds | Saturation percentage |
|---|---|---|---|
| A | 2364 | 26 | 1.099831% |
| B | 2368 | 33 | 1.393581% |
| C | 2376 | 57 | 2.398990% |
| D | 2365 | 27 | 1.141649% |
Noise dominated data is calculated using 1-second bins in cleaned event files. If a bin has >2000 counts, and if more than 50% of those come from <1% of pixels, then it is considered to be noise-dominated and hence unusable.
| Quadrant | # 1 sec bins | Bins with >0 counts | Bins with >2000 counts | High rate bins dominated by noise | Noise dominated (total time) | Noise dominated (detector-on time) | Marked lightcurve |
|---|---|---|---|---|---|---|---|
| A | 3606 | 2577 | 0 | 0 | 0.00% | 0.00% | 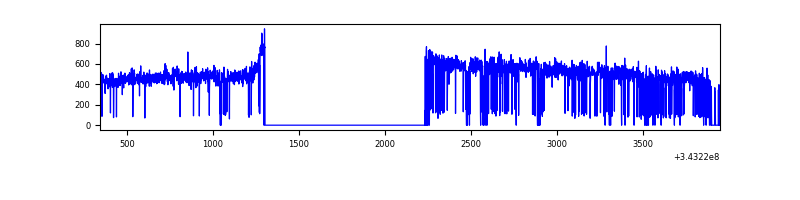 |
| B | 3569 | 2561 | 0 | 0 | 0.00% | 0.00% | 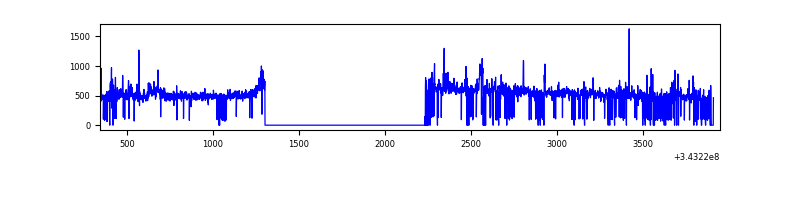 |
| C | 3603 | 2554 | 0 | 0 | 0.00% | 0.00% | 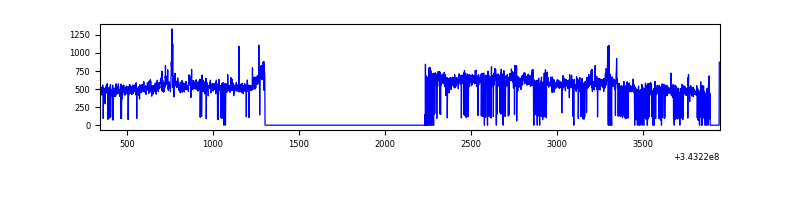 |
| D | 3606 | 2575 | 10 | 10 | 0.28% | 0.39% | 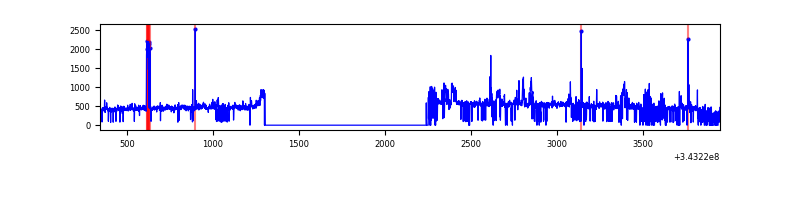 |
Top three noisy pixels from each quadrant. If the there are fewer than three noisy pixels in the level2.evt file, extra rows are filled as -1
| Pixel properties | Quadrant properties | ||||||
|---|---|---|---|---|---|---|---|
| Quadrant | DetID | PixID | Counts | Sigma | Mean | Median | Sigma |
| A | 13 | 254 | 4301 | 62.43 | 313 | 306 | 64.0 |
| A | 3 | 137 | 2791 | 38.83 | 313 | 306 | 64.0 |
| A | 0 | 226 | 2662 | 36.82 | 313 | 306 | 64.0 |
| B | 3 | 64 | 70005 | 1132.43 | 310 | 301 | 61.6 |
| B | 0 | 190 | 12584 | 199.55 | 310 | 301 | 61.6 |
| B | 12 | 111 | 7246 | 112.83 | 310 | 301 | 61.6 |
| C | 3 | 233 | 103720 | 1442.97 | 301 | 302 | 71.7 |
| C | 14 | 238 | 49171 | 681.86 | 301 | 302 | 71.7 |
| C | 6 | 112 | 6738 | 89.8 | 301 | 302 | 71.7 |
| D | 1 | 52 | 119569 | 1603.87 | 306 | 297 | 74.4 |
| D | 2 | 250 | 18578 | 245.83 | 306 | 297 | 74.4 |
| D | 2 | 234 | 9951 | 129.82 | 306 | 297 | 74.4 |
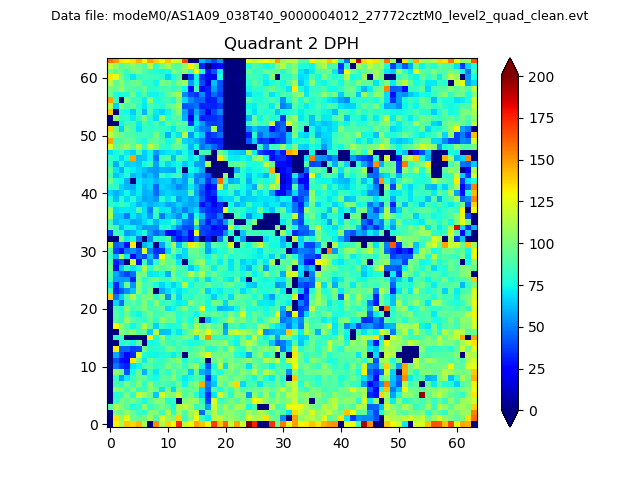
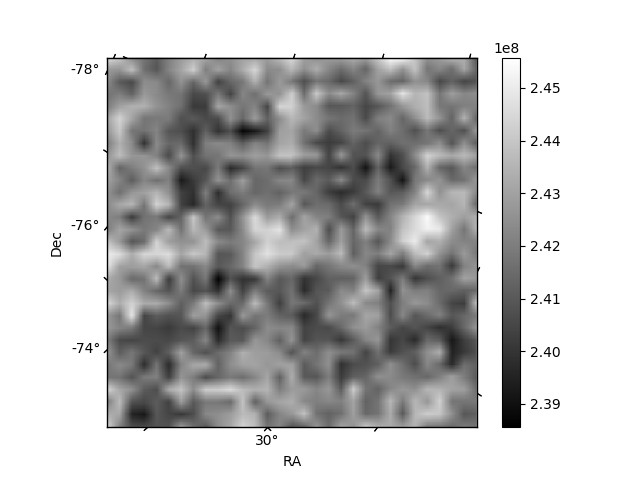
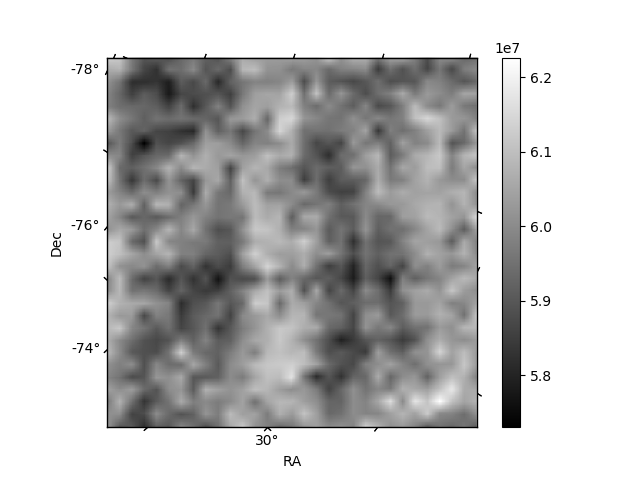
Histogram calculated using DETX and DETY for each event in the final _common_clean file
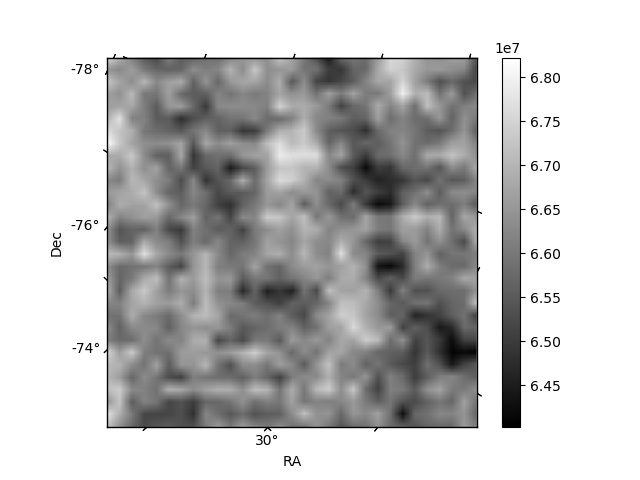
| Quadrant A | 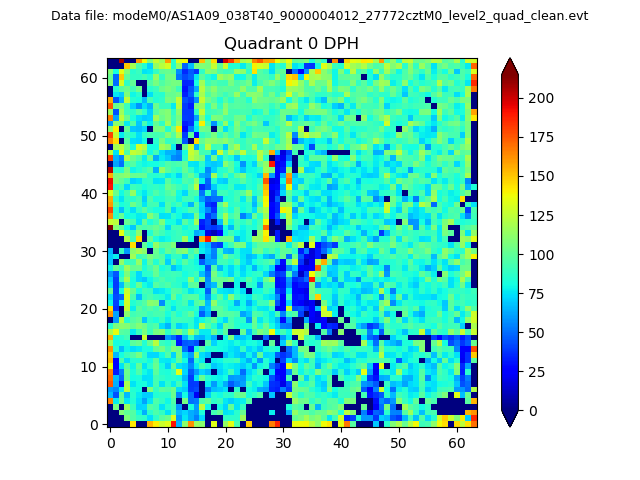 |
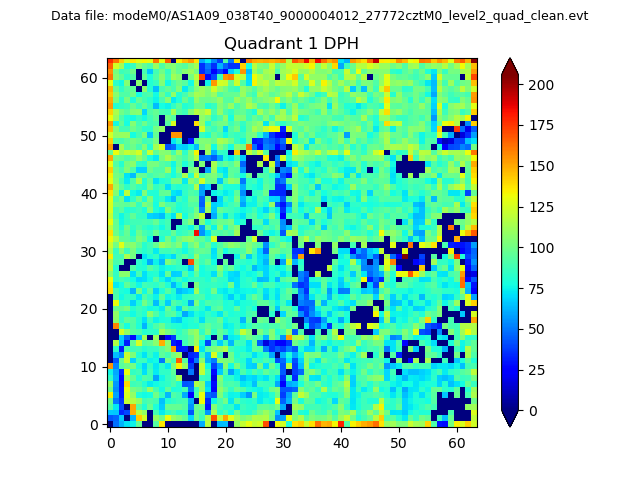 |
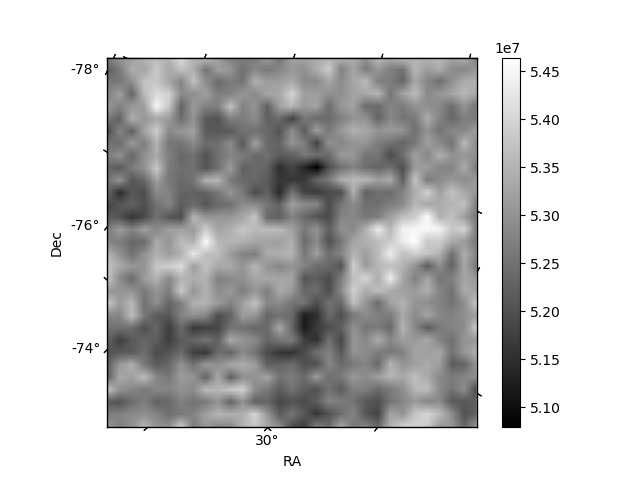
Quadrant B |
|---|---|---|---|
| Quadrant D | 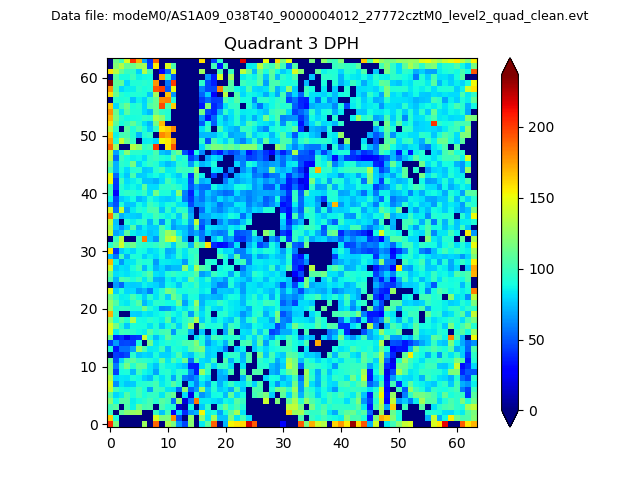 |
 |
Quadrant C |
| Plot type | Count rate plots | Images |
|---|---|---|
| Comparison with Poisson distribution Blue bars denote a histogram of data divided into 1 sec bins. Red curve is a Poisson curve with rate = median count rate of data. |
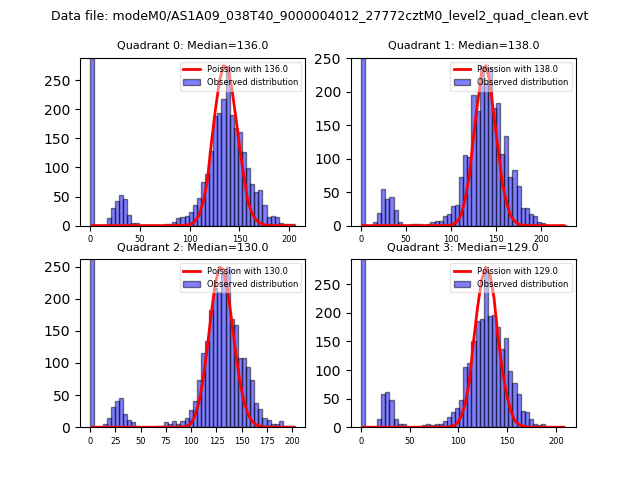 |
 |
| Quadrant-wise count rates Data is divided into 100 sec bins |
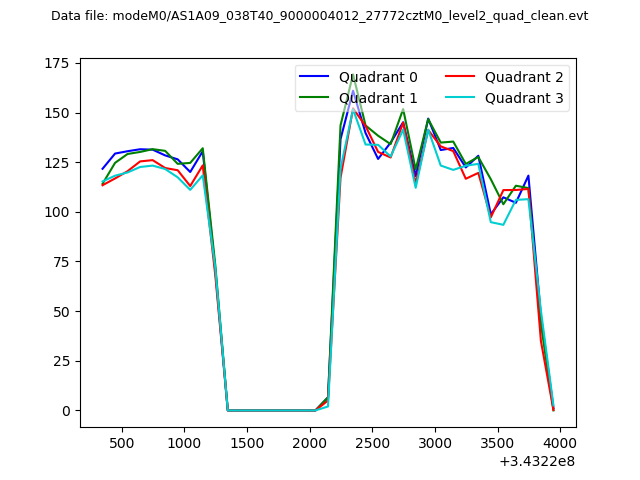 |
|
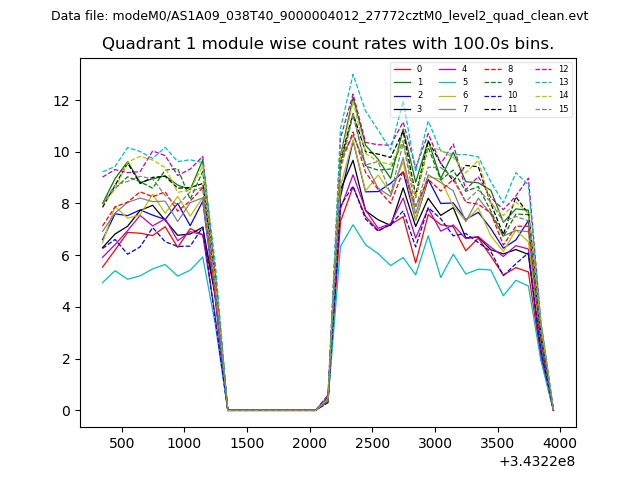
| Module-wise count rates for Quadrant A Data is divided into 100 sec bins |
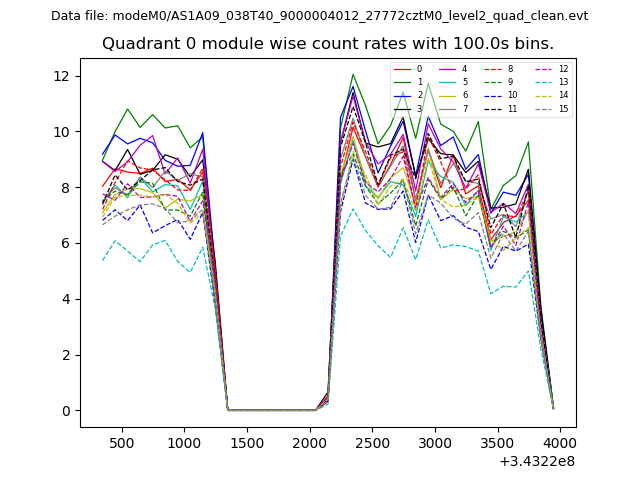 |
 |
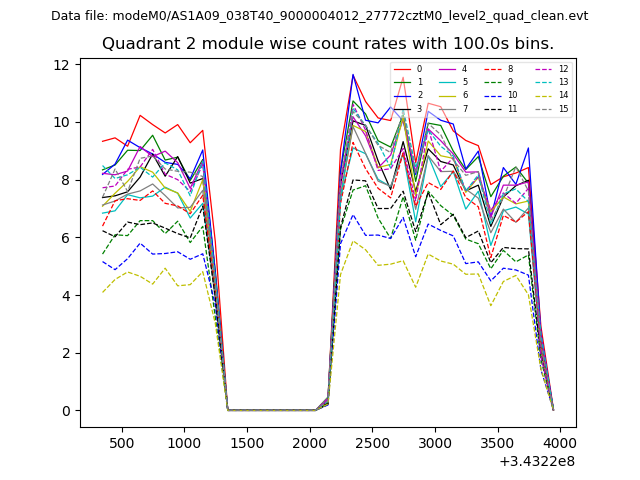
| Module-wise count rates for Quadrant B Data is divided into 100 sec bins |
 |
 |
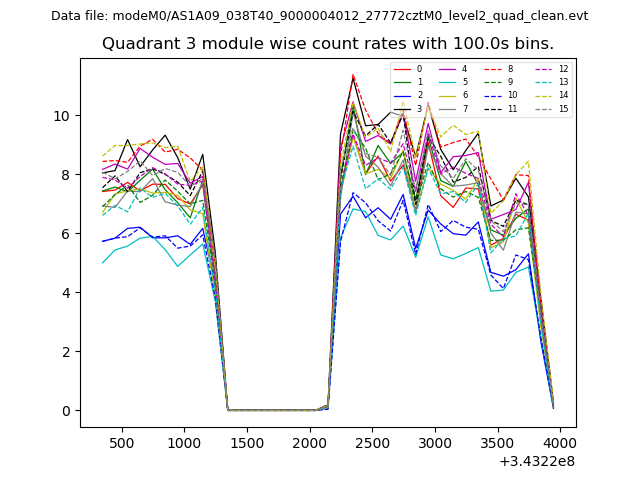
| Module-wise count rates for Quadrant C Data is divided into 100 sec bins |
 |
 |
| Module-wise count rates for Quadrant D Data is divided into 100 sec bins |
 |
 |
| Parameter | Plot |
|---|---|
| CZT HV Monitor | 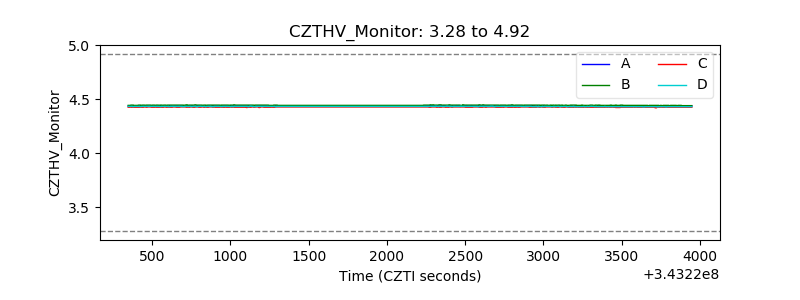 |
| D_VDD | 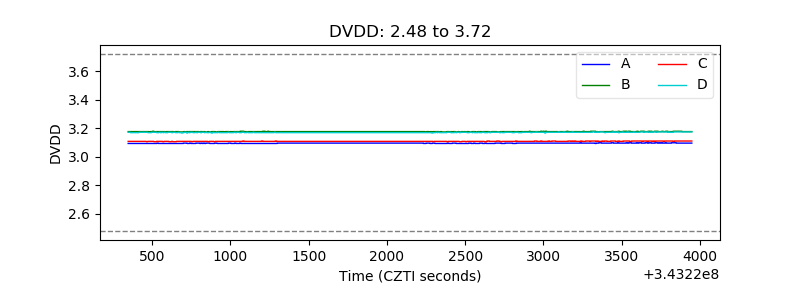 |
| Temperature 1 | 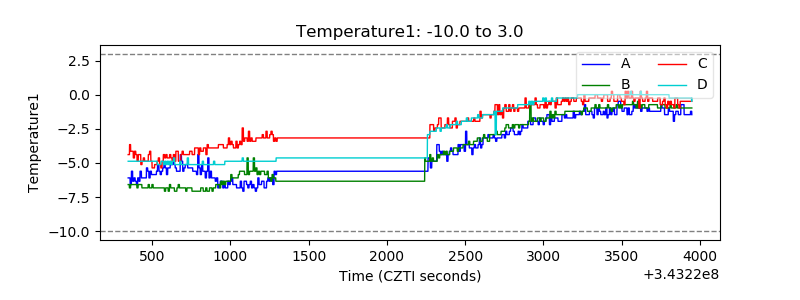 |
| Veto HV Monitor | 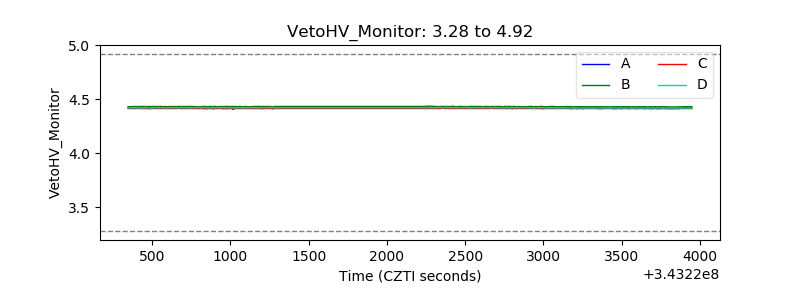 |
| Veto LLD | 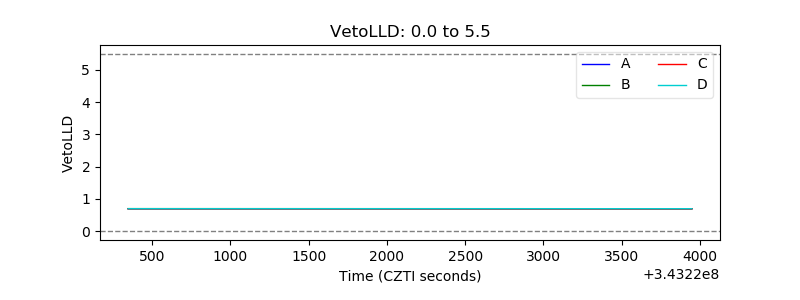 |
| Alpha Counter | 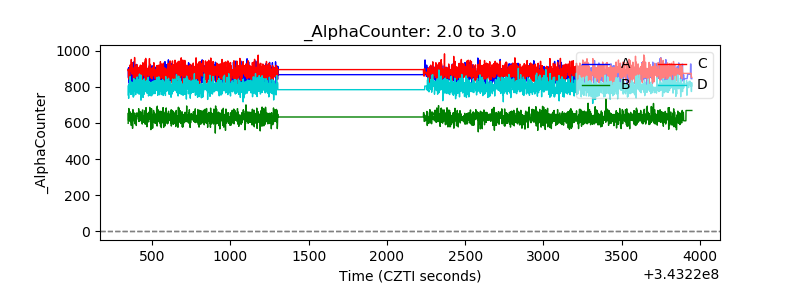 |
| _CPM_Rate | 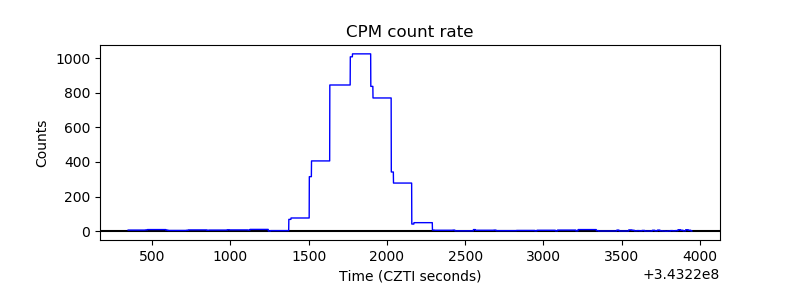 |
| CZT Counter | 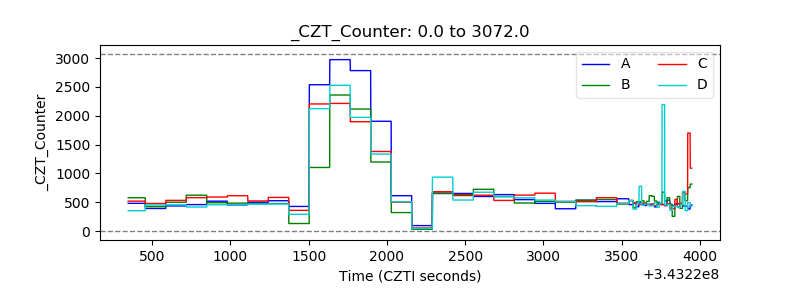 |
| +2.5 Volts monitor |  |
| +5 Volts monitor |  |
| _ROLL_ROT | 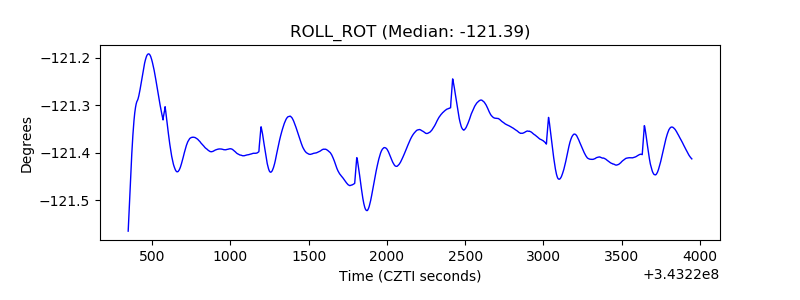 |
| _Roll_DEC | 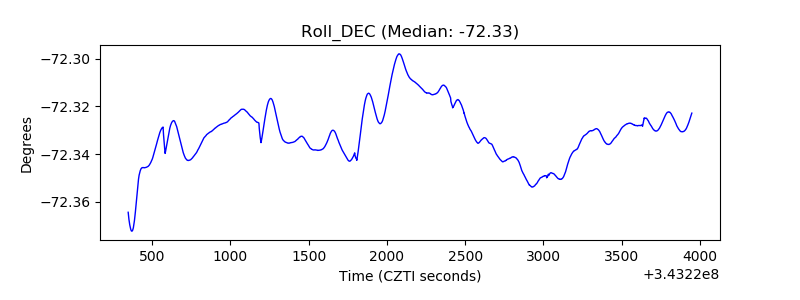 |
| _Roll_RA | 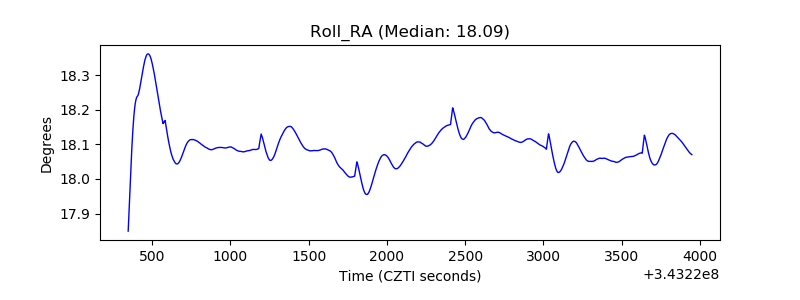 |
| Veto Counter | 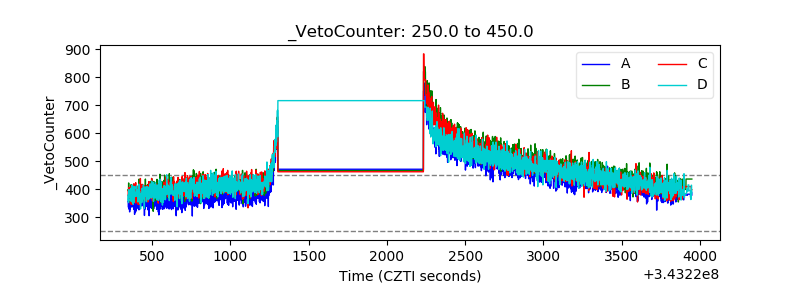 |