| Param | Original file | Final file |
|---|---|---|
| Filename | modeM0/AS1A09_038T40_9000004012_27774cztM0_level2.evt | modeM0/AS1A09_038T40_9000004012_27774cztM0_level2_quad_clean.evt |
| Size (bytes) | 274,302,720 | 77,751,360 |
| Size | 261.6 MB | 74.1 MB |
| Events in quadrant A | 1,812,367 | 532,739 |
| Events in quadrant B | 2,075,812 | 531,206 |
| Events in quadrant C | 2,062,888 | 504,071 |
| Events in quadrant D | 2,077,402 | 498,996 |
| Mode M0 | |||
|---|---|---|---|
| Quadrant | BADHDUFLAG | Total packets | Discarded packets |
| A | 0 | 8208 | 0 |
| B | 0 | 8828 | 0 |
| C | 0 | 8821 | 0 |
| D | 0 | 9047 | 0 |
| Quadrant | Total seconds | Saturated seconds | Saturation percentage |
|---|---|---|---|
| A | 4078 | 2 | 0.049044% |
| B | 4079 | 15 | 0.367737% |
| C | 4079 | 26 | 0.637411% |
| D | 4079 | 39 | 0.956117% |
Noise dominated data is calculated using 1-second bins in cleaned event files. If a bin has >2000 counts, and if more than 50% of those come from <1% of pixels, then it is considered to be noise-dominated and hence unusable.
| Quadrant | # 1 sec bins | Bins with >0 counts | Bins with >2000 counts | High rate bins dominated by noise | Noise dominated (total time) | Noise dominated (detector-on time) | Marked lightcurve |
|---|---|---|---|---|---|---|---|
| A | 4078 | 4078 | 1 | 1 | 0.02% | 0.02% | 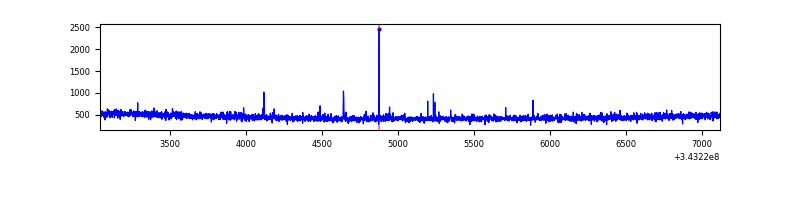 |
| B | 4079 | 4079 | 9 | 9 | 0.22% | 0.22% | 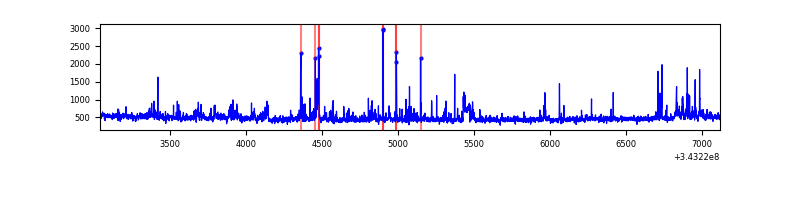 |
| C | 4079 | 4079 | 6 | 6 | 0.15% | 0.15% | 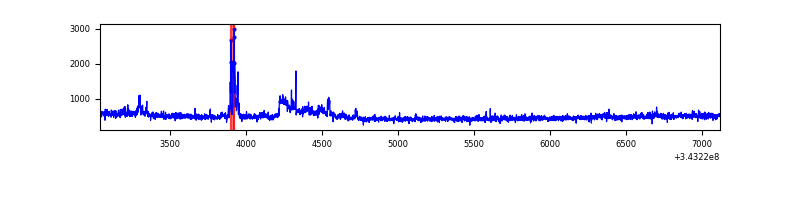 |
| D | 4079 | 4079 | 35 | 35 | 0.86% | 0.86% | 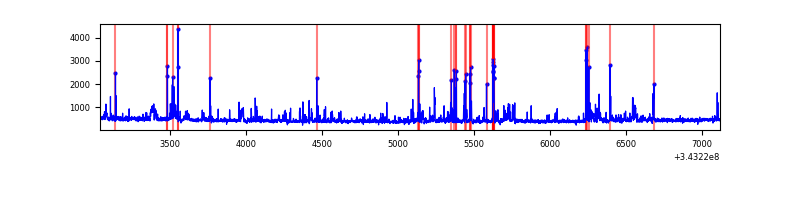 |
Top three noisy pixels from each quadrant. If the there are fewer than three noisy pixels in the level2.evt file, extra rows are filled as -1
| Pixel properties | Quadrant properties | ||||||
|---|---|---|---|---|---|---|---|
| Quadrant | DetID | PixID | Counts | Sigma | Mean | Median | Sigma |
| A | 13 | 248 | 9911 | 99.1 | 467 | 457 | 95.4 |
| A | 13 | 254 | 7535 | 74.19 | 467 | 457 | 95.4 |
| A | 3 | 137 | 4236 | 39.61 | 467 | 457 | 95.4 |
| B | 3 | 64 | 142511 | 1601.07 | 464 | 454 | 88.7 |
| B | 0 | 190 | 51000 | 569.68 | 464 | 454 | 88.7 |
| B | 0 | 230 | 17962 | 197.33 | 464 | 454 | 88.7 |
| C | 3 | 233 | 275726 | 2648.86 | 439 | 441 | 103.9 |
| C | 14 | 238 | 71341 | 682.22 | 439 | 441 | 103.9 |
| C | 15 | 208 | 4717 | 41.14 | 439 | 441 | 103.9 |
| D | 1 | 52 | 238914 | 2225.94 | 443 | 431 | 107.1 |
| D | 2 | 250 | 102399 | 951.74 | 443 | 431 | 107.1 |
| D | 2 | 234 | 18717 | 170.68 | 443 | 431 | 107.1 |
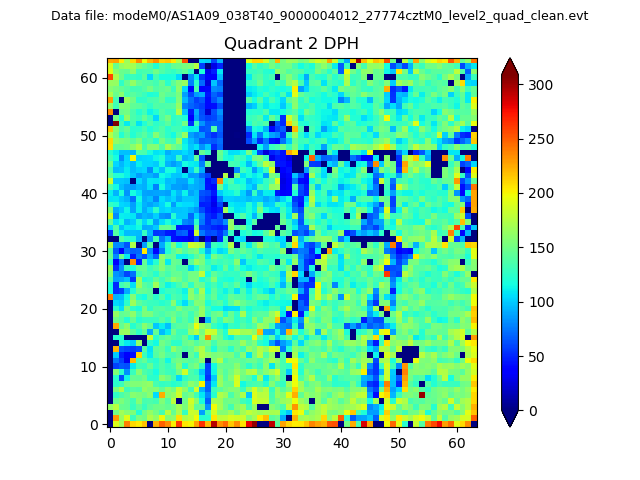
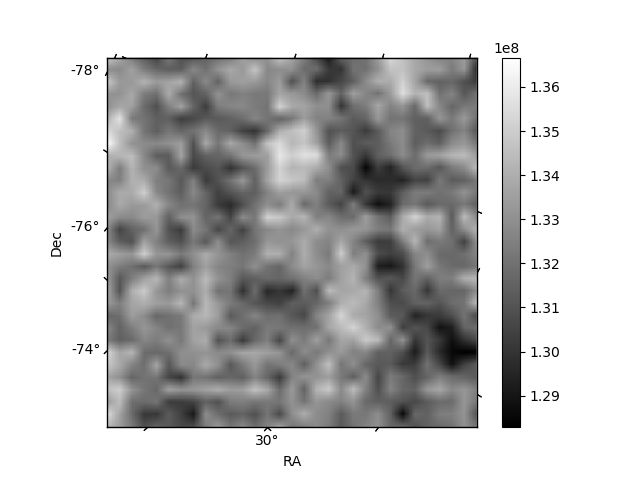
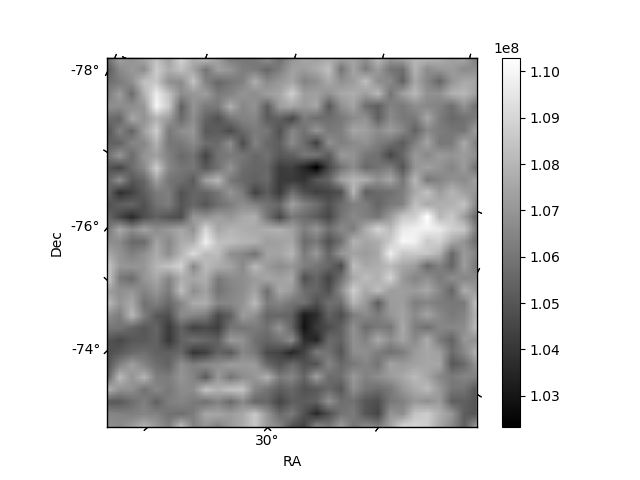
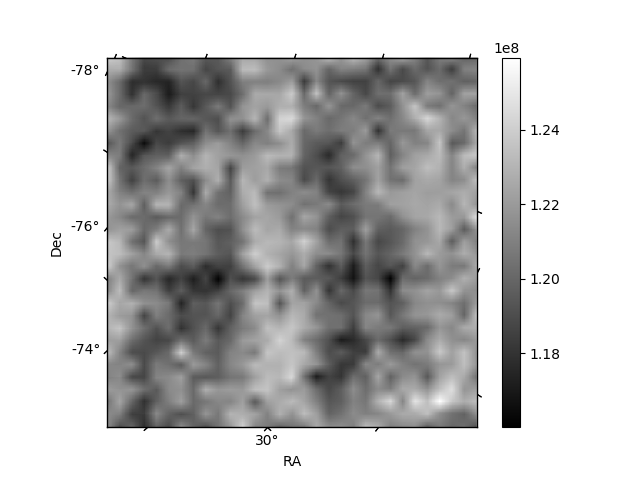
Histogram calculated using DETX and DETY for each event in the final _common_clean file
| Quadrant A | 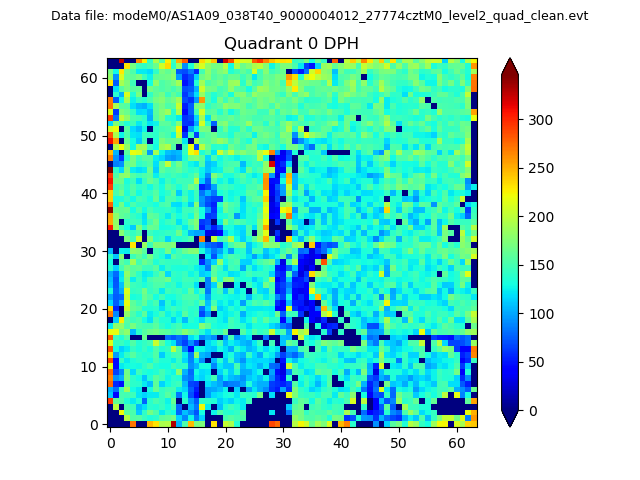 |
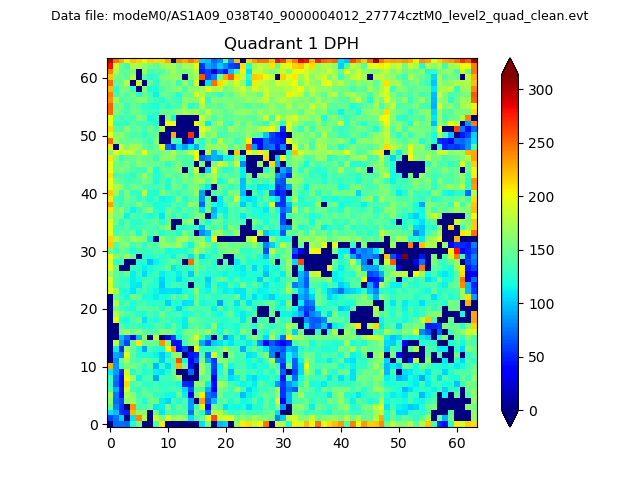 |
Quadrant B |
|---|---|---|---|
| Quadrant D | 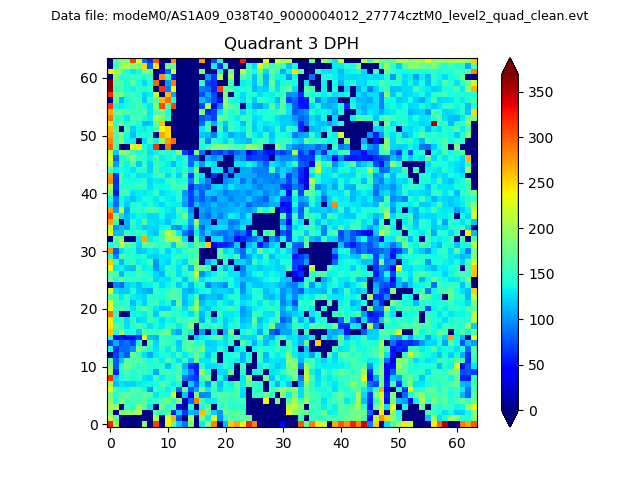 |
 |
Quadrant C |
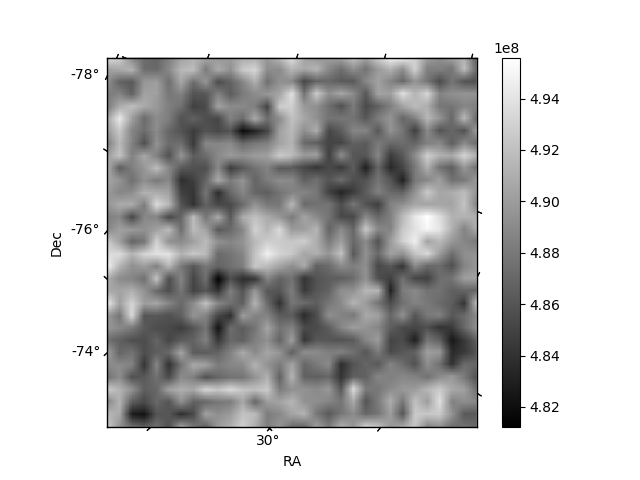
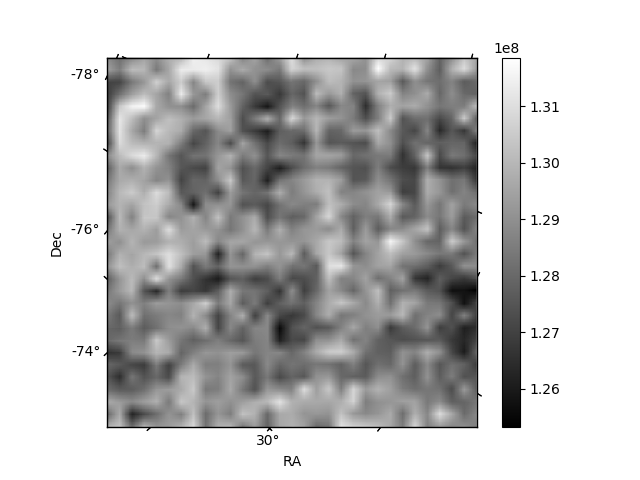
| Plot type | Count rate plots | Images |
|---|---|---|
| Comparison with Poisson distribution Blue bars denote a histogram of data divided into 1 sec bins. Red curve is a Poisson curve with rate = median count rate of data. |
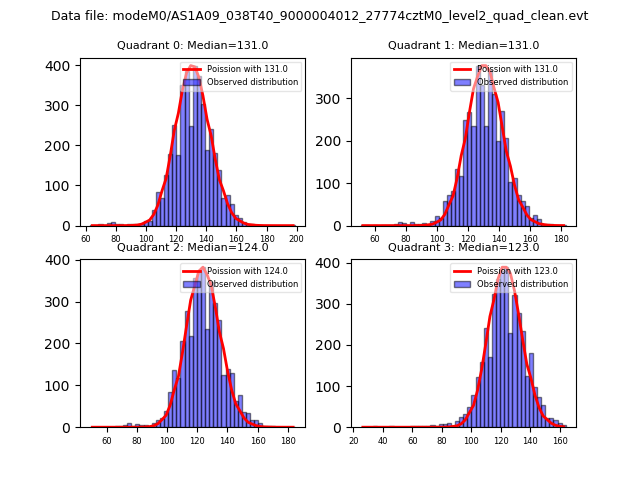 |
 |
| Quadrant-wise count rates Data is divided into 100 sec bins |
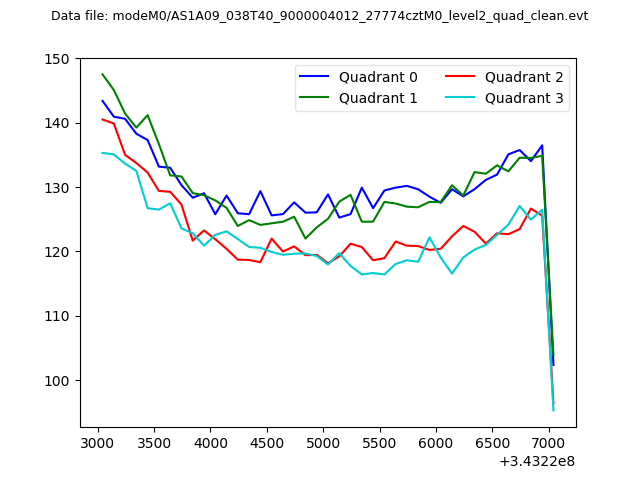 |
|
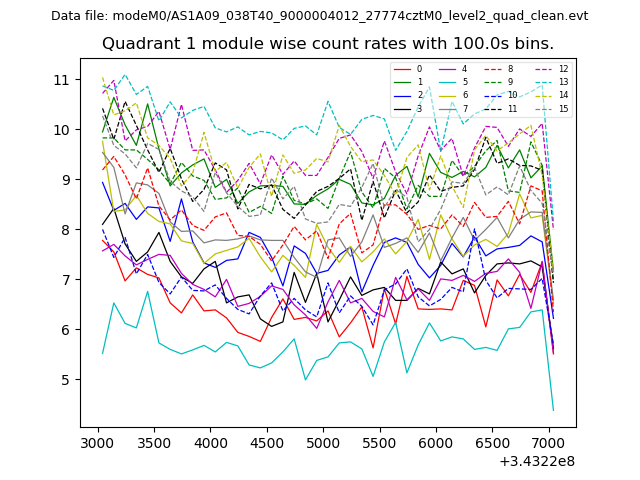
| Module-wise count rates for Quadrant A Data is divided into 100 sec bins |
 |
 |
| Module-wise count rates for Quadrant B Data is divided into 100 sec bins |
 |
 |
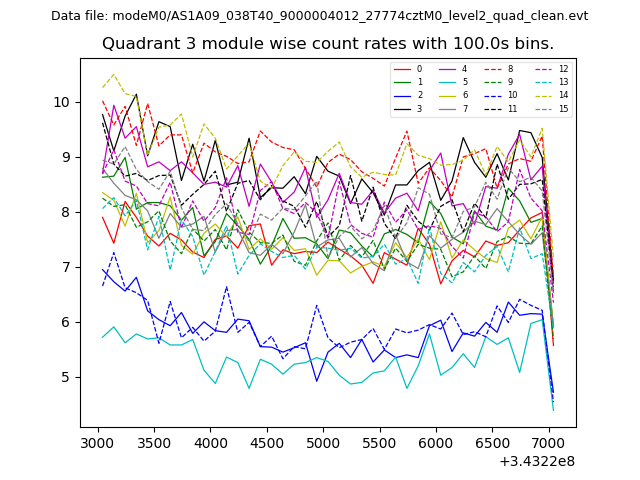
| Module-wise count rates for Quadrant C Data is divided into 100 sec bins |
 |
 |
| Module-wise count rates for Quadrant D Data is divided into 100 sec bins |
 |
 |
| Parameter | Plot |
|---|---|
| CZT HV Monitor |  |
| D_VDD | 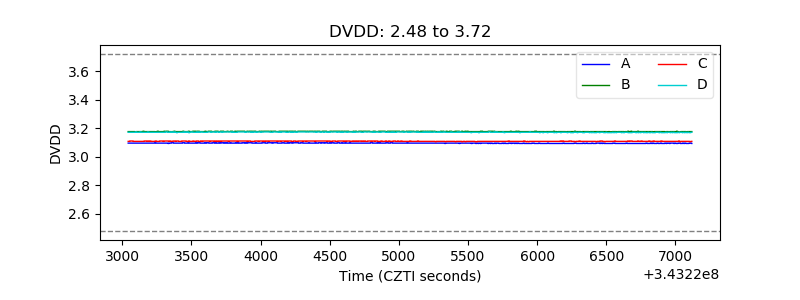 |
| Temperature 1 | 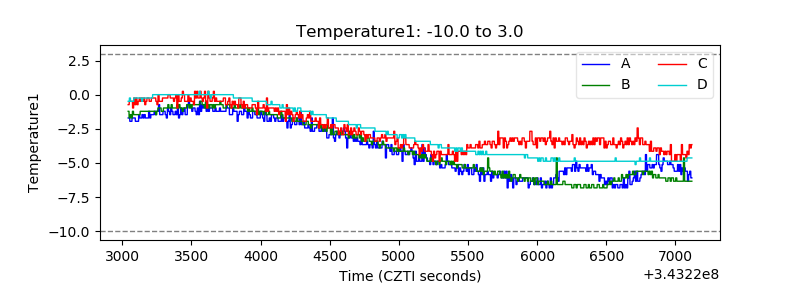 |
| Veto HV Monitor |  |
| Veto LLD | 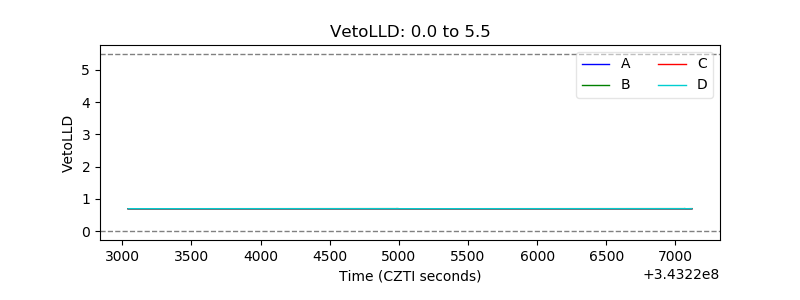 |
| Alpha Counter | 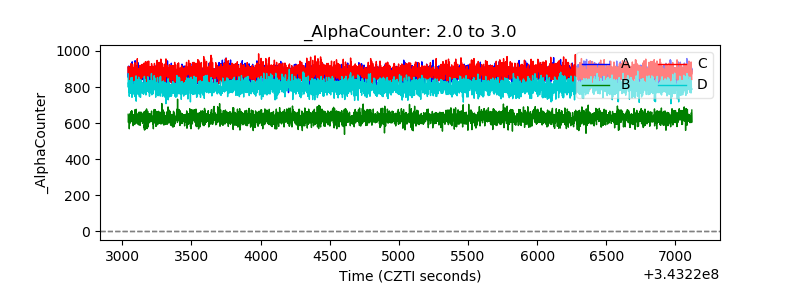 |
| _CPM_Rate | 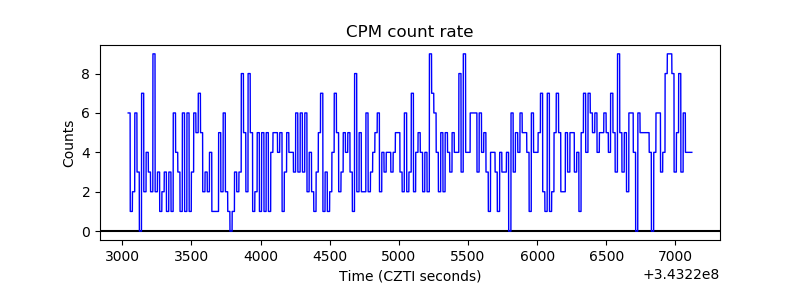 |
| CZT Counter | 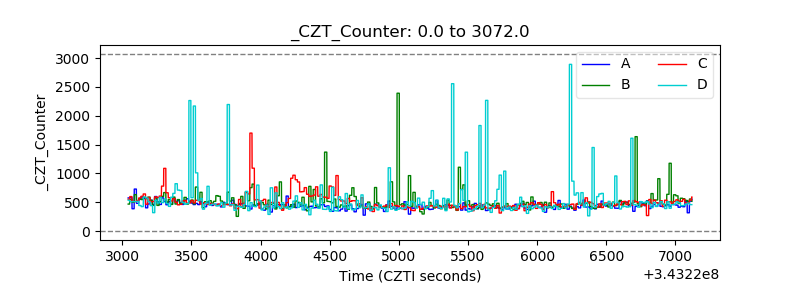 |
| +2.5 Volts monitor |  |
| +5 Volts monitor |  |
| _ROLL_ROT | 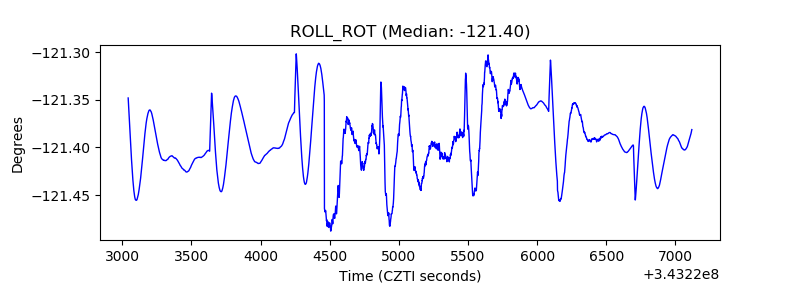 |
| _Roll_DEC | 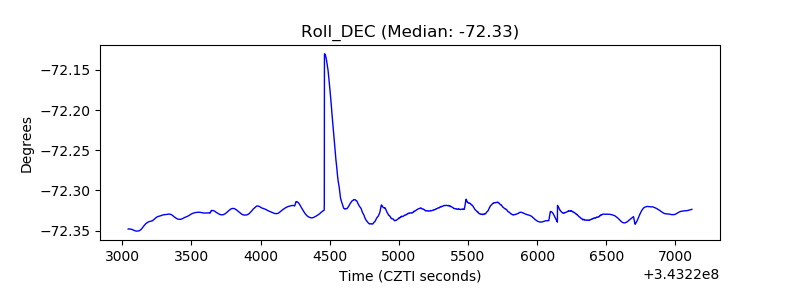 |
| _Roll_RA | 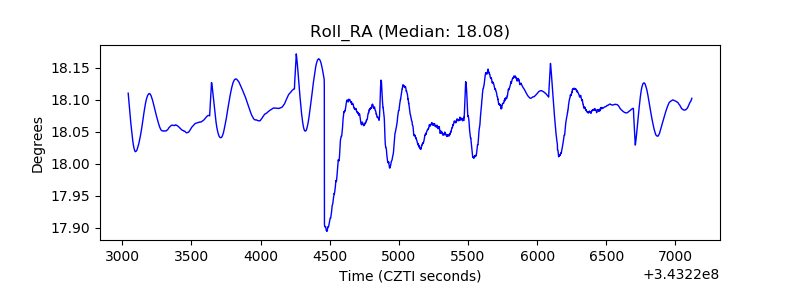 |
| Veto Counter | 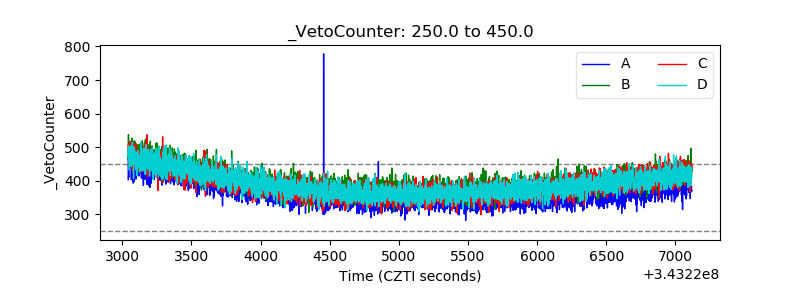 |