| Param | Original file | Final file |
|---|---|---|
| Filename | modeM0/AS1A10_009T02_9000004014cztM0_level2.fits | modeM0/AS1A10_009T02_9000004014cztM0_level2_quad_clean.evt |
| Size (bytes) | 233,046,720 | 149,500,800 |
| Size | 222.3 MB | 142.6 MB |
| Events in quadrant A | 1,507,232 | 830,871 |
| Events in quadrant B | 1,417,114 | 813,854 |
| Events in quadrant C | 1,422,398 | 746,331 |
| Events in quadrant D | 1,198,402 | 622,502 |
| Mode M9 | |||
|---|---|---|---|
| Quadrant | BADHDUFLAG | Total packets | Discarded packets |
| A | 0 | 60 | 0 |
| B | 0 | 60 | 0 |
| C | 0 | 60 | 0 |
| D | 0 | 60 | 0 |
| Mode SS | |||
|---|---|---|---|
| Quadrant | BADHDUFLAG | Total packets | Discarded packets |
| A | 0 | 446 | 0 |
| B | 0 | 446 | 0 |
| C | 0 | 446 | 0 |
| D | 0 | 446 | 0 |
| Mode M0 | |||
|---|---|---|---|
| Quadrant | BADHDUFLAG | Total packets | Discarded packets |
| A | 0 | 47119 | 0 |
| B | 0 | 56883 | 0 |
| C | 0 | 52277 | 0 |
| D | 0 | 62079 | 0 |
| Quadrant | Total seconds | Saturated seconds | Saturation percentage |
|---|---|---|---|
| A | 21972 | 258 | 1.174222% |
| B | 21972 | 1001 | 4.555798% |
| C | 21972 | 560 | 2.548698% |
| D | 21972 | 1700 | 7.737120% |
Noise dominated data is calculated using 1-second bins in cleaned event files. If a bin has >2000 counts, and if more than 50% of those come from <1% of pixels, then it is considered to be noise-dominated and hence unusable.
| Quadrant | # 1 sec bins | Bins with >0 counts | Bins with >2000 counts | High rate bins dominated by noise | Noise dominated (total time) | Noise dominated (detector-on time) | Marked lightcurve |
|---|---|---|---|---|---|---|---|
| A | 27026 | 21967 | 0 | 0 | 0.00% | 0.00% | 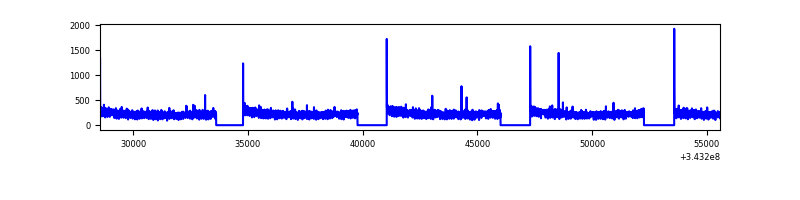 |
| B | 27026 | 21961 | 0 | 0 | 0.00% | 0.00% |  |
| C | 27026 | 21967 | 0 | 0 | 0.00% | 0.00% | 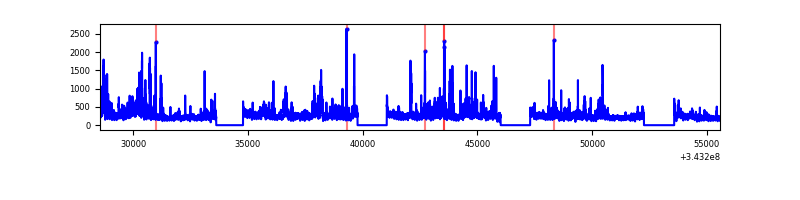 |
| D | 27026 | 21815 | 0 | 0 | 0.00% | 0.00% |  |
Top three noisy pixels from each quadrant. If the there are fewer than three noisy pixels in the level2.evt file, extra rows are filled as -1
| Pixel properties | Quadrant properties | ||||||
|---|---|---|---|---|---|---|---|
| Quadrant | DetID | PixID | Counts | Sigma | Mean | Median | Sigma |
| A | 0 | 29 | 1446 | 11.1 | 393 | 373 | 96.6 |
| A | 7 | 110 | 1138 | 7.92 | 393 | 373 | 96.6 |
| A | 0 | 30 | 1134 | 7.87 | 393 | 373 | 96.6 |
| B | 2 | 9 | 1117 | 10.06 | 375 | 360 | 75.2 |
| B | 5 | 128 | 947 | 7.8 | 375 | 360 | 75.2 |
| B | 2 | 8 | 943 | 7.74 | 375 | 360 | 75.2 |
| C | 1 | 81 | 1081 | 7.52 | 375 | 353 | 96.8 |
| C | 3 | 202 | 1081 | 7.52 | 375 | 353 | 96.8 |
| C | 1 | 80 | 1052 | 7.22 | 375 | 353 | 96.8 |
| D | 6 | 231 | 880 | 6.11 | 342 | 313 | 92.8 |
| D | 3 | 14 | 873 | 6.03 | 342 | 313 | 92.8 |
| D | 10 | 189 | 857 | 5.86 | 342 | 313 | 92.8 |
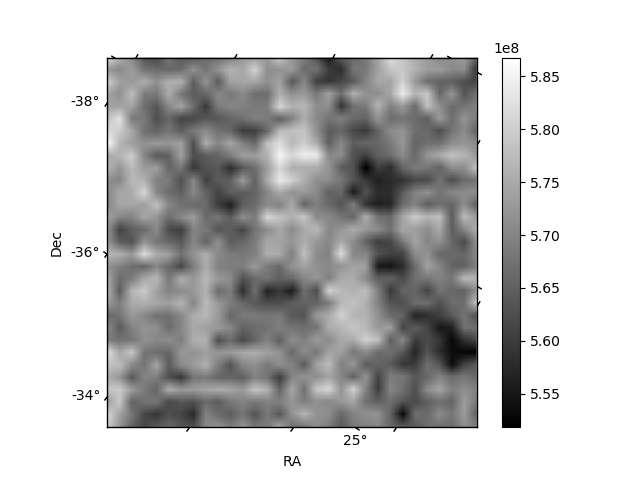
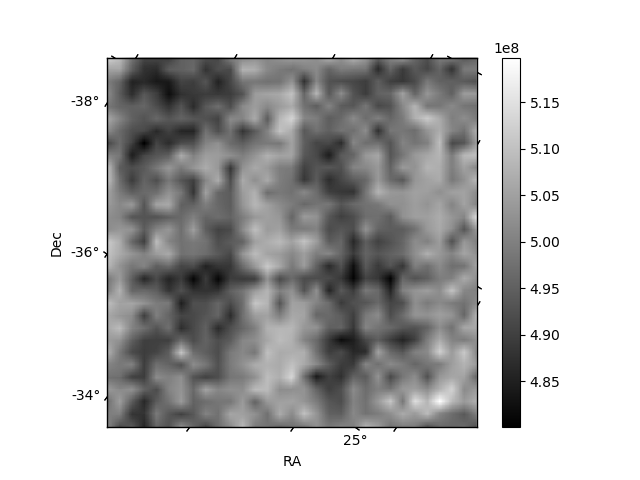
Histogram calculated using DETX and DETY for each event in the final _common_clean file
| Quadrant A | 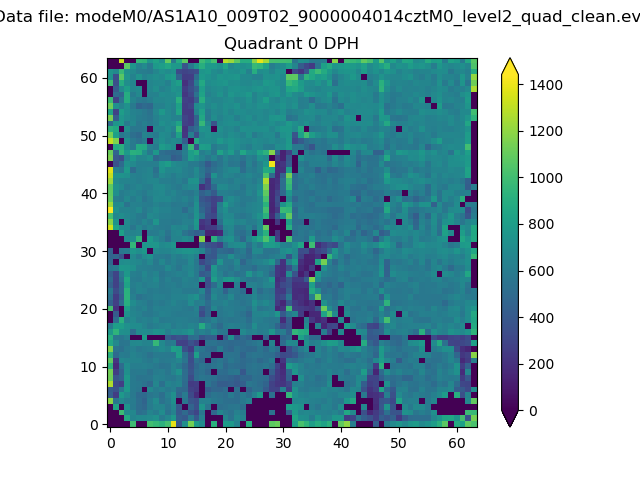 |
 |
Quadrant B |
|---|---|---|---|
| Quadrant D | 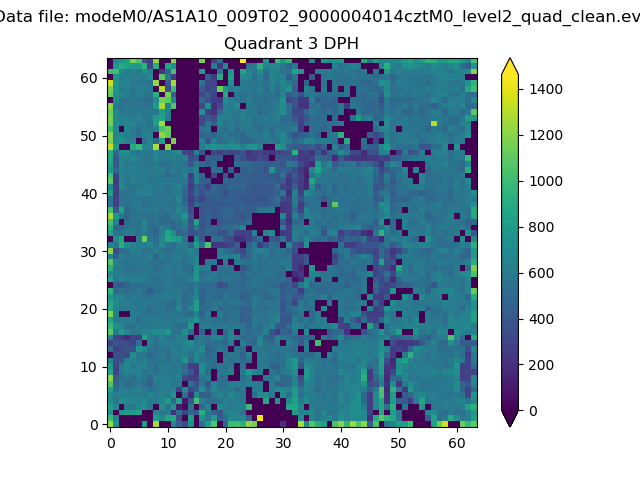 |
 |
Quadrant C |
| Plot type | Count rate plots | Images |
|---|---|---|
| Comparison with Poisson distribution Blue bars denote a histogram of data divided into 1 sec bins. Red curve is a Poisson curve with rate = median count rate of data. |
 |
 |
| Quadrant-wise count rates Data is divided into 100 sec bins |
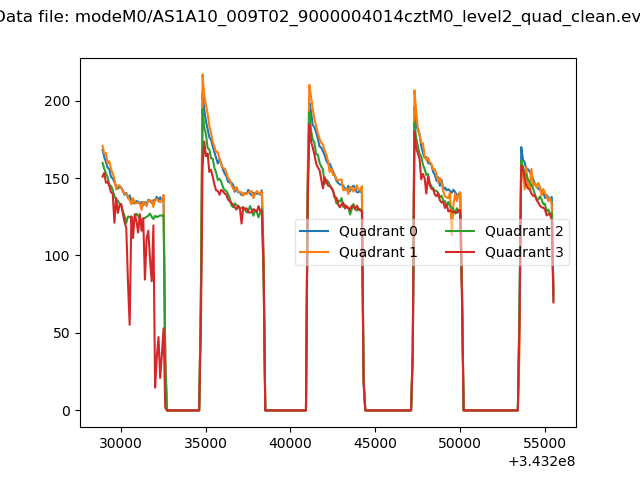 |
|
| Module-wise count rates for Quadrant A Data is divided into 100 sec bins |
 |
 |
| Module-wise count rates for Quadrant B Data is divided into 100 sec bins |
 |
 |
| Module-wise count rates for Quadrant C Data is divided into 100 sec bins |
 |
 |
| Module-wise count rates for Quadrant D Data is divided into 100 sec bins |
 |
 |
| Parameter | Plot |
|---|---|
| CZT HV Monitor |  |
| D_VDD | 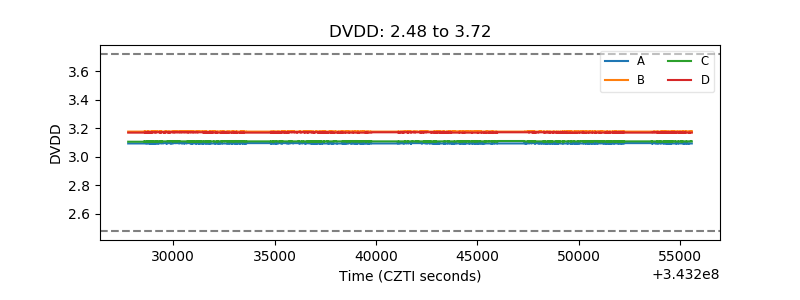 |
| Temperature 1 |  |
| Veto HV Monitor |  |
| Veto LLD |  |
| Alpha Counter |  |
| _CPM_Rate | 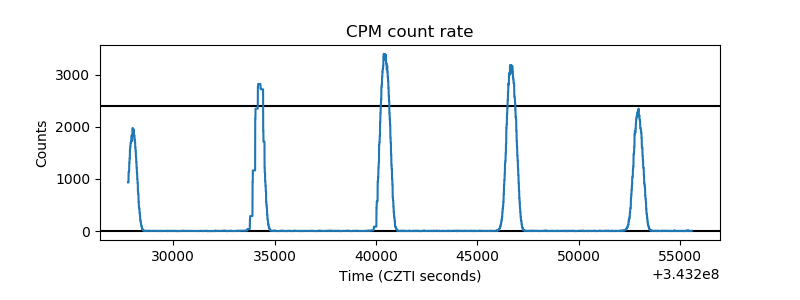 |
| CZT Counter | 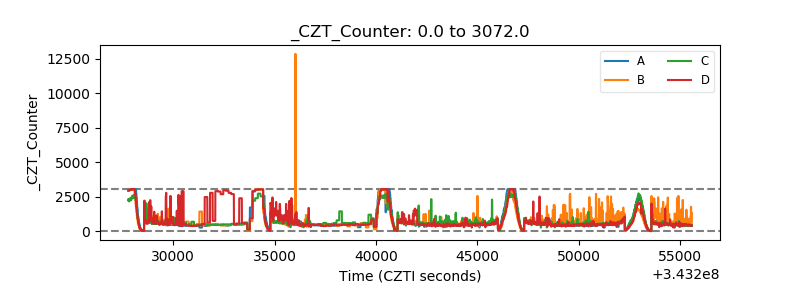 |
| +2.5 Volts monitor | 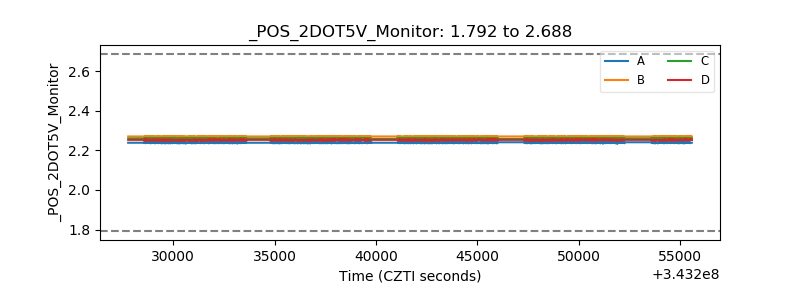 |
| +5 Volts monitor | 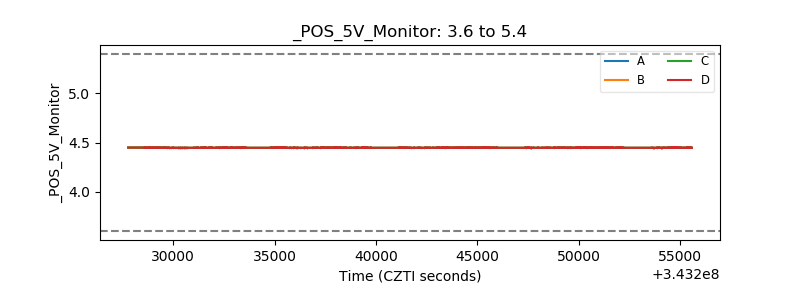 |
| _ROLL_ROT |  |
| _Roll_DEC |  |
| _Roll_RA | 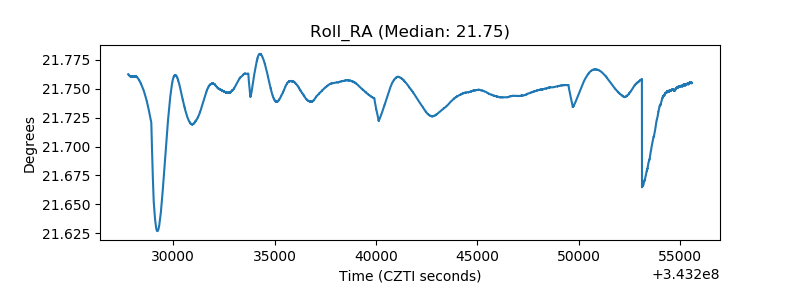 |
| Veto Counter |  |