| Param | Original file | Final file |
|---|---|---|
| Filename | modeM0/AS1A10_009T02_9000004014_27775cztM0_level2.evt | modeM0/AS1A10_009T02_9000004014_27775cztM0_level2_quad_clean.evt |
| Size (bytes) | 606,539,520 | 114,600,960 |
| Size | 578.4 MB | 109.3 MB |
| Events in quadrant A | 3,231,649 | 809,705 |
| Events in quadrant B | 3,572,799 | 818,442 |
| Events in quadrant C | 3,718,260 | 753,676 |
| Events in quadrant D | 7,414,364 | 643,884 |
| Mode M9 | |||
|---|---|---|---|
| Quadrant | BADHDUFLAG | Total packets | Discarded packets |
| A | 0 | 12 | 0 |
| B | 0 | 12 | 0 |
| C | 0 | 12 | 0 |
| D | 0 | 12 | 0 |
| Mode SS | |||
|---|---|---|---|
| Quadrant | BADHDUFLAG | Total packets | Discarded packets |
| A | 0 | 130 | 0 |
| B | 0 | 130 | 0 |
| C | 0 | 130 | 0 |
| D | 0 | 130 | 0 |
| Mode M0 | |||
|---|---|---|---|
| Quadrant | BADHDUFLAG | Total packets | Discarded packets |
| A | 0 | 13716 | 1 |
| B | 0 | 14749 | 1 |
| C | 0 | 15294 | 1 |
| D | 0 | 26302 | 1 |
| Quadrant | Total seconds | Saturated seconds | Saturation percentage |
|---|---|---|---|
| A | 6375 | 64 | 1.003922% |
| B | 6375 | 83 | 1.301961% |
| C | 6375 | 151 | 2.368627% |
| D | 6375 | 1481 | 23.231373% |
Noise dominated data is calculated using 1-second bins in cleaned event files. If a bin has >2000 counts, and if more than 50% of those come from <1% of pixels, then it is considered to be noise-dominated and hence unusable.
| Quadrant | # 1 sec bins | Bins with >0 counts | Bins with >2000 counts | High rate bins dominated by noise | Noise dominated (total time) | Noise dominated (detector-on time) | Marked lightcurve |
|---|---|---|---|---|---|---|---|
| A | 7545 | 6375 | 0 | 0 | 0.00% | 0.00% |  |
| B | 7545 | 6375 | 11 | 11 | 0.15% | 0.17% |  |
| C | 7545 | 6375 | 26 | 26 | 0.34% | 0.41% |  |
| D | 7545 | 6375 | 1392 | 1392 | 18.45% | 21.84% | 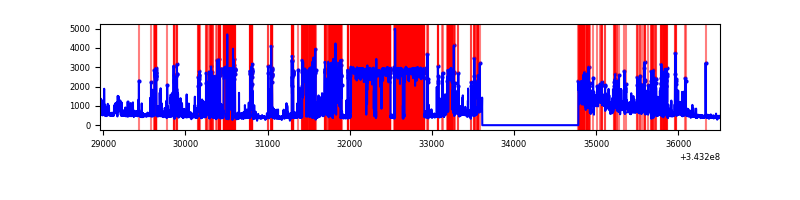 |
Top three noisy pixels from each quadrant. If the there are fewer than three noisy pixels in the level2.evt file, extra rows are filled as -1
| Pixel properties | Quadrant properties | ||||||
|---|---|---|---|---|---|---|---|
| Quadrant | DetID | PixID | Counts | Sigma | Mean | Median | Sigma |
| A | 13 | 254 | 11173 | 61.86 | 837 | 822 | 167.3 |
| A | 3 | 137 | 7524 | 40.05 | 837 | 822 | 167.3 |
| A | 0 | 226 | 7182 | 38.01 | 837 | 822 | 167.3 |
| B | 3 | 64 | 174781 | 1109.68 | 826 | 809 | 156.8 |
| B | 4 | 52 | 96031 | 607.38 | 826 | 809 | 156.8 |
| B | 0 | 190 | 43170 | 270.2 | 826 | 809 | 156.8 |
| C | 3 | 233 | 529306 | 2907.37 | 776 | 781 | 181.8 |
| C | 14 | 238 | 126388 | 690.95 | 776 | 781 | 181.8 |
| C | 10 | 22 | 27758 | 148.4 | 776 | 781 | 181.8 |
| D | 1 | 52 | 4710282 | 29003.53 | 683 | 666 | 162.4 |
| D | 2 | 250 | 79751 | 487.03 | 683 | 666 | 162.4 |
| D | 2 | 234 | 22452 | 134.17 | 683 | 666 | 162.4 |
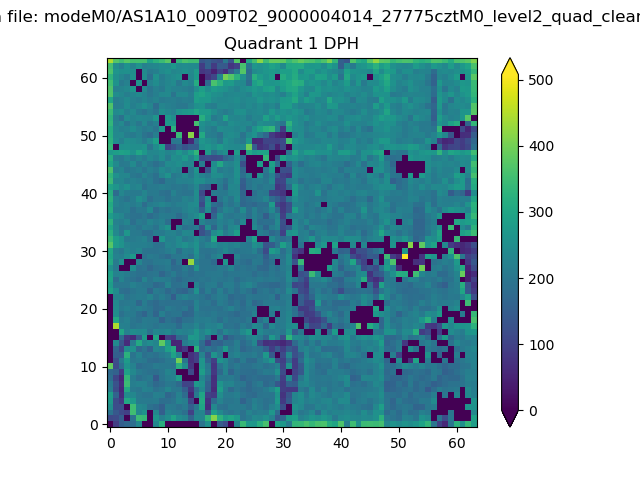
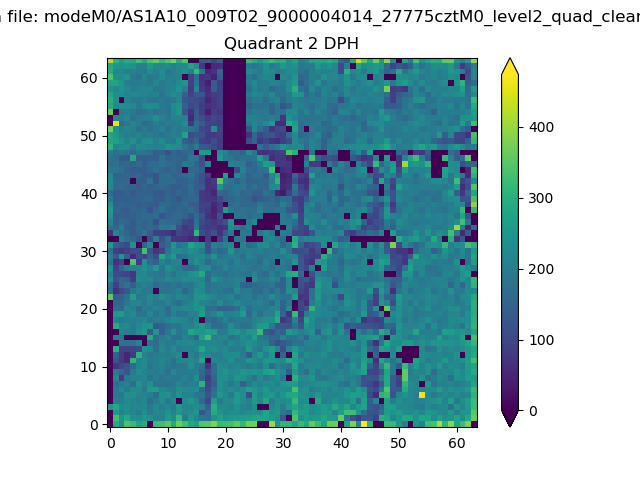
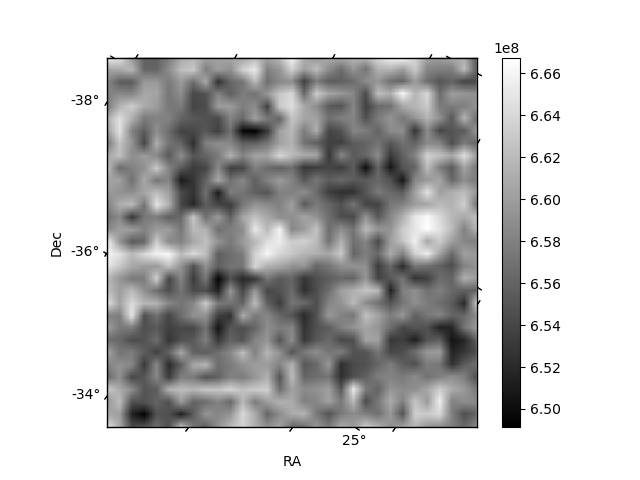
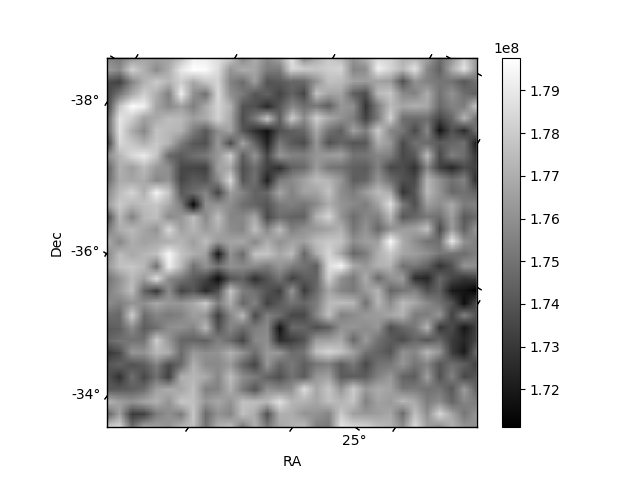
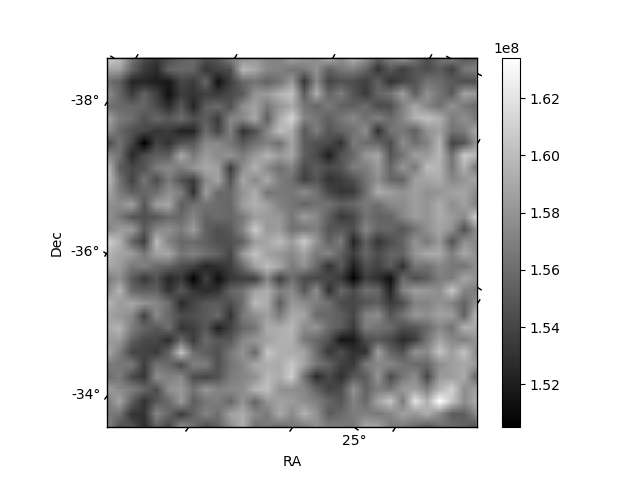
Histogram calculated using DETX and DETY for each event in the final _common_clean file
| Quadrant A | 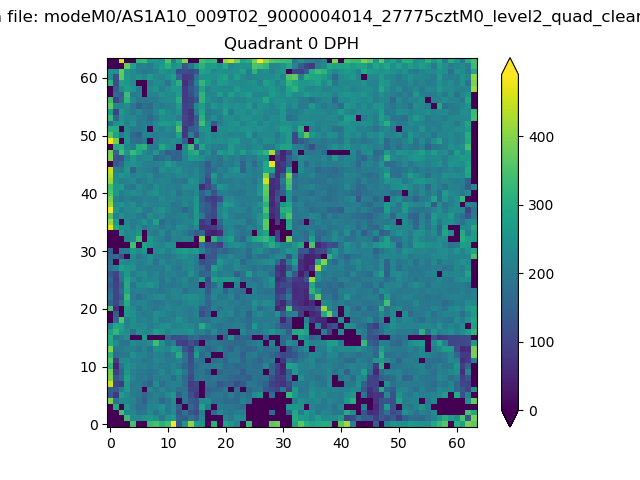 |
 |
Quadrant B |
|---|---|---|---|
| Quadrant D | 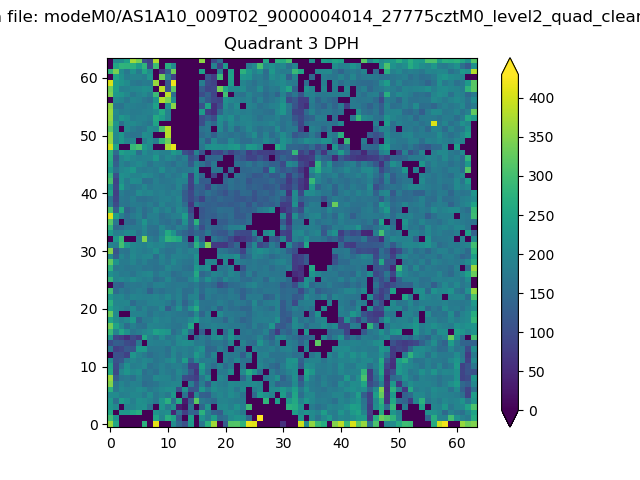 |
 |
Quadrant C |
| Plot type | Count rate plots | Images |
|---|---|---|
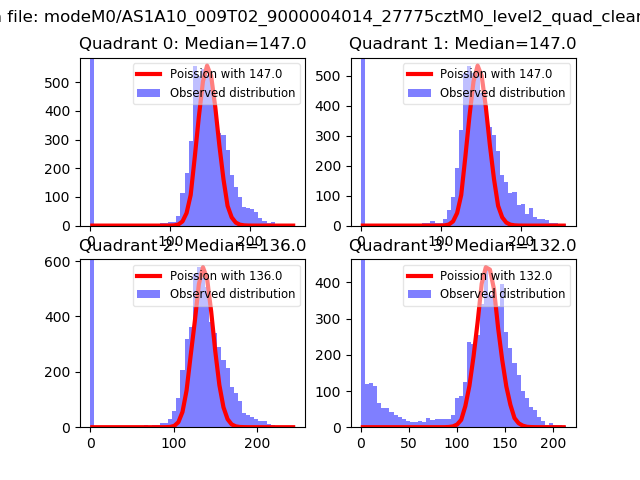
| Comparison with Poisson distribution Blue bars denote a histogram of data divided into 1 sec bins. Red curve is a Poisson curve with rate = median count rate of data. |
 |
 |
| Quadrant-wise count rates Data is divided into 100 sec bins |
 |
|
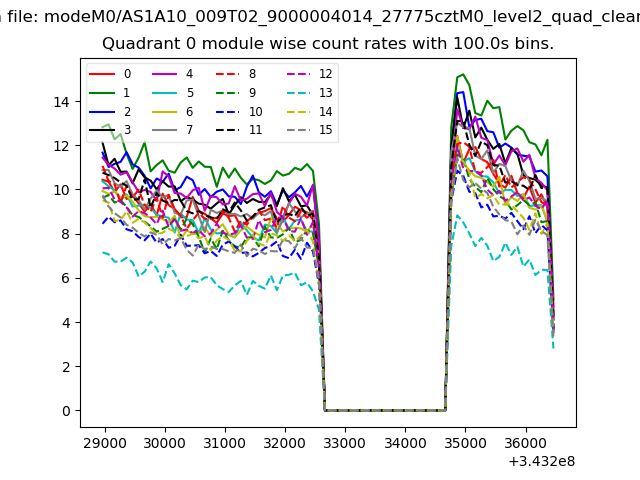
| Module-wise count rates for Quadrant A Data is divided into 100 sec bins |
 |
 |
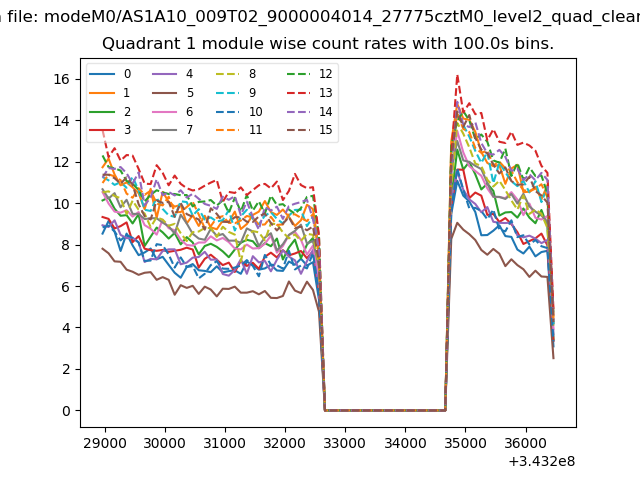
| Module-wise count rates for Quadrant B Data is divided into 100 sec bins |
 |
 |
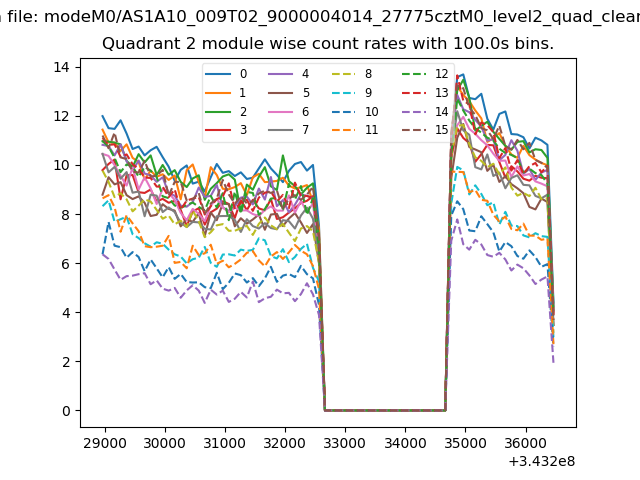
| Module-wise count rates for Quadrant C Data is divided into 100 sec bins |
 |
 |
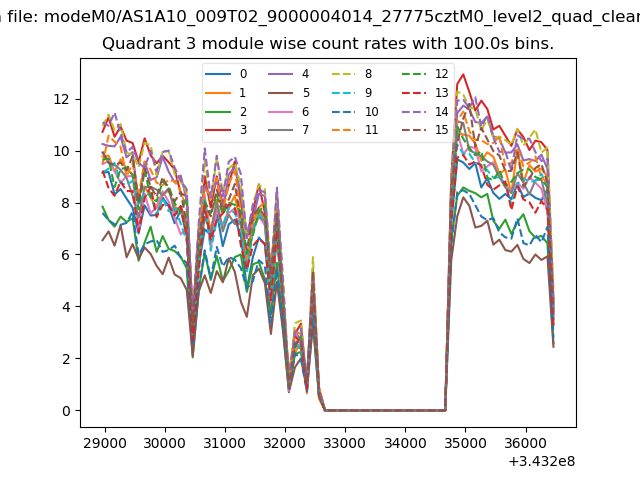
| Module-wise count rates for Quadrant D Data is divided into 100 sec bins |
 |
 |
| Parameter | Plot |
|---|---|
| CZT HV Monitor | 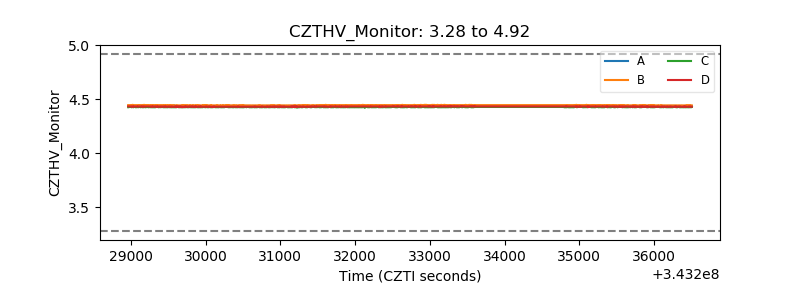 |
| D_VDD | 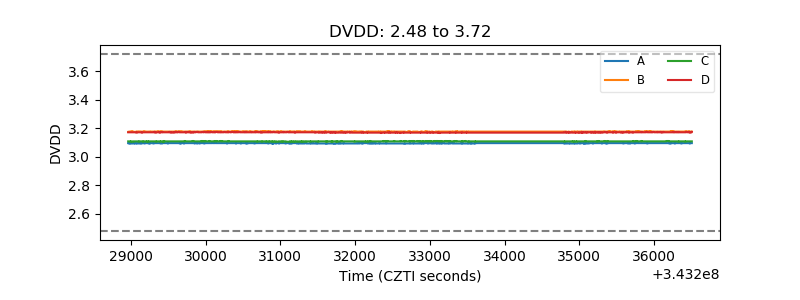 |
| Temperature 1 | 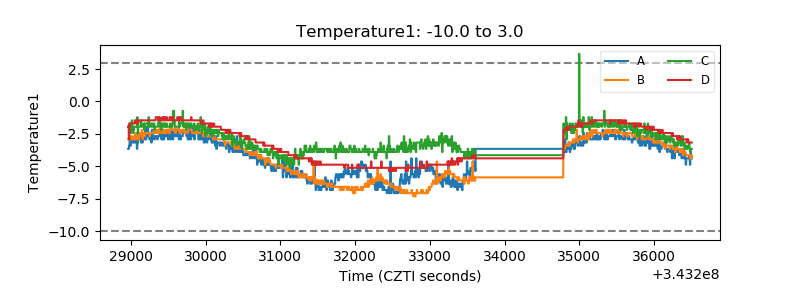 |
| Veto HV Monitor |  |
| Veto LLD | 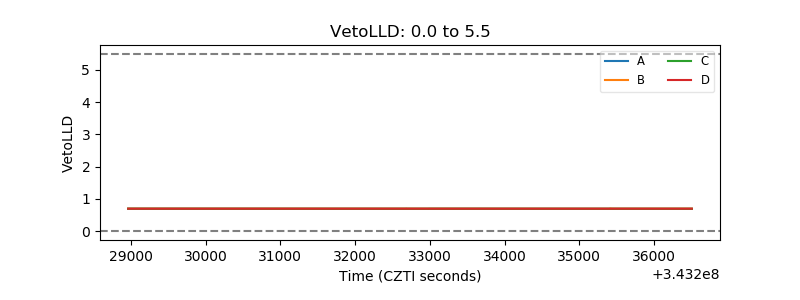 |
| Alpha Counter | 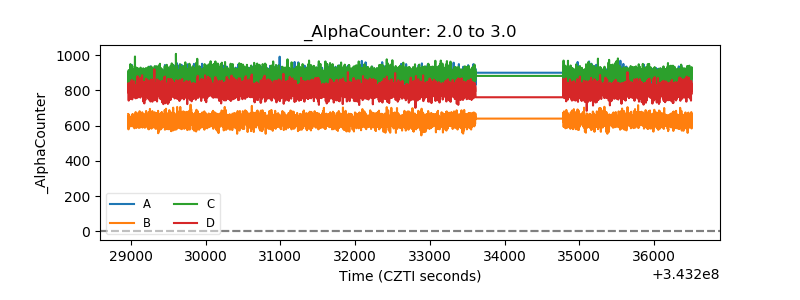 |
| _CPM_Rate | 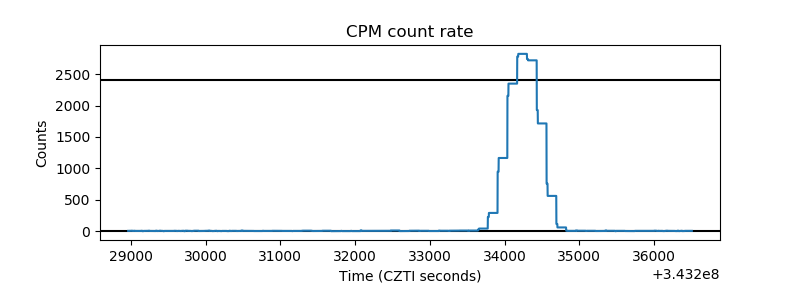 |
| CZT Counter | 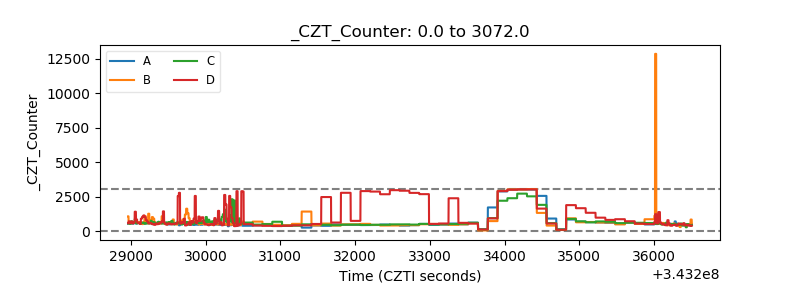 |
| +2.5 Volts monitor |  |
| +5 Volts monitor |  |
| _ROLL_ROT | 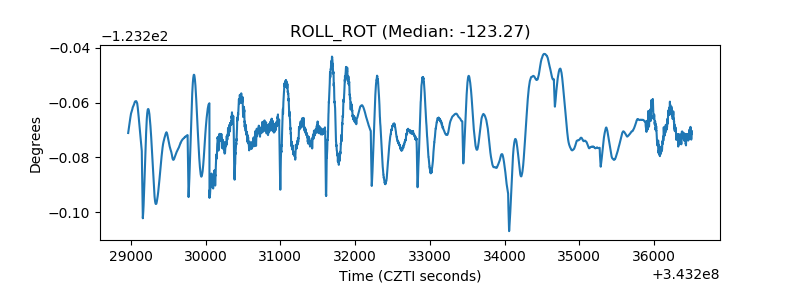 |
| _Roll_DEC | 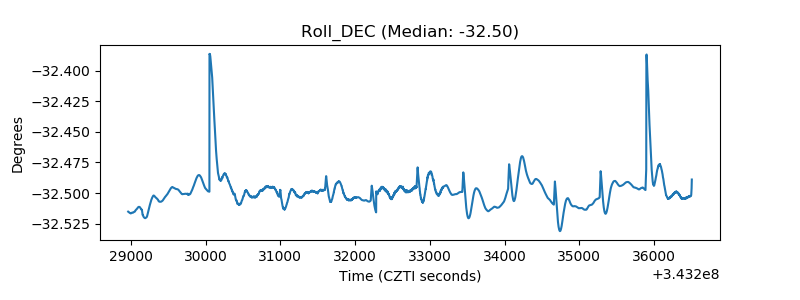 |
| _Roll_RA | 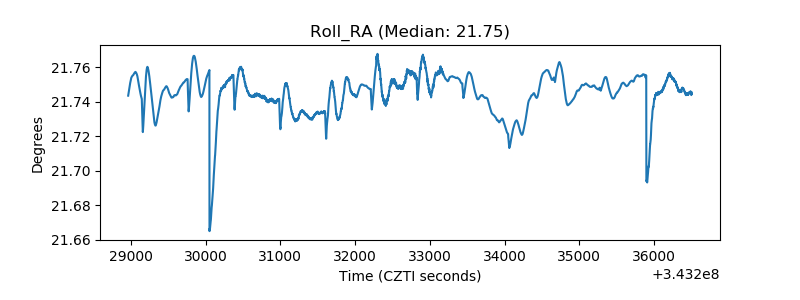 |
| Veto Counter | 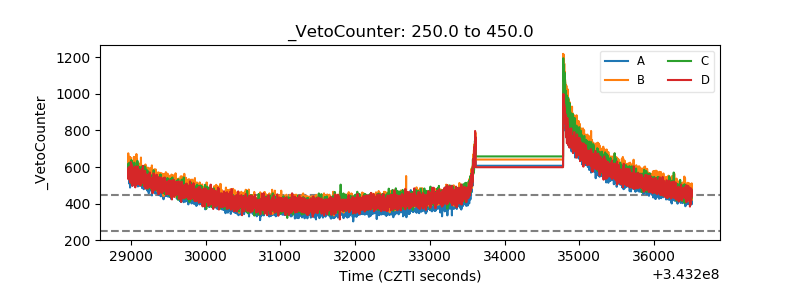 |