| Param | Original file | Final file |
|---|---|---|
| Filename | modeM0/AS1A10_009T02_9000004014_27776cztM0_level2.evt | modeM0/AS1A10_009T02_9000004014_27776cztM0_level2_quad_clean.evt |
| Size (bytes) | 486,406,080 | 114,114,240 |
| Size | 463.9 MB | 108.8 MB |
| Events in quadrant A | 3,234,990 | 784,198 |
| Events in quadrant B | 3,426,280 | 796,945 |
| Events in quadrant C | 3,707,705 | 726,991 |
| Events in quadrant D | 3,937,339 | 711,319 |
| Mode M9 | |||
|---|---|---|---|
| Quadrant | BADHDUFLAG | Total packets | Discarded packets |
| A | 0 | 13 | 0 |
| B | 0 | 13 | 0 |
| C | 0 | 13 | 0 |
| D | 0 | 13 | 0 |
| Mode SS | |||
|---|---|---|---|
| Quadrant | BADHDUFLAG | Total packets | Discarded packets |
| A | 0 | 126 | 0 |
| B | 0 | 126 | 0 |
| C | 0 | 126 | 0 |
| D | 0 | 126 | 0 |
| Mode M0 | |||
|---|---|---|---|
| Quadrant | BADHDUFLAG | Total packets | Discarded packets |
| A | 0 | 13619 | 1 |
| B | 0 | 14166 | 2 |
| C | 0 | 15061 | 1 |
| D | 0 | 16007 | 1 |
| Quadrant | Total seconds | Saturated seconds | Saturation percentage |
|---|---|---|---|
| A | 6264 | 49 | 0.782248% |
| B | 6263 | 71 | 1.133642% |
| C | 6263 | 111 | 1.772314% |
| D | 6263 | 116 | 1.852148% |
Noise dominated data is calculated using 1-second bins in cleaned event files. If a bin has >2000 counts, and if more than 50% of those come from <1% of pixels, then it is considered to be noise-dominated and hence unusable.
| Quadrant | # 1 sec bins | Bins with >0 counts | Bins with >2000 counts | High rate bins dominated by noise | Noise dominated (total time) | Noise dominated (detector-on time) | Marked lightcurve |
|---|---|---|---|---|---|---|---|
| A | 7539 | 6264 | 2 | 2 | 0.03% | 0.03% | 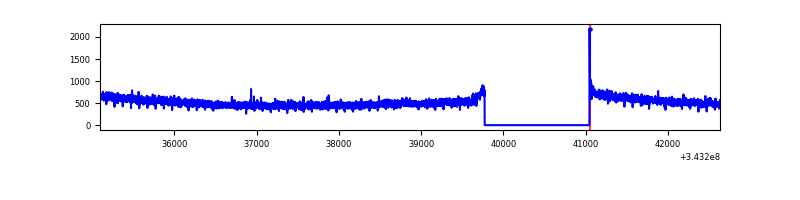 |
| B | 7538 | 6263 | 5 | 5 | 0.07% | 0.08% | 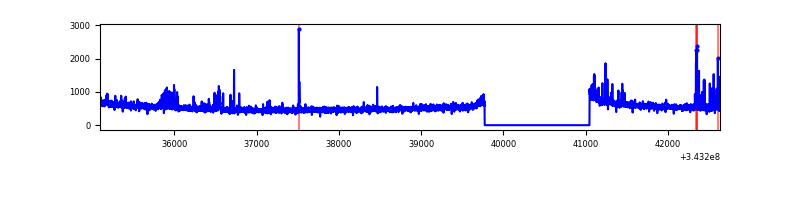 |
| C | 7538 | 6263 | 4 | 4 | 0.05% | 0.06% | 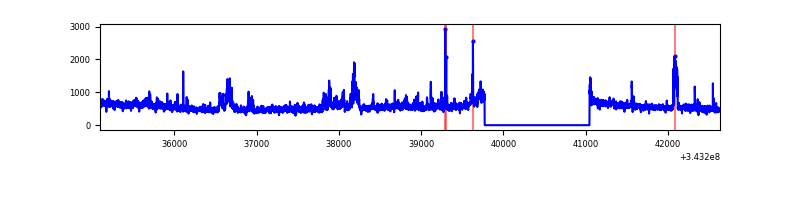 |
| D | 7538 | 6264 | 89 | 89 | 1.18% | 1.42% | 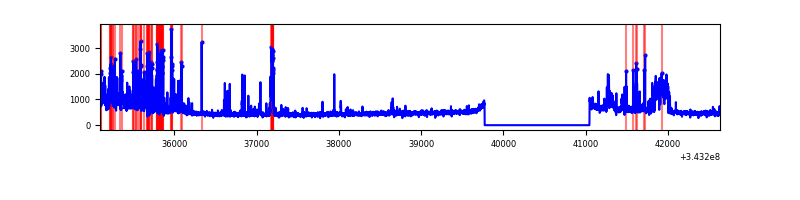 |
Top three noisy pixels from each quadrant. If the there are fewer than three noisy pixels in the level2.evt file, extra rows are filled as -1
| Pixel properties | Quadrant properties | ||||||
|---|---|---|---|---|---|---|---|
| Quadrant | DetID | PixID | Counts | Sigma | Mean | Median | Sigma |
| A | 13 | 254 | 10613 | 58.92 | 838 | 826 | 166.1 |
| A | 3 | 137 | 7400 | 39.57 | 838 | 826 | 166.1 |
| A | 0 | 226 | 7200 | 38.37 | 838 | 826 | 166.1 |
| B | 4 | 52 | 54431 | 345.33 | 830 | 812 | 155.3 |
| B | 3 | 64 | 54024 | 342.71 | 830 | 812 | 155.3 |
| B | 0 | 190 | 42064 | 265.68 | 830 | 812 | 155.3 |
| C | 3 | 233 | 457993 | 2536.73 | 777 | 781 | 180.2 |
| C | 14 | 238 | 129245 | 712.75 | 777 | 781 | 180.2 |
| C | 6 | 112 | 79466 | 436.56 | 777 | 781 | 180.2 |
| D | 1 | 52 | 926186 | 4959.77 | 784 | 765 | 186.6 |
| D | 2 | 234 | 23501 | 121.85 | 784 | 765 | 186.6 |
| D | 2 | 250 | 17023 | 87.13 | 784 | 765 | 186.6 |
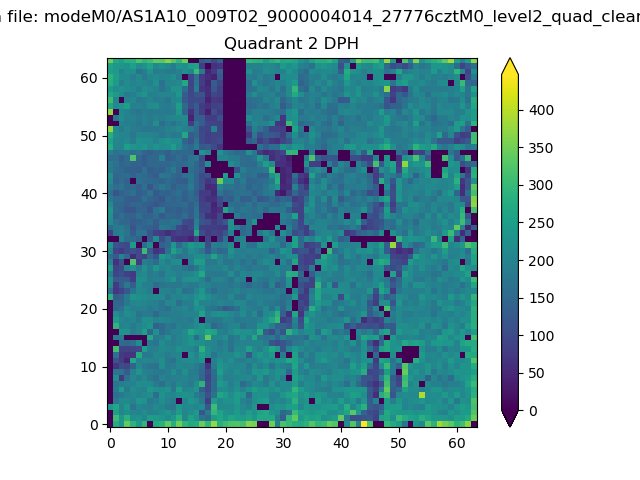
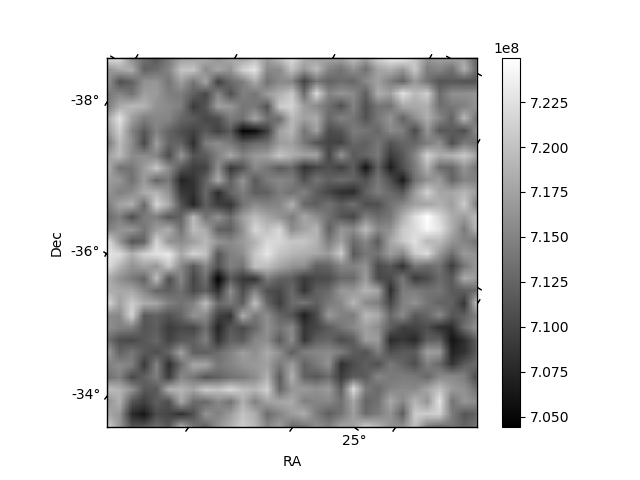
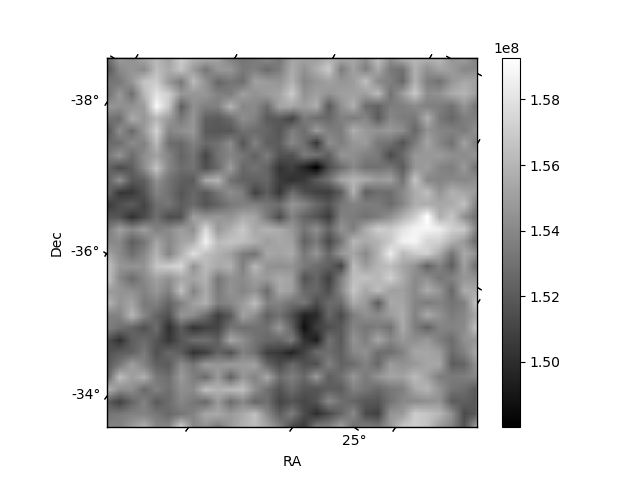
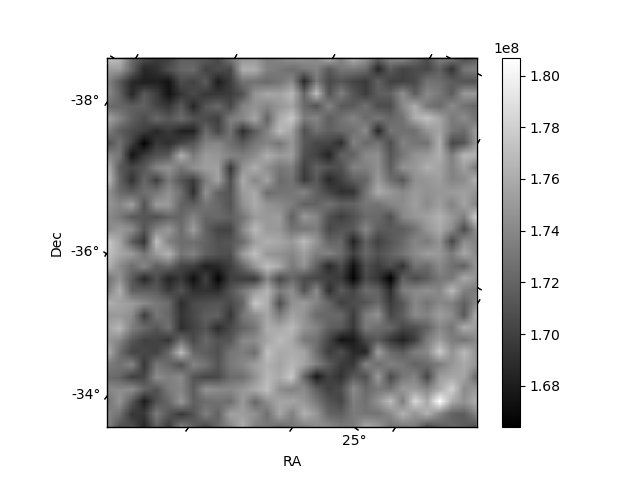
Histogram calculated using DETX and DETY for each event in the final _common_clean file
| Quadrant A | 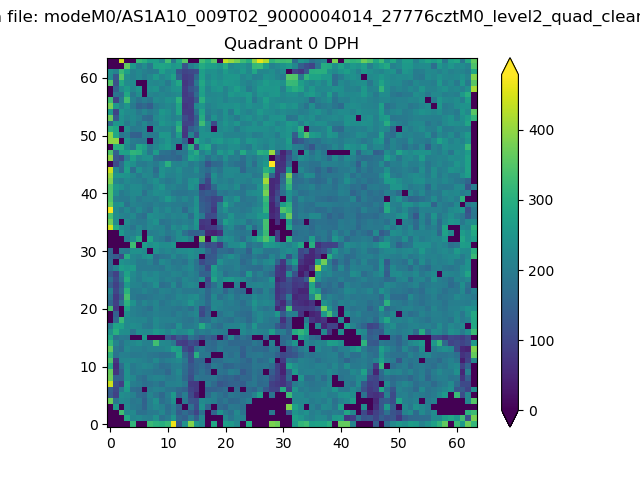 |
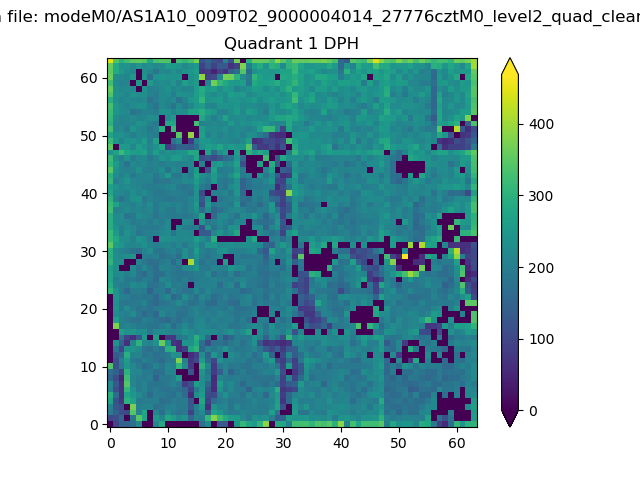 |
Quadrant B |
|---|---|---|---|
| Quadrant D | 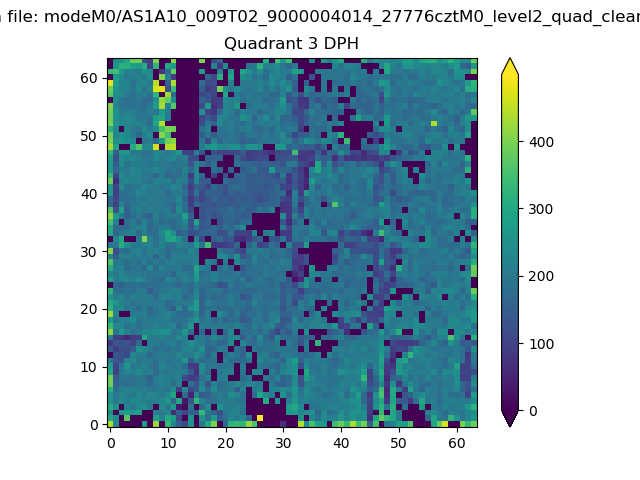 |
 |
Quadrant C |
| Plot type | Count rate plots | Images |
|---|---|---|
| Comparison with Poisson distribution Blue bars denote a histogram of data divided into 1 sec bins. Red curve is a Poisson curve with rate = median count rate of data. |
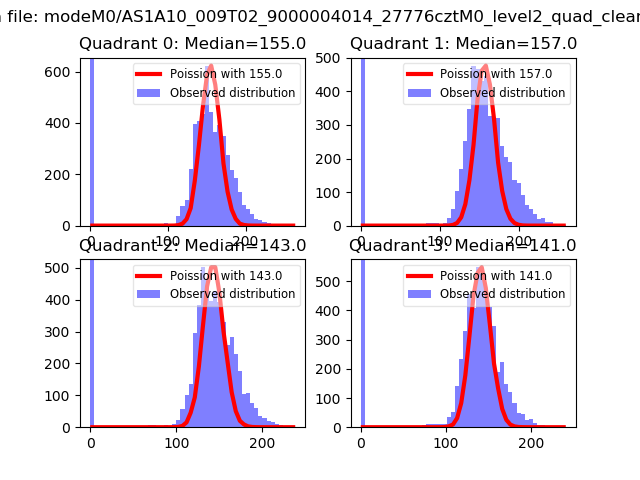 |
 |
| Quadrant-wise count rates Data is divided into 100 sec bins |
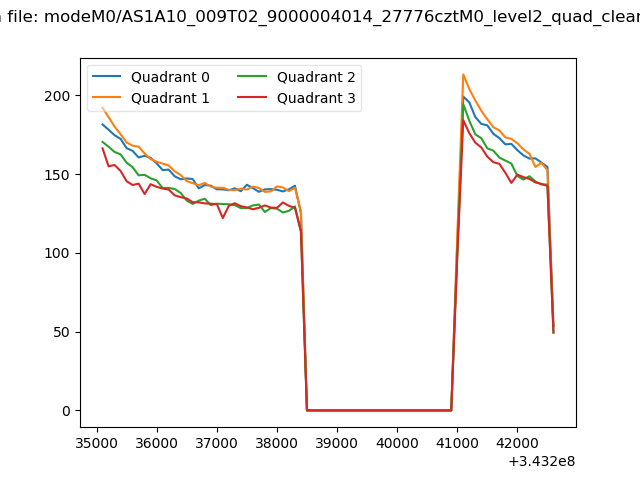 |
|
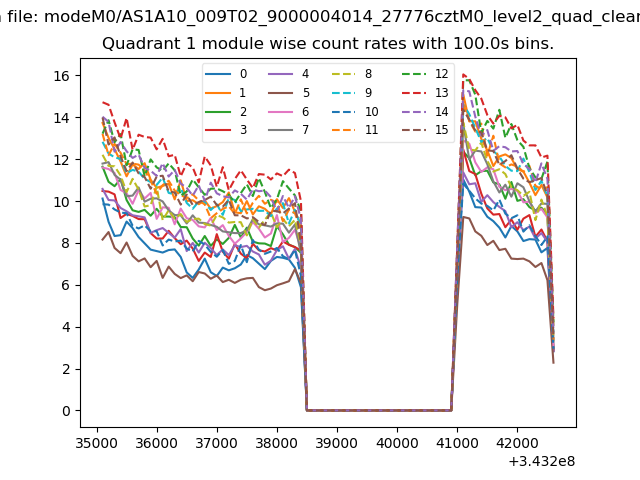
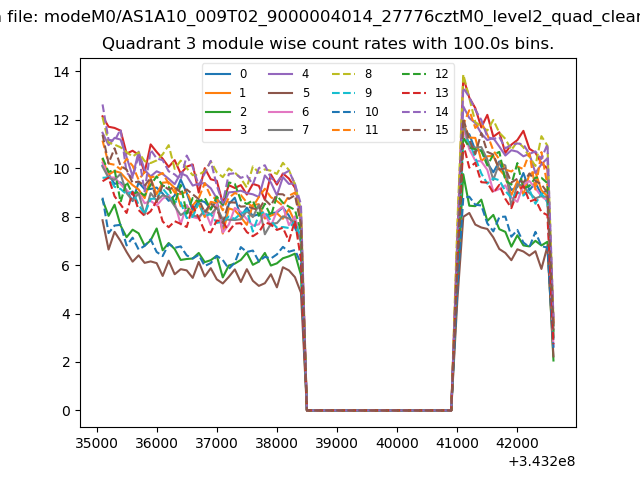
| Module-wise count rates for Quadrant A Data is divided into 100 sec bins |
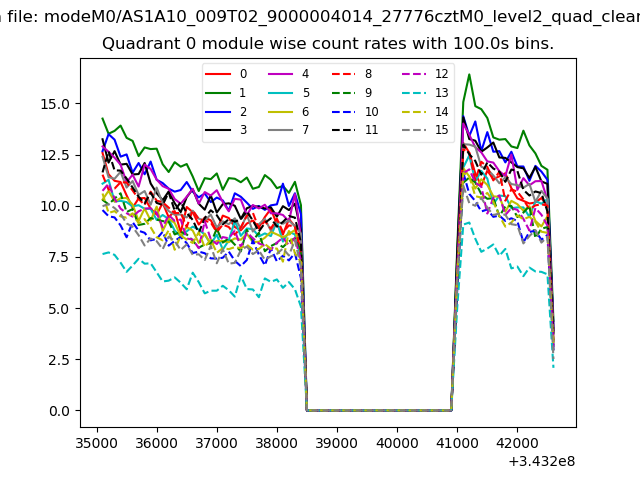 |
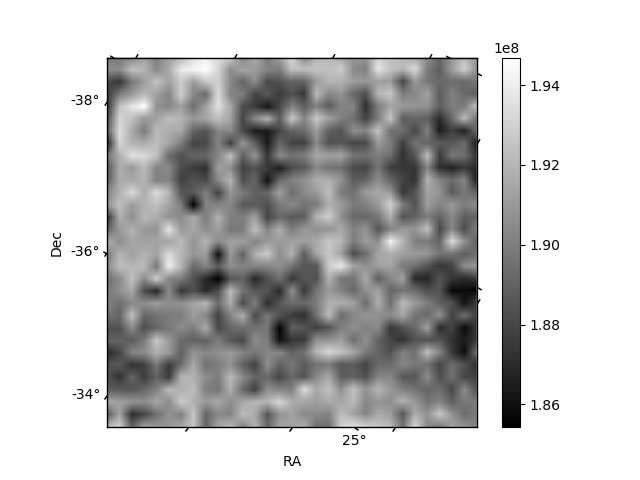 |
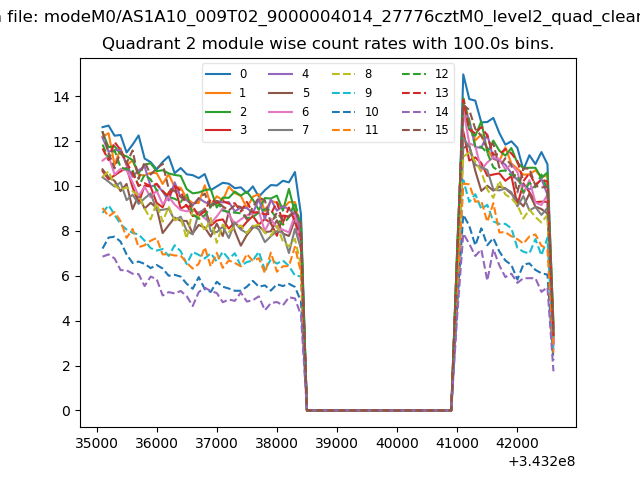
| Module-wise count rates for Quadrant B Data is divided into 100 sec bins |
 |
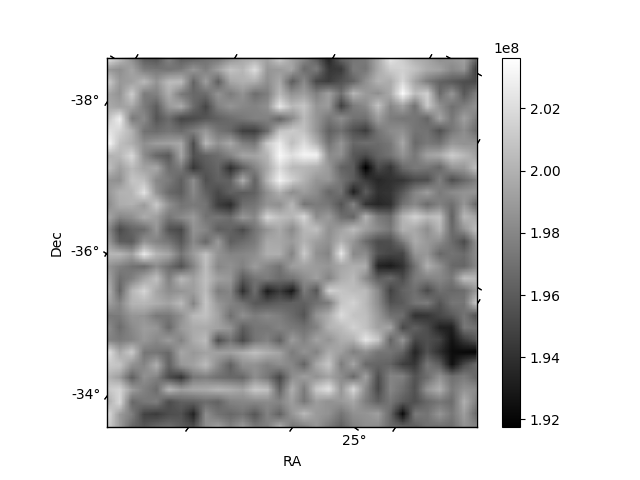 |
| Module-wise count rates for Quadrant C Data is divided into 100 sec bins |
 |
 |
| Module-wise count rates for Quadrant D Data is divided into 100 sec bins |
 |
 |
| Parameter | Plot |
|---|---|
| CZT HV Monitor | 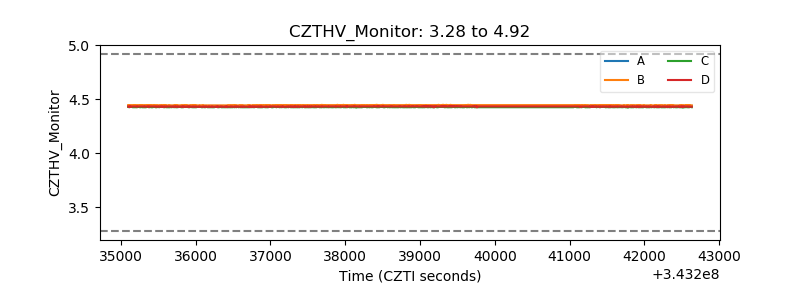 |
| D_VDD | 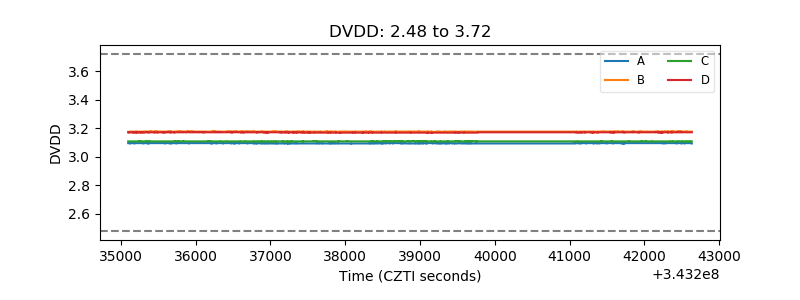 |
| Temperature 1 | 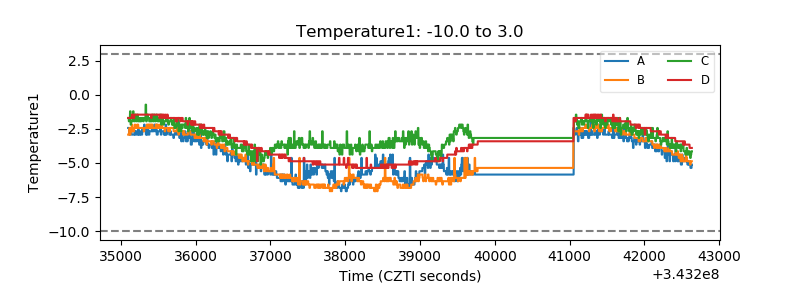 |
| Veto HV Monitor |  |
| Veto LLD | 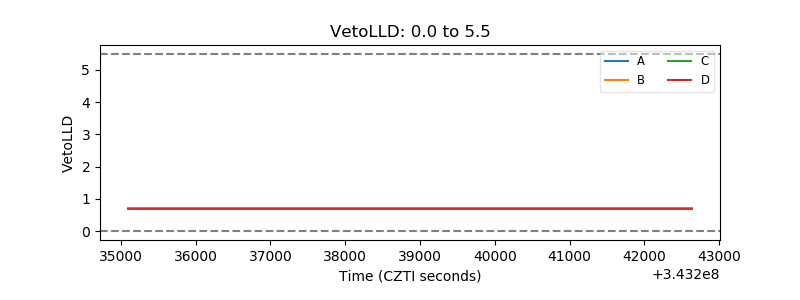 |
| Alpha Counter | 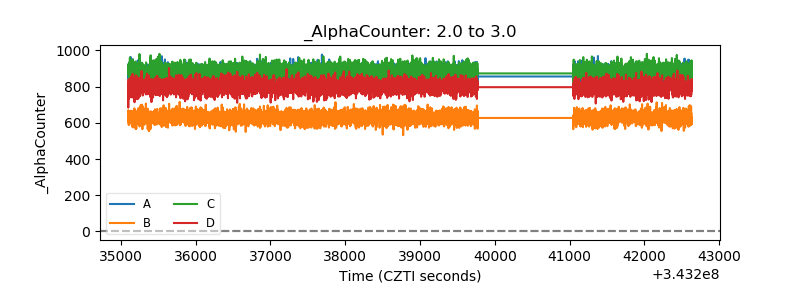 |
| _CPM_Rate | 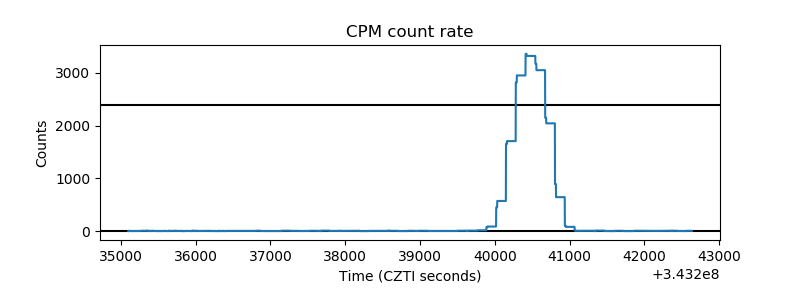 |
| CZT Counter |  |
| +2.5 Volts monitor |  |
| +5 Volts monitor |  |
| _ROLL_ROT | 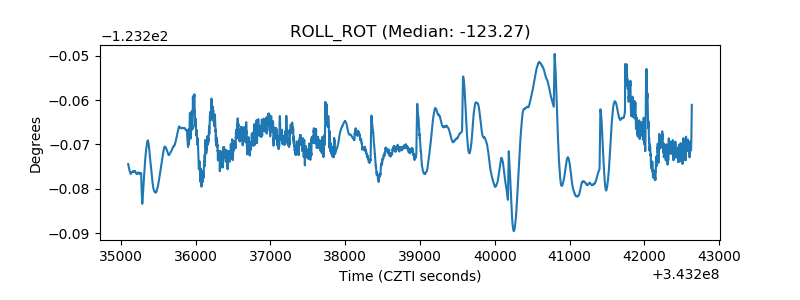 |
| _Roll_DEC | 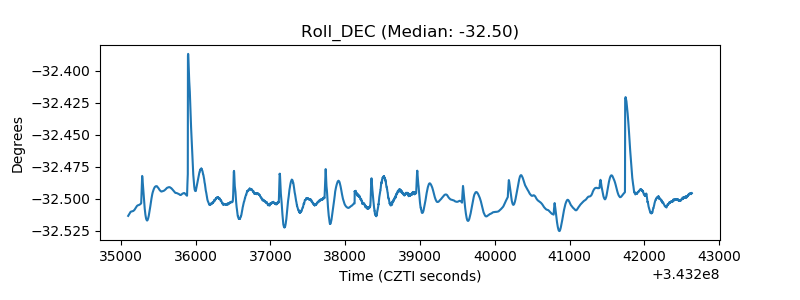 |
| _Roll_RA | 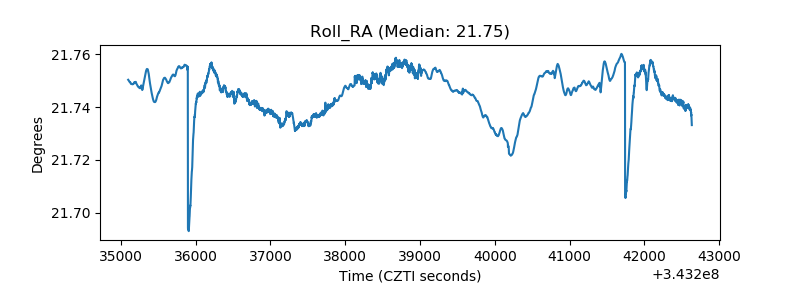 |
| Veto Counter | 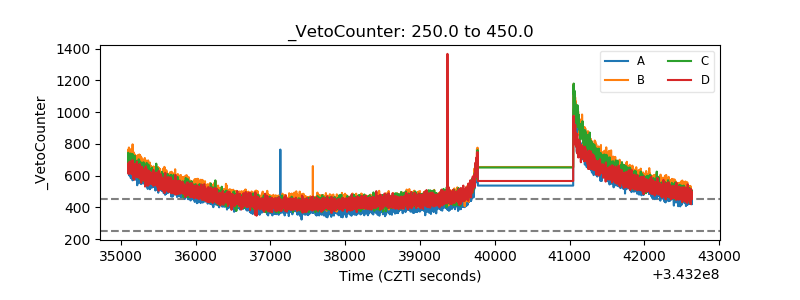 |