| Param | Original file | Final file |
|---|---|---|
| Filename | modeM0/AS1A10_016T01_9000004016cztM0_level2.fits | modeM0/AS1A10_016T01_9000004016cztM0_level2_quad_clean.evt |
| Size (bytes) | 1,241,424,000 | 1,125,679,680 |
| Size | 1.2 GB | 1.0 GB |
| Events in quadrant A | 7,781,450 | 6,768,386 |
| Events in quadrant B | 7,349,026 | 6,694,907 |
| Events in quadrant C | 7,586,392 | 6,416,430 |
| Events in quadrant D | 6,260,658 | 5,599,080 |
| Mode M9 | |||
|---|---|---|---|
| Quadrant | BADHDUFLAG | Total packets | Discarded packets |
| A | 0 | 184 | 0 |
| B | 0 | 184 | 0 |
| C | 0 | 184 | 0 |
| D | 0 | 184 | 0 |
| Mode SS | |||
|---|---|---|---|
| Quadrant | BADHDUFLAG | Total packets | Discarded packets |
| A | 0 | 2562 | 0 |
| B | 0 | 2560 | 0 |
| C | 0 | 2558 | 0 |
| D | 0 | 2562 | 0 |
| Mode M0 | |||
|---|---|---|---|
| Quadrant | BADHDUFLAG | Total packets | Discarded packets |
| A | 0 | 263902 | 0 |
| B | 0 | 296052 | 0 |
| C | 0 | 272518 | 0 |
| D | 0 | 401353 | 0 |
| Quadrant | Total seconds | Saturated seconds | Saturation percentage |
|---|---|---|---|
| A | 125690 | 1485 | 1.181478% |
| B | 125687 | 4140 | 3.293897% |
| C | 125685 | 2567 | 2.042408% |
| D | 125659 | 14279 | 11.363293% |
Noise dominated data is calculated using 1-second bins in cleaned event files. If a bin has >2000 counts, and if more than 50% of those come from <1% of pixels, then it is considered to be noise-dominated and hence unusable.
| Quadrant | # 1 sec bins | Bins with >0 counts | Bins with >2000 counts | High rate bins dominated by noise | Noise dominated (total time) | Noise dominated (detector-on time) | Marked lightcurve |
|---|---|---|---|---|---|---|---|
| A | 144523 | 125751 | 0 | 0 | 0.00% | 0.00% | 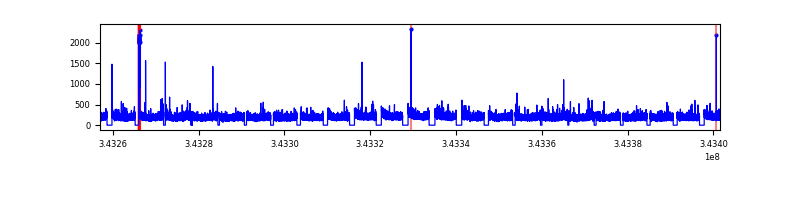 |
| B | 144523 | 125706 | 0 | 0 | 0.00% | 0.00% |  |
| C | 144523 | 125736 | 0 | 0 | 0.00% | 0.00% |  |
| D | 144523 | 125336 | 0 | 0 | 0.00% | 0.00% |  |
Top three noisy pixels from each quadrant. If the there are fewer than three noisy pixels in the level2.evt file, extra rows are filled as -1
| Pixel properties | Quadrant properties | ||||||
|---|---|---|---|---|---|---|---|
| Quadrant | DetID | PixID | Counts | Sigma | Mean | Median | Sigma |
| A | 0 | 29 | 7529 | 11.39 | 2024 | 1895 | 494.4 |
| A | 7 | 110 | 6083 | 8.47 | 2024 | 1895 | 494.4 |
| A | 0 | 30 | 5952 | 8.21 | 2024 | 1895 | 494.4 |
| B | 2 | 9 | 5862 | 10.59 | 1941 | 1849 | 378.8 |
| B | 5 | 128 | 4901 | 8.06 | 1941 | 1849 | 378.8 |
| B | 5 | 232 | 4839 | 7.89 | 1941 | 1849 | 378.8 |
| C | 12 | 241 | 5132 | 6.43 | 2005 | 1871 | 507.5 |
| C | 3 | 126 | 5087 | 6.34 | 2005 | 1871 | 507.5 |
| C | 3 | 187 | 5066 | 6.3 | 2005 | 1871 | 507.5 |
| D | 6 | 231 | 4411 | 5.84 | 1788 | 1629 | 476.2 |
| D | 7 | 3 | 4389 | 5.8 | 1788 | 1629 | 476.2 |
| D | 10 | 189 | 4350 | 5.71 | 1788 | 1629 | 476.2 |
Histogram calculated using DETX and DETY for each event in the final _common_clean file
| Quadrant A | 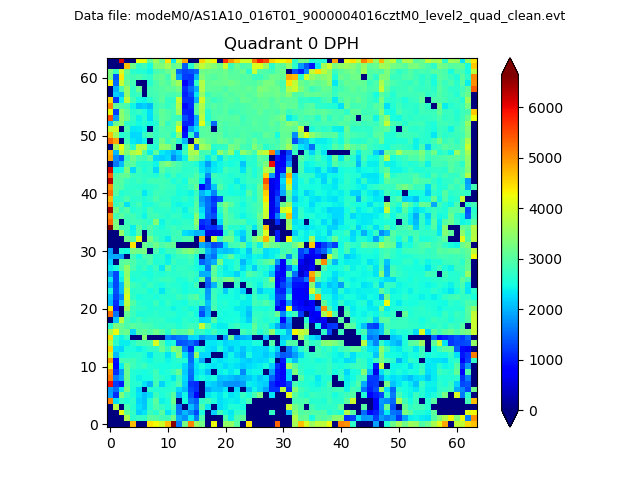 |
 |
Quadrant B |
|---|---|---|---|
| Quadrant D | 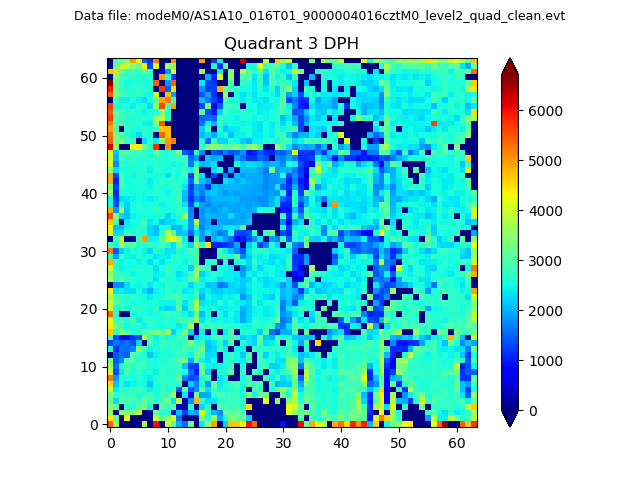 |
 |
Quadrant C |
| Plot type | Count rate plots | Images |
|---|---|---|
| Comparison with Poisson distribution Blue bars denote a histogram of data divided into 1 sec bins. Red curve is a Poisson curve with rate = median count rate of data. |
 |
 |
| Quadrant-wise count rates Data is divided into 100 sec bins |
 |
|
| Module-wise count rates for Quadrant A Data is divided into 100 sec bins |
 |
 |
| Module-wise count rates for Quadrant B Data is divided into 100 sec bins |
 |
 |
| Module-wise count rates for Quadrant C Data is divided into 100 sec bins |
 |
 |
| Module-wise count rates for Quadrant D Data is divided into 100 sec bins |
 |
 |
| Parameter | Plot |
|---|---|
| CZT HV Monitor |  |
| D_VDD |  |
| Temperature 1 |  |
| Veto HV Monitor |  |
| Veto LLD | 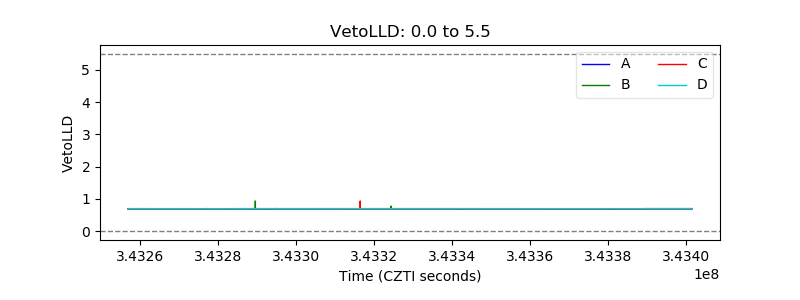 |
| Alpha Counter |  |
| _CPM_Rate | 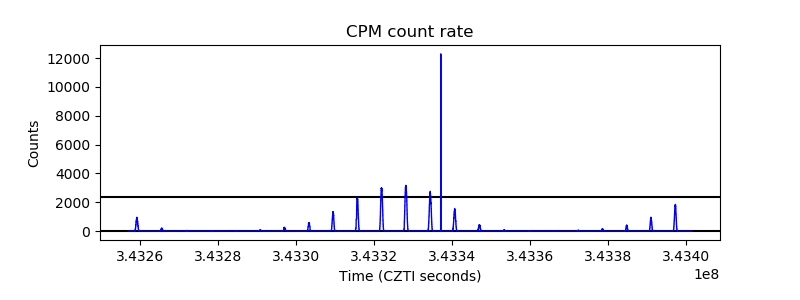 |
| CZT Counter | 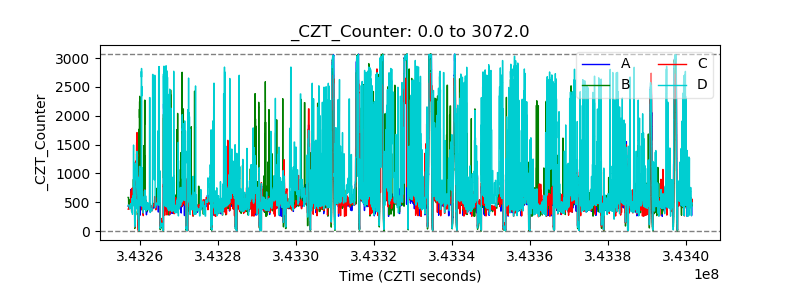 |
| +2.5 Volts monitor | 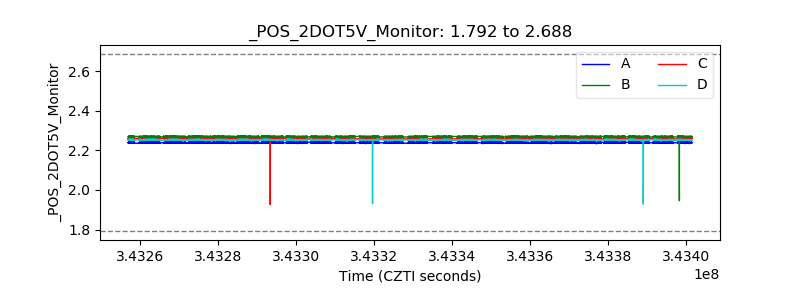 |
| +5 Volts monitor |  |
| _ROLL_ROT | 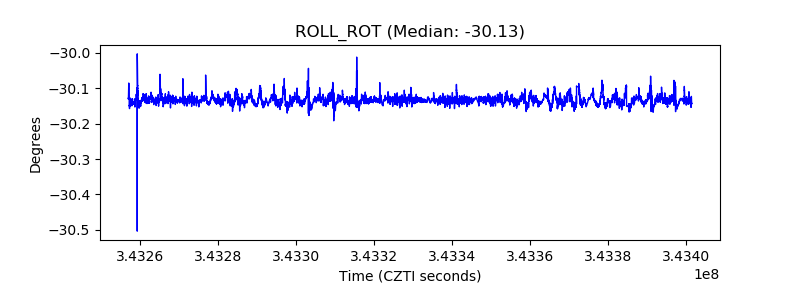 |
| _Roll_DEC |  |
| _Roll_RA | 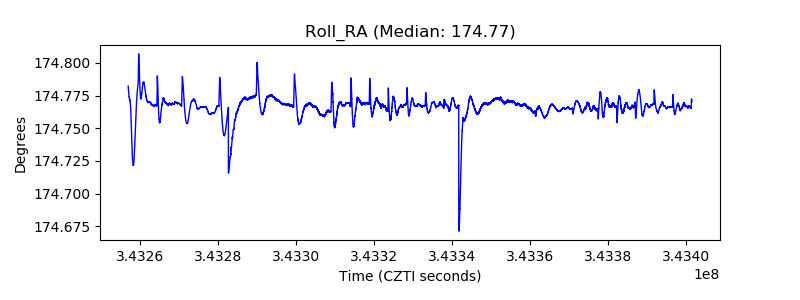 |
| Veto Counter |  |