| Param | Original file | Final file |
|---|---|---|
| Filename | modeM0/AS1A10_016T01_9000004016_27779cztM0_level2.evt | modeM0/AS1A10_016T01_9000004016_27779cztM0_level2_quad_clean.evt |
| Size (bytes) | 238,752,000 | 39,107,520 |
| Size | 227.7 MB | 37.3 MB |
| Events in quadrant A | 1,555,110 | 247,772 |
| Events in quadrant B | 2,123,289 | 251,767 |
| Events in quadrant C | 1,616,523 | 241,797 |
| Events in quadrant D | 1,737,633 | 236,236 |
| Mode M9 | |||
|---|---|---|---|
| Quadrant | BADHDUFLAG | Total packets | Discarded packets |
| A | 0 | 12 | 0 |
| B | 0 | 12 | 0 |
| C | 0 | 12 | 0 |
| D | 0 | 12 | 0 |
| Mode M0 | |||
|---|---|---|---|
| Quadrant | BADHDUFLAG | Total packets | Discarded packets |
| A | 0 | 6367 | 0 |
| B | 0 | 8167 | 0 |
| C | 0 | 6559 | 0 |
| D | 0 | 7016 | 0 |
| Quadrant | Total seconds | Saturated seconds | Saturation percentage |
|---|---|---|---|
| A | 2896 | 84 | 2.900552% |
| B | 2896 | 326 | 11.256906% |
| C | 2896 | 108 | 3.729282% |
| D | 2896 | 144 | 4.972376% |
Noise dominated data is calculated using 1-second bins in cleaned event files. If a bin has >2000 counts, and if more than 50% of those come from <1% of pixels, then it is considered to be noise-dominated and hence unusable.
| Quadrant | # 1 sec bins | Bins with >0 counts | Bins with >2000 counts | High rate bins dominated by noise | Noise dominated (total time) | Noise dominated (detector-on time) | Marked lightcurve |
|---|---|---|---|---|---|---|---|
| A | 4041 | 2896 | 0 | 0 | 0.00% | 0.00% | 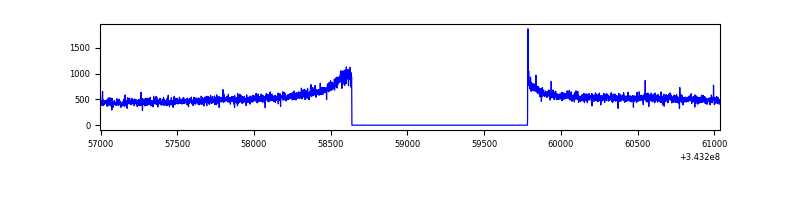 |
| B | 4041 | 2896 | 124 | 124 | 3.07% | 4.28% | 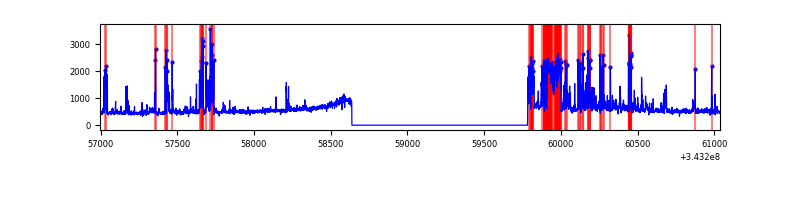 |
| C | 4041 | 2896 | 0 | 0 | 0.00% | 0.00% | 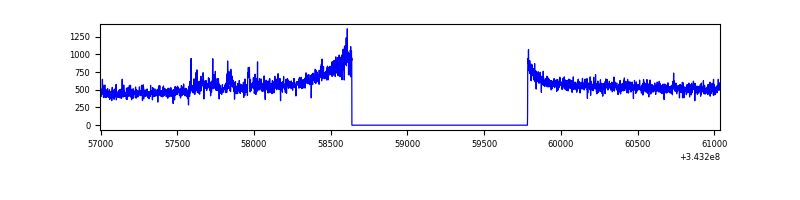 |
| D | 4041 | 2896 | 84 | 84 | 2.08% | 2.90% | 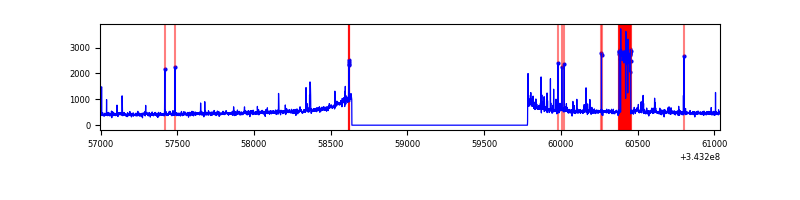 |
Top three noisy pixels from each quadrant. If the there are fewer than three noisy pixels in the level2.evt file, extra rows are filled as -1
| Pixel properties | Quadrant properties | ||||||
|---|---|---|---|---|---|---|---|
| Quadrant | DetID | PixID | Counts | Sigma | Mean | Median | Sigma |
| A | 8 | 192 | 6304 | 71.93 | 400 | 391 | 82.2 |
| A | 13 | 254 | 5504 | 62.2 | 400 | 391 | 82.2 |
| A | 3 | 137 | 3975 | 43.6 | 400 | 391 | 82.2 |
| B | 3 | 64 | 586827 | 7748.99 | 381 | 372 | 75.7 |
| B | 0 | 190 | 18476 | 239.21 | 381 | 372 | 75.7 |
| B | 12 | 111 | 9083 | 115.1 | 381 | 372 | 75.7 |
| C | 3 | 233 | 63769 | 683.36 | 383 | 385 | 92.8 |
| C | 14 | 238 | 60602 | 649.22 | 383 | 385 | 92.8 |
| C | 13 | 61 | 2583 | 23.7 | 383 | 385 | 92.8 |
| D | 1 | 52 | 265246 | 2831.91 | 381 | 370 | 93.5 |
| D | 2 | 250 | 14750 | 153.74 | 381 | 370 | 93.5 |
| D | 2 | 234 | 11747 | 121.64 | 381 | 370 | 93.5 |
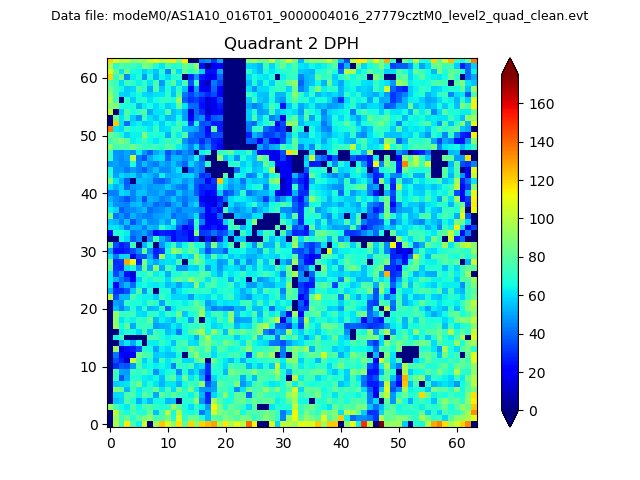
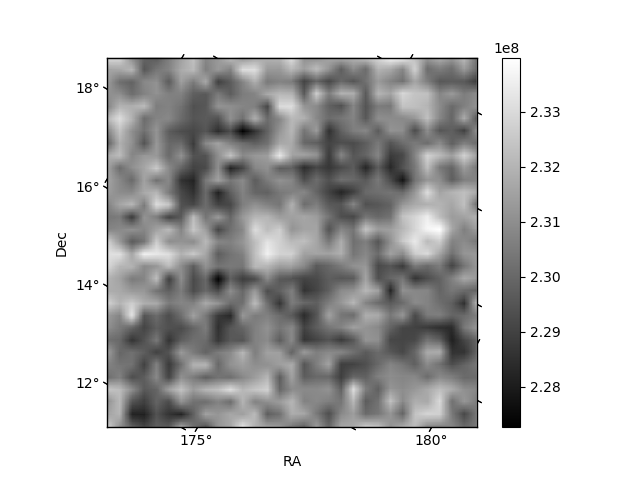
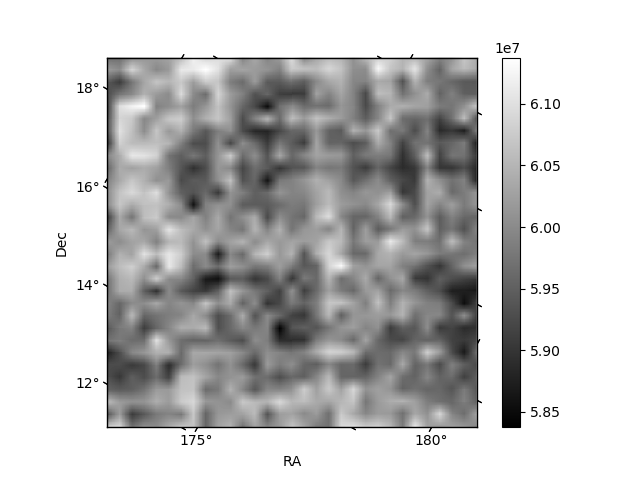
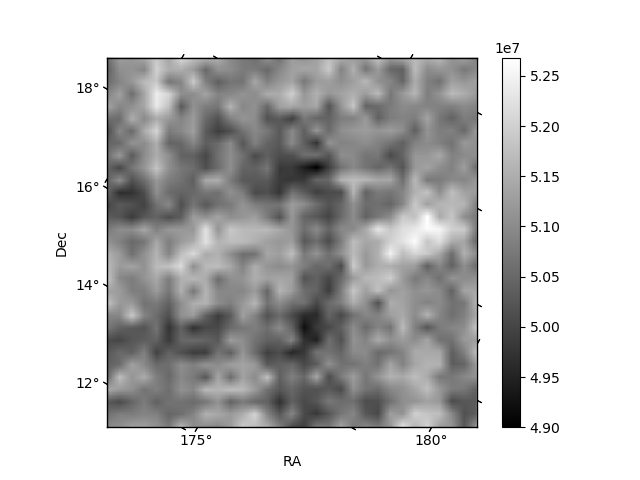
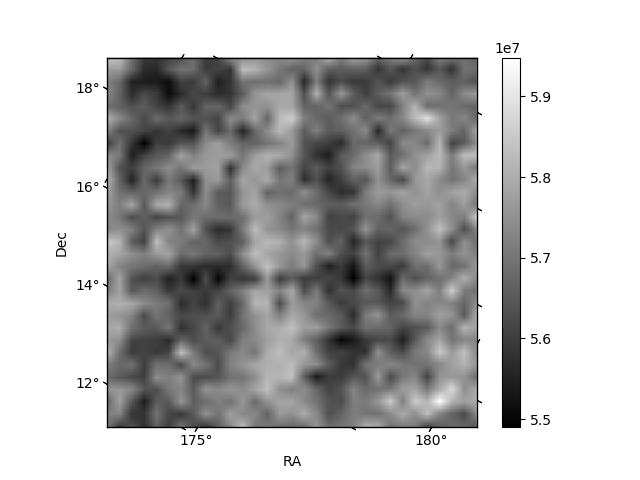
Histogram calculated using DETX and DETY for each event in the final _common_clean file
| Quadrant A | 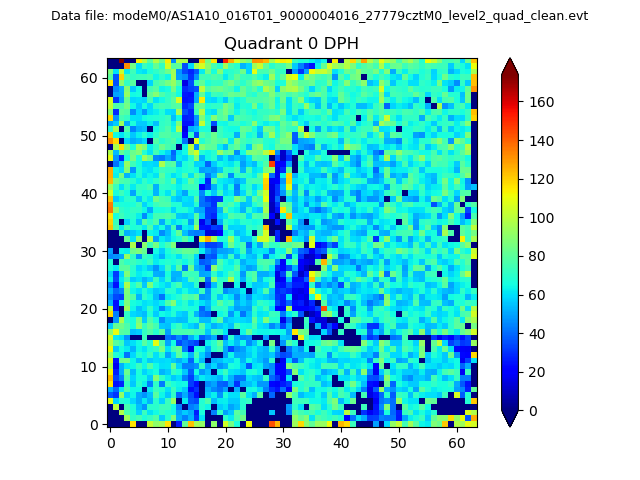 |
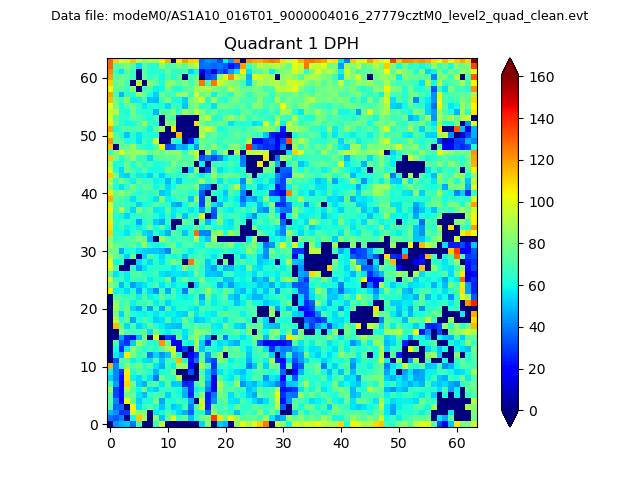 |
Quadrant B |
|---|---|---|---|
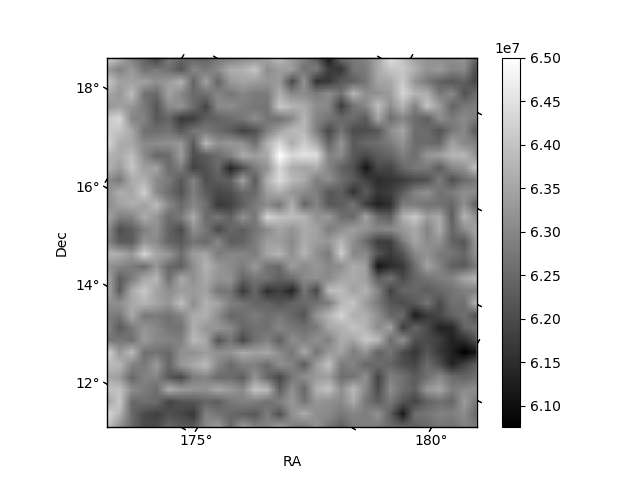
| Quadrant D | 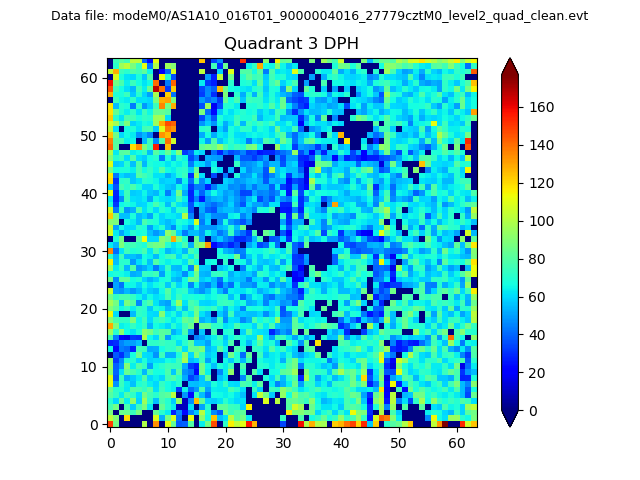 |
 |
Quadrant C |
| Plot type | Count rate plots | Images |
|---|---|---|
| Comparison with Poisson distribution Blue bars denote a histogram of data divided into 1 sec bins. Red curve is a Poisson curve with rate = median count rate of data. |
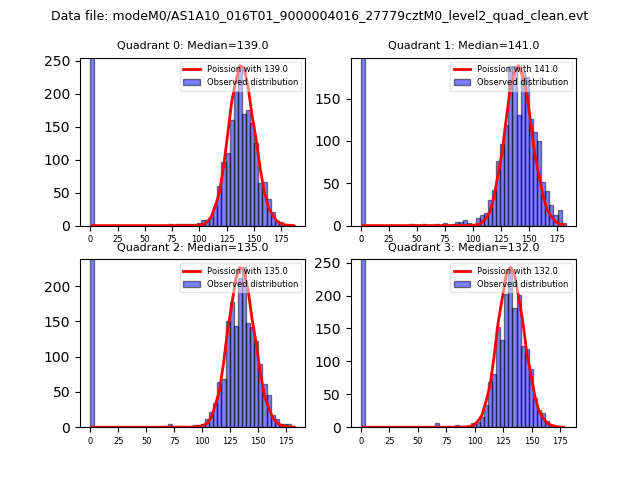 |
 |
| Quadrant-wise count rates Data is divided into 100 sec bins |
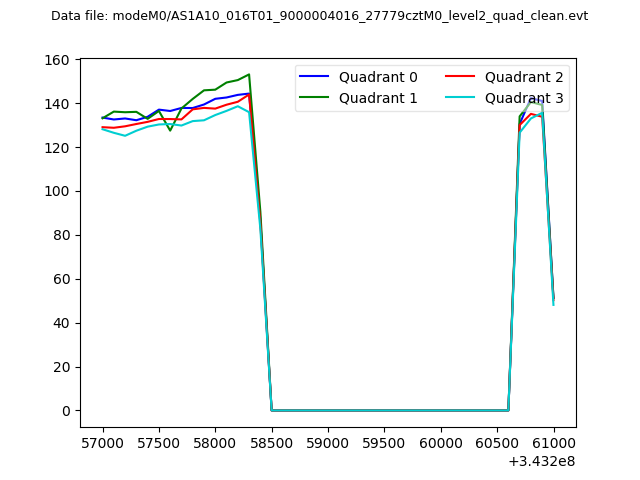 |
|
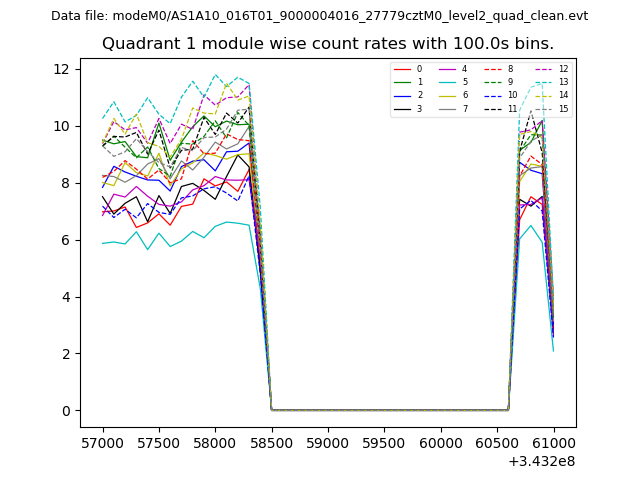
| Module-wise count rates for Quadrant A Data is divided into 100 sec bins |
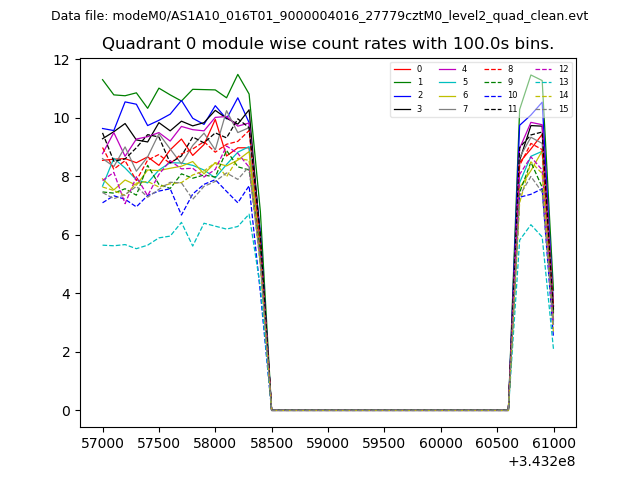 |
 |
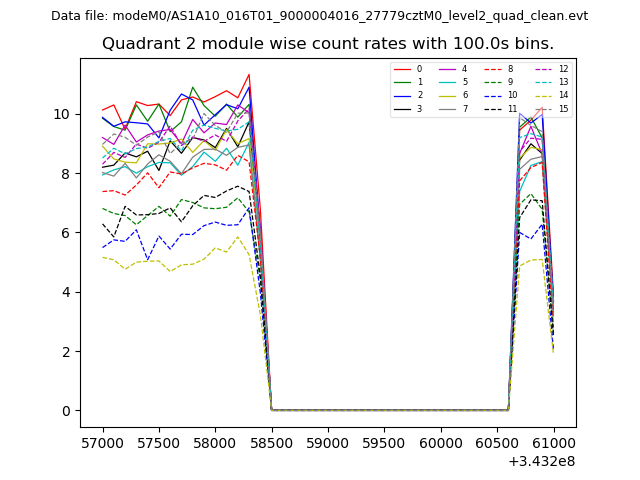
| Module-wise count rates for Quadrant B Data is divided into 100 sec bins |
 |
 |
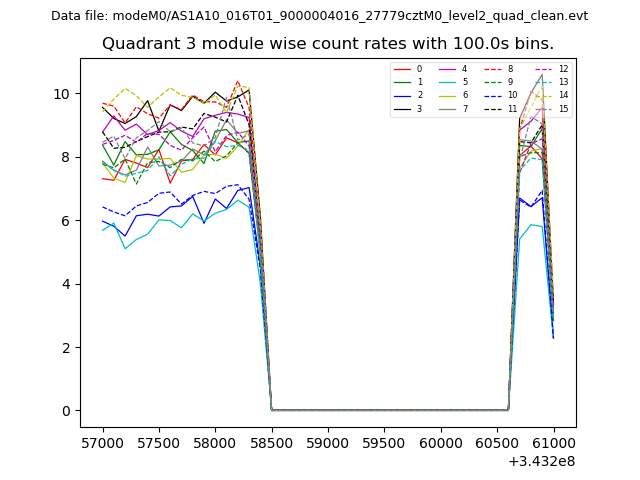
| Module-wise count rates for Quadrant C Data is divided into 100 sec bins |
 |
 |
| Module-wise count rates for Quadrant D Data is divided into 100 sec bins |
 |
 |
| Parameter | Plot |
|---|---|
| CZT HV Monitor | 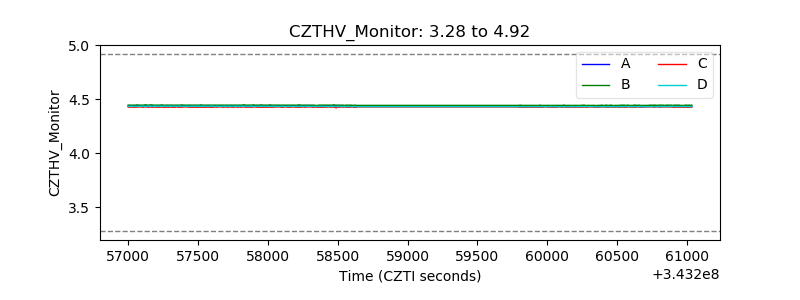 |
| D_VDD | 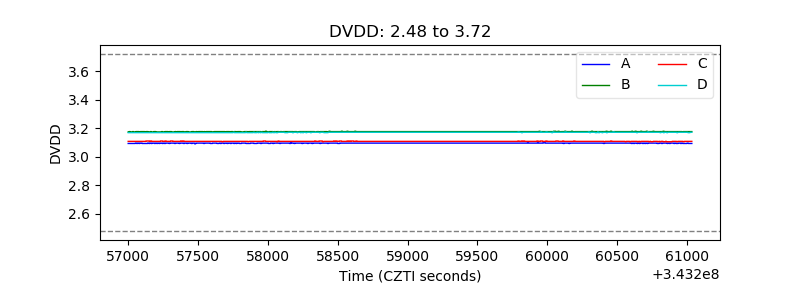 |
| Temperature 1 | 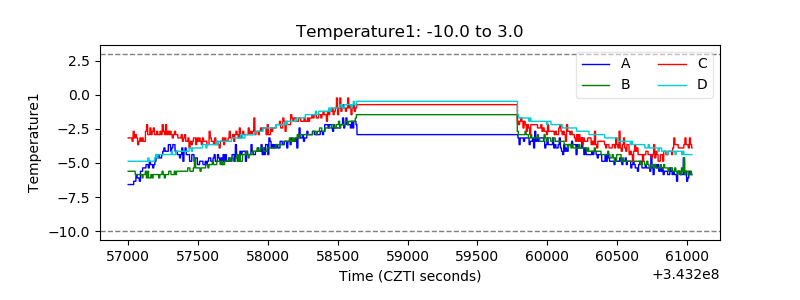 |
| Veto HV Monitor |  |
| Veto LLD | 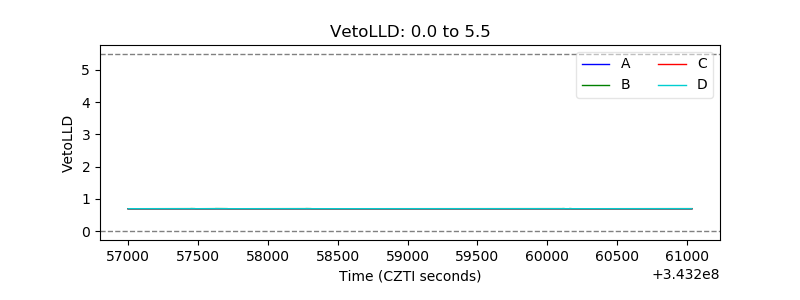 |
| Alpha Counter | 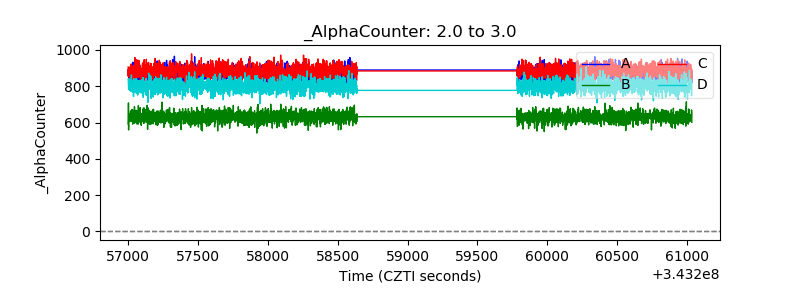 |
| _CPM_Rate | 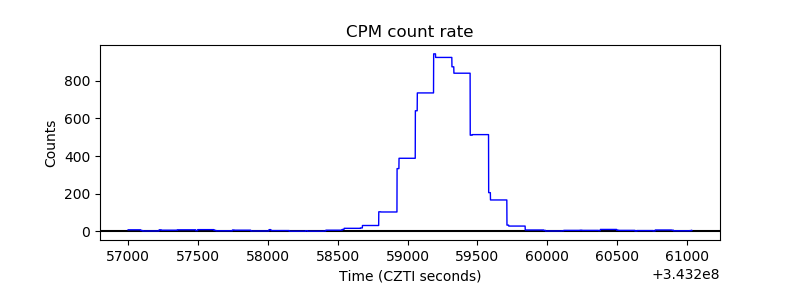 |
| CZT Counter | 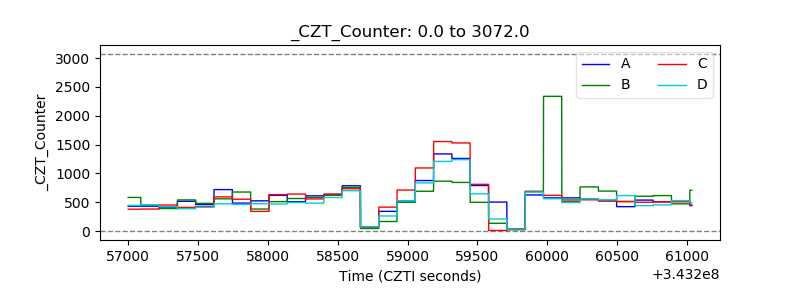 |
| +2.5 Volts monitor |  |
| +5 Volts monitor |  |
| _ROLL_ROT | 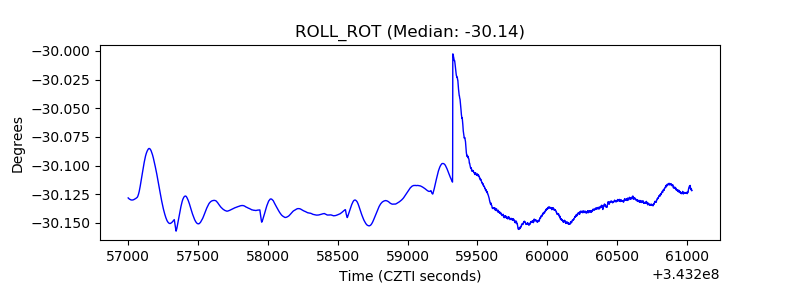 |
| _Roll_DEC | 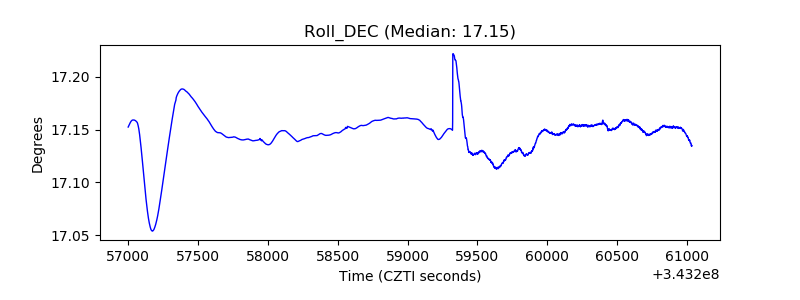 |
| _Roll_RA | 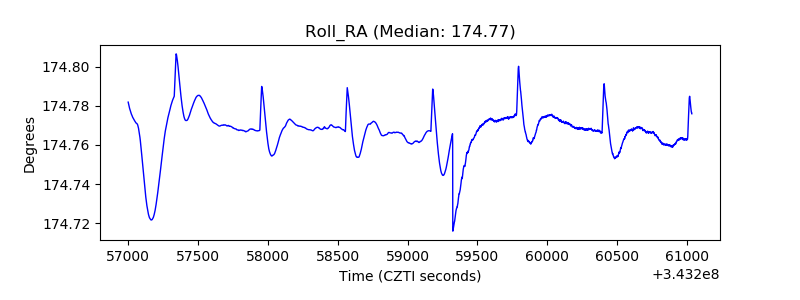 |
| Veto Counter | 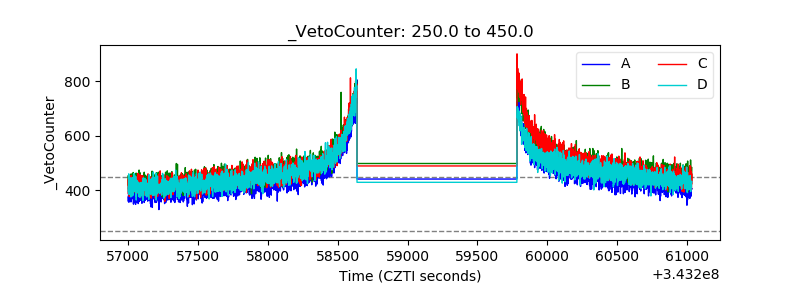 |