| Param | Original file | Final file |
|---|---|---|
| Filename | modeM0/AS1A10_016T01_9000004016_27781cztM0_level2.evt | modeM0/AS1A10_016T01_9000004016_27781cztM0_level2_quad_clean.evt |
| Size (bytes) | 590,751,360 | 98,421,120 |
| Size | 563.4 MB | 93.9 MB |
| Events in quadrant A | 3,911,676 | 633,108 |
| Events in quadrant B | 4,450,084 | 635,683 |
| Events in quadrant C | 3,649,944 | 611,540 |
| Events in quadrant D | 5,383,215 | 591,198 |
| Mode M9 | |||
|---|---|---|---|
| Quadrant | BADHDUFLAG | Total packets | Discarded packets |
| A | 0 | 10 | 0 |
| B | 0 | 11 | 0 |
| C | 0 | 11 | 0 |
| D | 0 | 11 | 0 |
| Mode M0 | |||
|---|---|---|---|
| Quadrant | BADHDUFLAG | Total packets | Discarded packets |
| A | 0 | 16407 | 0 |
| B | 0 | 18074 | 0 |
| C | 0 | 15506 | 0 |
| D | 0 | 21117 | 0 |
| Quadrant | Total seconds | Saturated seconds | Saturation percentage |
|---|---|---|---|
| A | 7312 | 295 | 4.034464% |
| B | 7312 | 332 | 4.540481% |
| C | 7312 | 134 | 1.832604% |
| D | 7312 | 640 | 8.752735% |
Noise dominated data is calculated using 1-second bins in cleaned event files. If a bin has >2000 counts, and if more than 50% of those come from <1% of pixels, then it is considered to be noise-dominated and hence unusable.
| Quadrant | # 1 sec bins | Bins with >0 counts | Bins with >2000 counts | High rate bins dominated by noise | Noise dominated (total time) | Noise dominated (detector-on time) | Marked lightcurve |
|---|---|---|---|---|---|---|---|
| A | 7747 | 7313 | 130 | 130 | 1.68% | 1.78% | 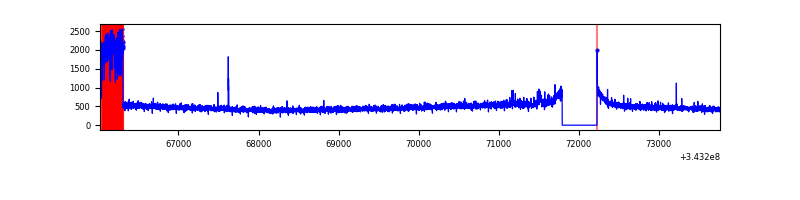 |
| B | 7747 | 7313 | 162 | 162 | 2.09% | 2.22% | 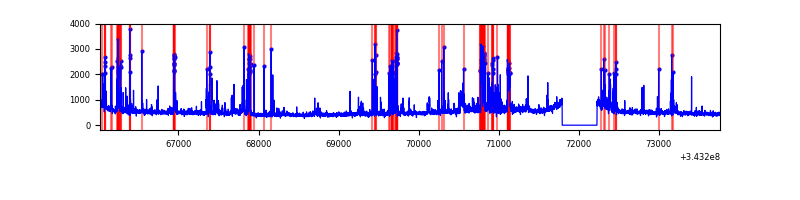 |
| C | 7747 | 7313 | 2 | 2 | 0.03% | 0.03% | 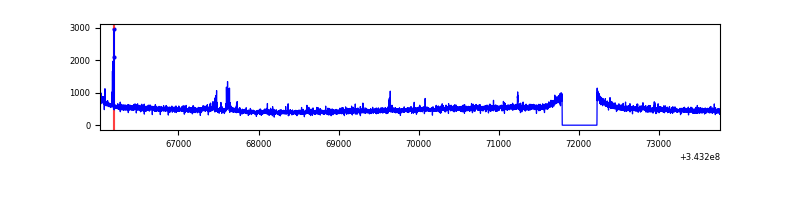 |
| D | 7747 | 7313 | 502 | 502 | 6.48% | 6.86% | 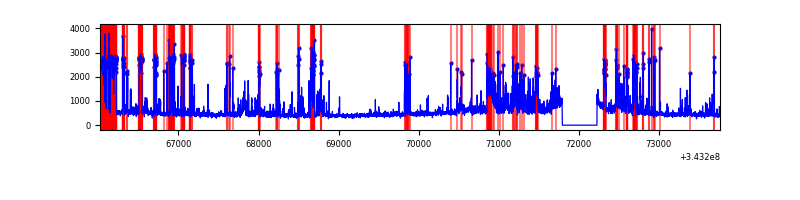 |
Top three noisy pixels from each quadrant. If the there are fewer than three noisy pixels in the level2.evt file, extra rows are filled as -1
| Pixel properties | Quadrant properties | ||||||
|---|---|---|---|---|---|---|---|
| Quadrant | DetID | PixID | Counts | Sigma | Mean | Median | Sigma |
| A | 6 | 16 | 400646 | 2188.64 | 899 | 878 | 182.7 |
| A | 13 | 248 | 20542 | 107.66 | 899 | 878 | 182.7 |
| A | 8 | 192 | 13299 | 68.0 | 899 | 878 | 182.7 |
| B | 3 | 64 | 826108 | 4785.23 | 893 | 870 | 172.5 |
| B | 4 | 52 | 33597 | 189.77 | 893 | 870 | 172.5 |
| B | 5 | 255 | 30878 | 174.0 | 893 | 870 | 172.5 |
| C | 14 | 238 | 139263 | 669.7 | 871 | 878 | 206.6 |
| C | 3 | 233 | 103738 | 497.78 | 871 | 878 | 206.6 |
| C | 4 | 175 | 12926 | 58.3 | 871 | 878 | 206.6 |
| D | 1 | 52 | 1642950 | 8027.27 | 837 | 811 | 204.6 |
| D | 13 | 104 | 463749 | 2262.98 | 837 | 811 | 204.6 |
| D | 2 | 250 | 67445 | 325.73 | 837 | 811 | 204.6 |
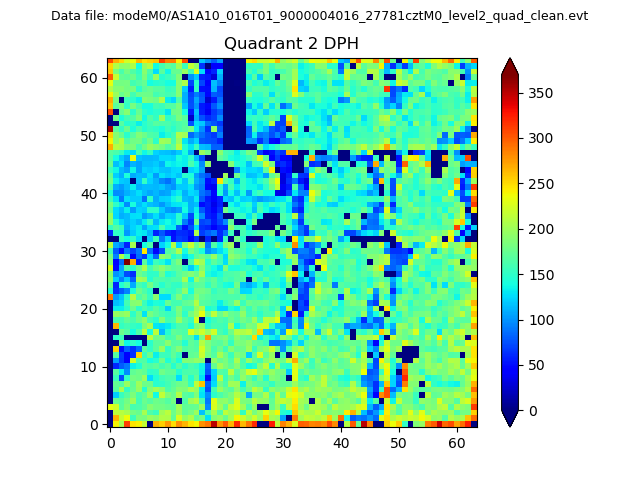
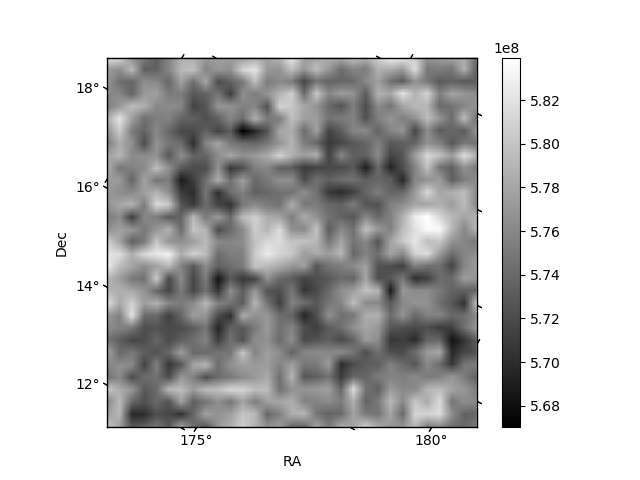
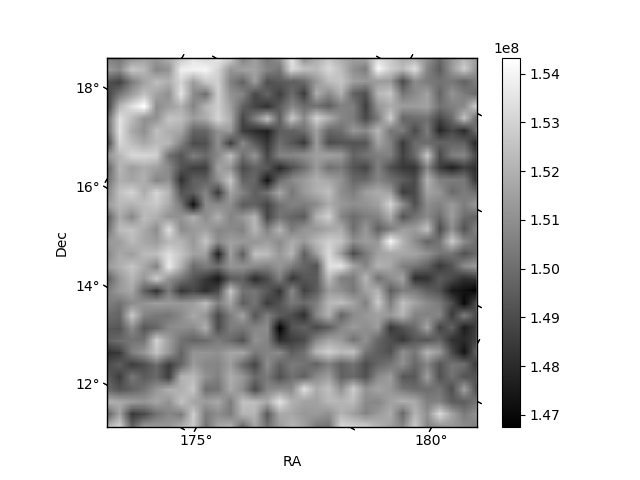
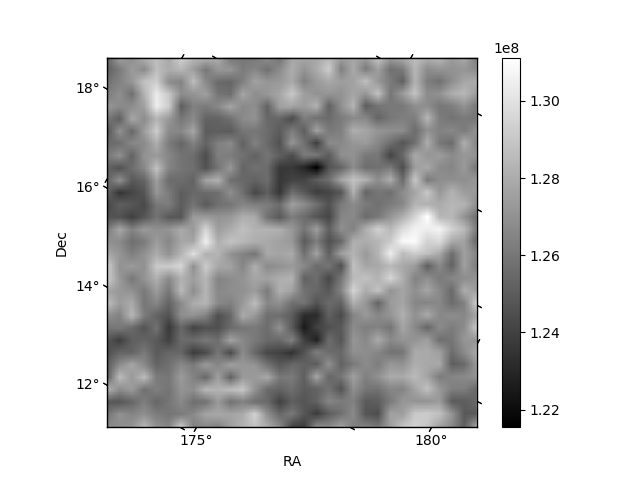
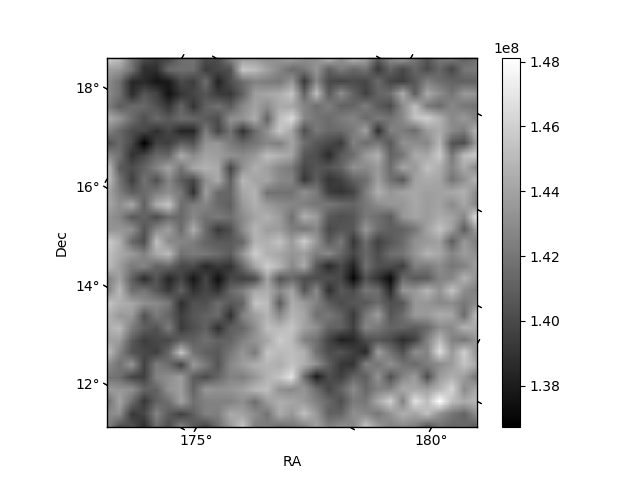
Histogram calculated using DETX and DETY for each event in the final _common_clean file
| Quadrant A | 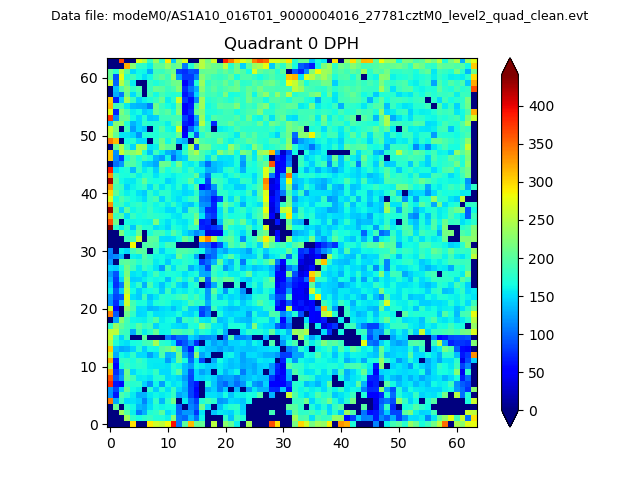 |
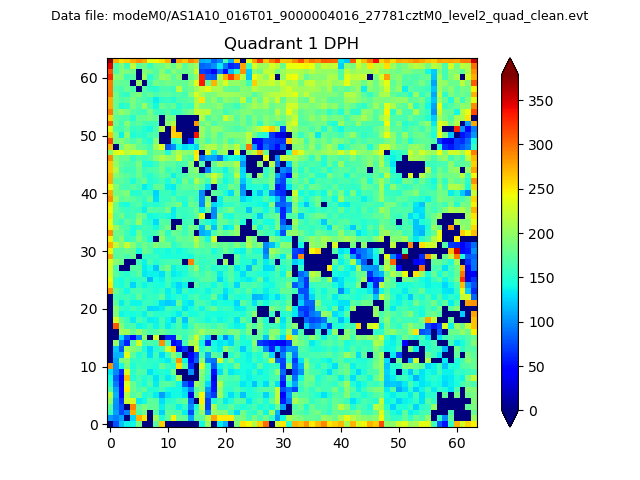 |
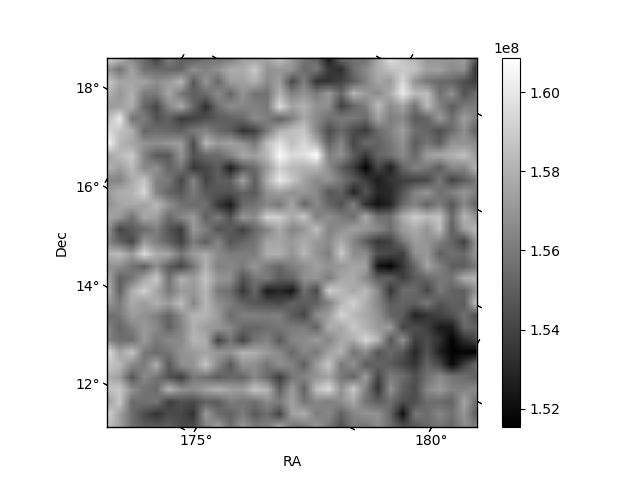
Quadrant B |
|---|---|---|---|
| Quadrant D | 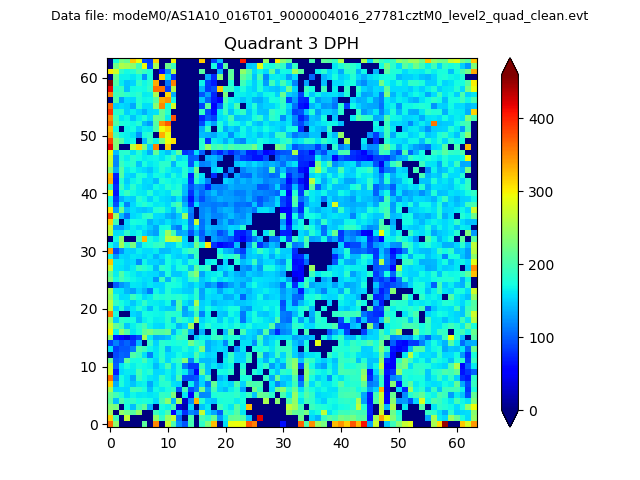 |
 |
Quadrant C |
| Plot type | Count rate plots | Images |
|---|---|---|
| Comparison with Poisson distribution Blue bars denote a histogram of data divided into 1 sec bins. Red curve is a Poisson curve with rate = median count rate of data. |
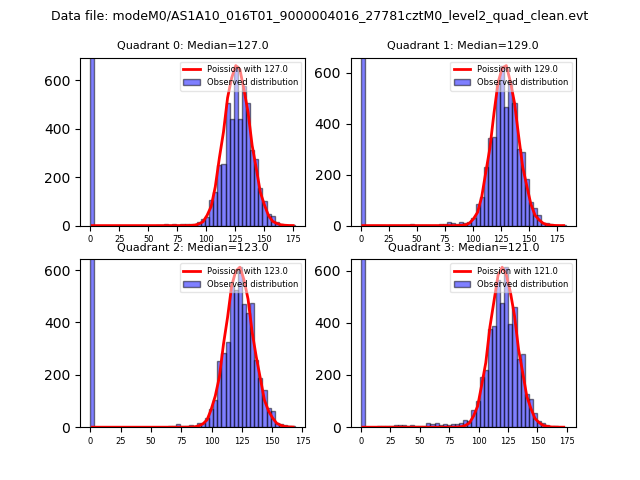 |
 |
| Quadrant-wise count rates Data is divided into 100 sec bins |
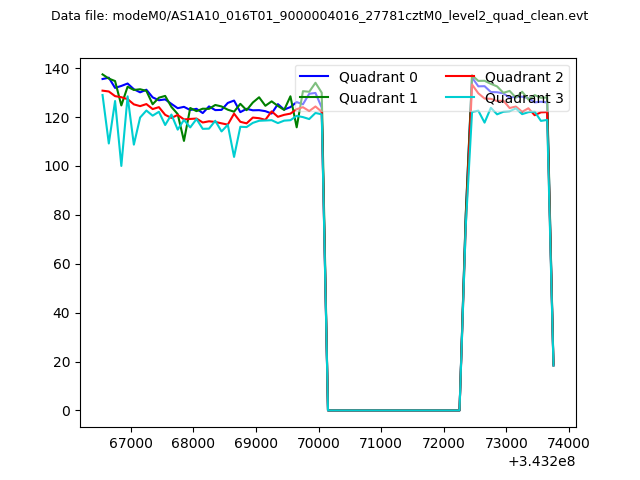 |
|
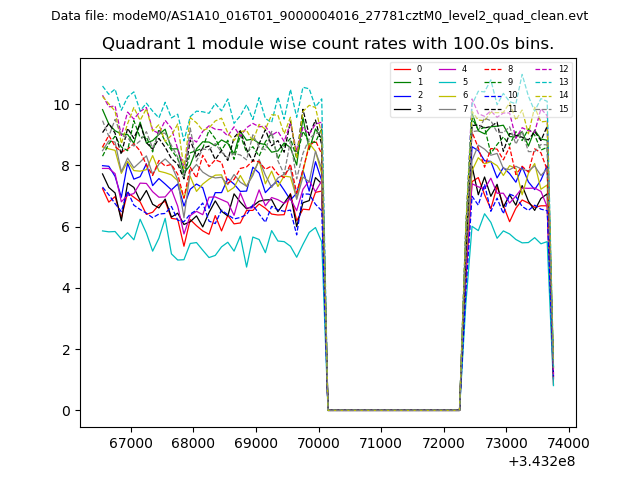
| Module-wise count rates for Quadrant A Data is divided into 100 sec bins |
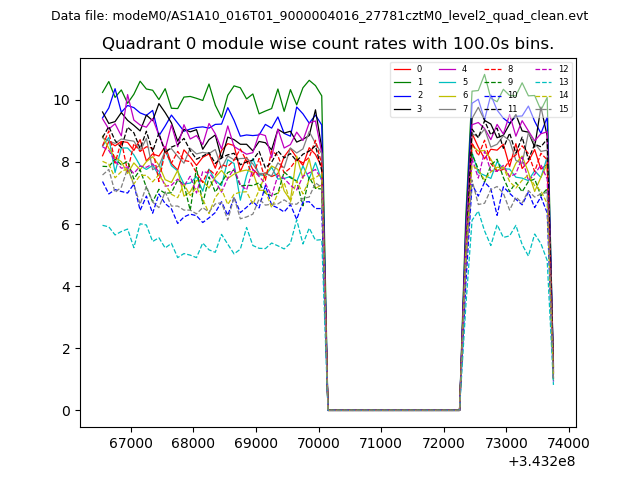 |
 |
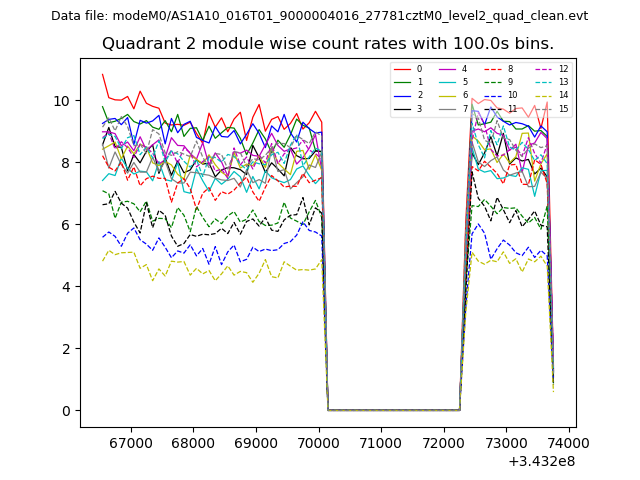
| Module-wise count rates for Quadrant B Data is divided into 100 sec bins |
 |
 |
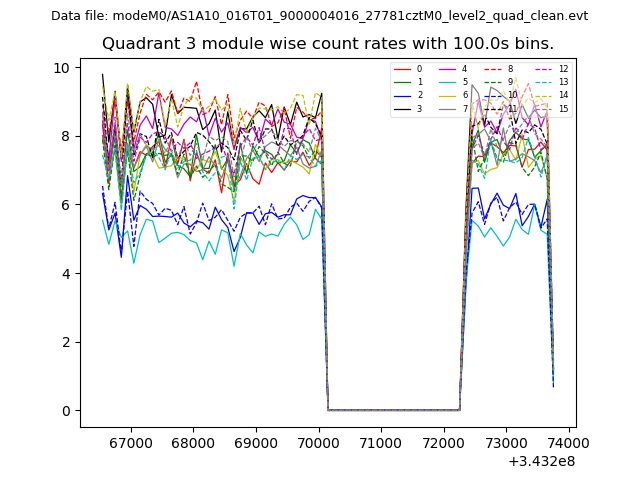
| Module-wise count rates for Quadrant C Data is divided into 100 sec bins |
 |
 |
| Module-wise count rates for Quadrant D Data is divided into 100 sec bins |
 |
 |
| Parameter | Plot |
|---|---|
| CZT HV Monitor | 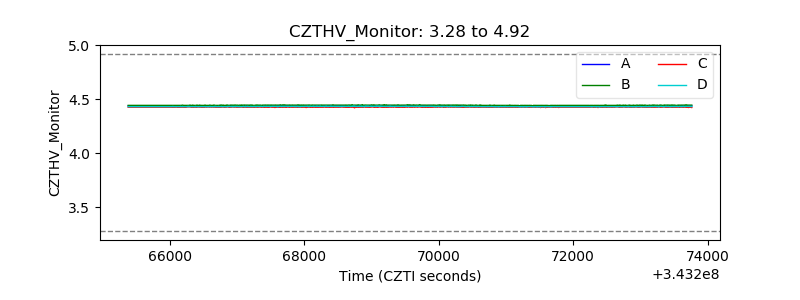 |
| D_VDD | 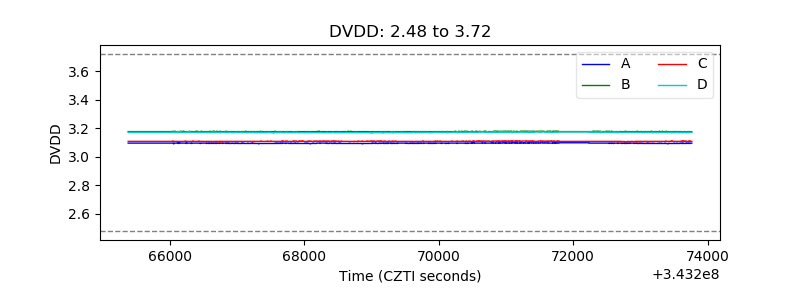 |
| Temperature 1 | 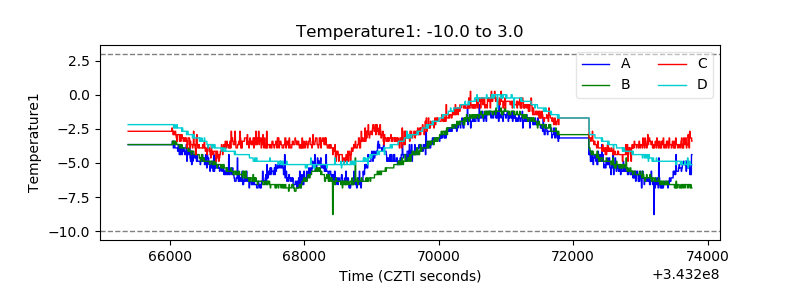 |
| Veto HV Monitor |  |
| Veto LLD |  |
| Alpha Counter | 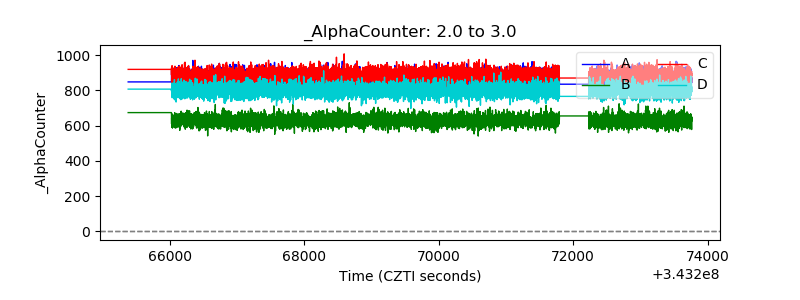 |
| _CPM_Rate | 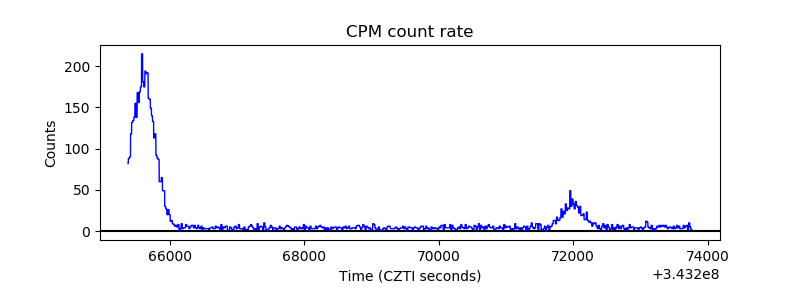 |
| CZT Counter | 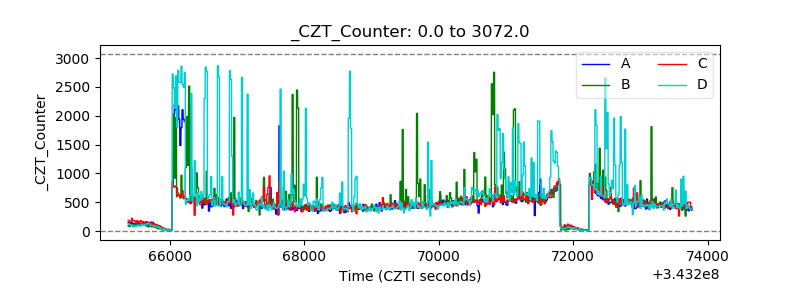 |
| +2.5 Volts monitor | 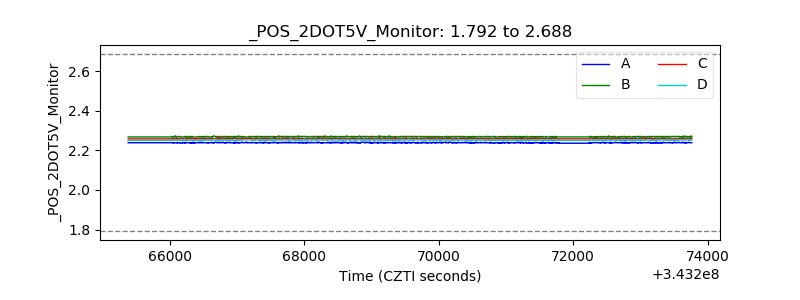 |
| +5 Volts monitor |  |
| _ROLL_ROT | 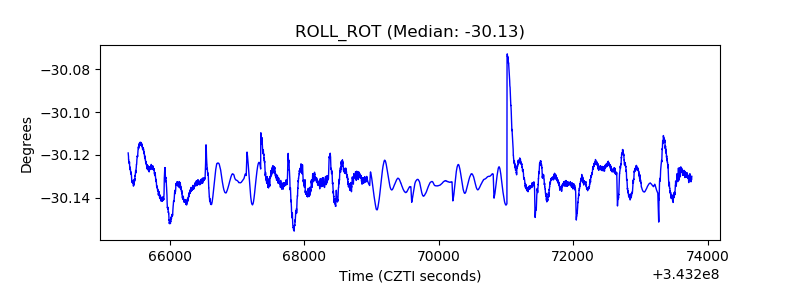 |
| _Roll_DEC | 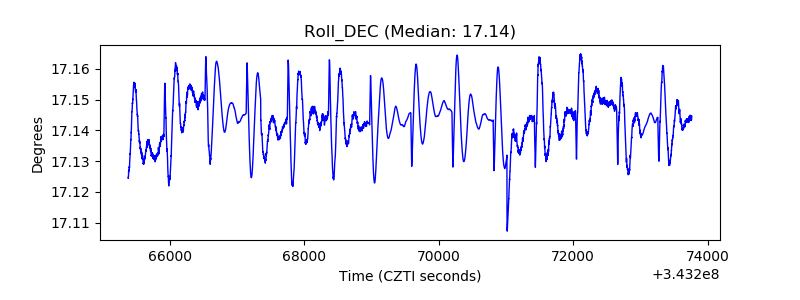 |
| _Roll_RA | 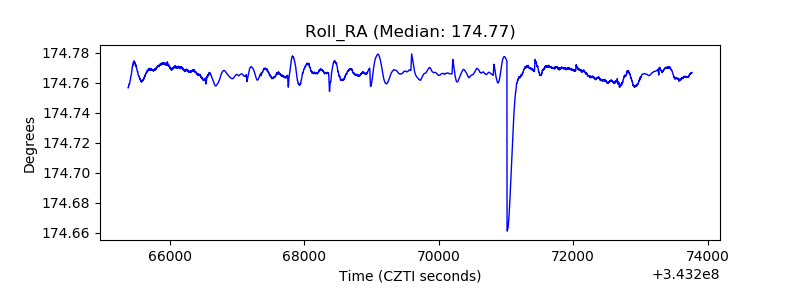 |
| Veto Counter | 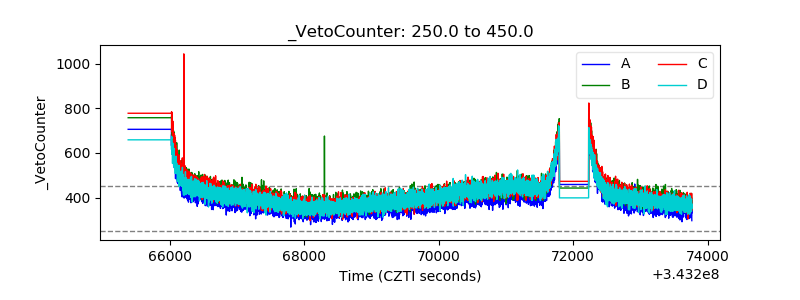 |