| Param | Original file | Final file |
|---|---|---|
| Filename | modeM0/AS1A10_016T01_9000004016_27782cztM0_level2.evt | modeM0/AS1A10_016T01_9000004016_27782cztM0_level2_quad_clean.evt |
| Size (bytes) | 553,144,320 | 106,853,760 |
| Size | 527.5 MB | 101.9 MB |
| Events in quadrant A | 3,784,590 | 685,365 |
| Events in quadrant B | 4,072,103 | 692,373 |
| Events in quadrant C | 3,834,987 | 662,056 |
| Events in quadrant D | 4,526,894 | 649,870 |
| Mode M9 | |||
|---|---|---|---|
| Quadrant | BADHDUFLAG | Total packets | Discarded packets |
| A | 0 | 6 | 0 |
| B | 0 | 6 | 0 |
| C | 0 | 6 | 0 |
| D | 0 | 6 | 0 |
| Mode M0 | |||
|---|---|---|---|
| Quadrant | BADHDUFLAG | Total packets | Discarded packets |
| A | 0 | 16523 | 0 |
| B | 0 | 17265 | 0 |
| C | 0 | 16591 | 0 |
| D | 0 | 19098 | 0 |
| Quadrant | Total seconds | Saturated seconds | Saturation percentage |
|---|---|---|---|
| A | 7856 | 121 | 1.540224% |
| B | 7856 | 210 | 2.673116% |
| C | 7856 | 214 | 2.724033% |
| D | 7856 | 196 | 2.494908% |
Noise dominated data is calculated using 1-second bins in cleaned event files. If a bin has >2000 counts, and if more than 50% of those come from <1% of pixels, then it is considered to be noise-dominated and hence unusable.
| Quadrant | # 1 sec bins | Bins with >0 counts | Bins with >2000 counts | High rate bins dominated by noise | Noise dominated (total time) | Noise dominated (detector-on time) | Marked lightcurve |
|---|---|---|---|---|---|---|---|
| A | 8506 | 7858 | 1 | 1 | 0.01% | 0.01% | 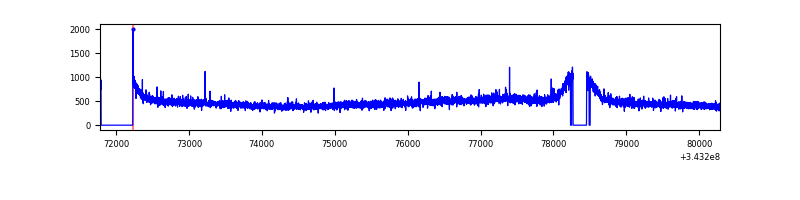 |
| B | 8506 | 7858 | 22 | 22 | 0.26% | 0.28% | 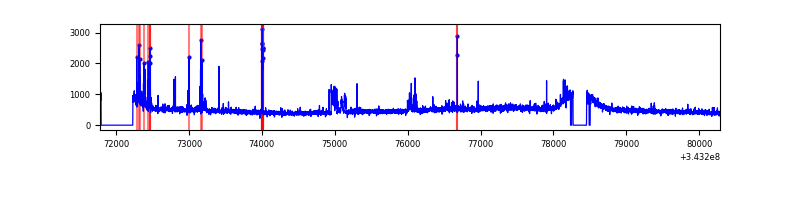 |
| C | 8506 | 7857 | 0 | 0 | 0.00% | 0.00% | 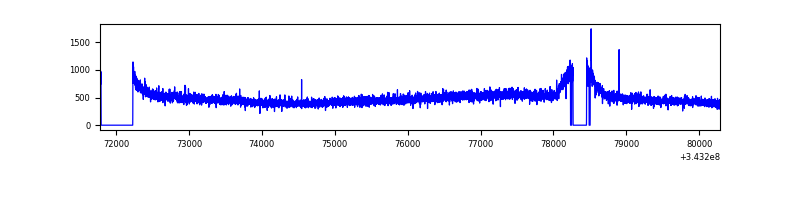 |
| D | 8506 | 7860 | 97 | 97 | 1.14% | 1.23% | 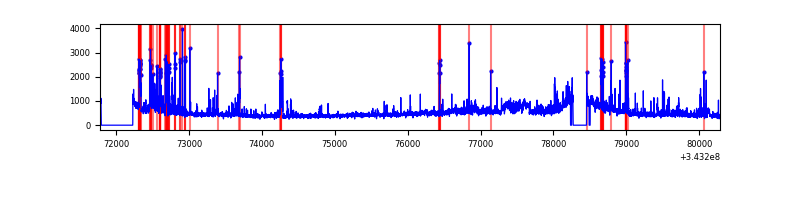 |
Top three noisy pixels from each quadrant. If the there are fewer than three noisy pixels in the level2.evt file, extra rows are filled as -1
| Pixel properties | Quadrant properties | ||||||
|---|---|---|---|---|---|---|---|
| Quadrant | DetID | PixID | Counts | Sigma | Mean | Median | Sigma |
| A | 13 | 254 | 12915 | 60.03 | 976 | 955 | 199.2 |
| A | 5 | 203 | 9942 | 45.11 | 976 | 955 | 199.2 |
| A | 3 | 137 | 9656 | 43.67 | 976 | 955 | 199.2 |
| B | 3 | 64 | 152068 | 793.12 | 971 | 945 | 190.5 |
| B | 0 | 190 | 39660 | 203.18 | 971 | 945 | 190.5 |
| B | 5 | 255 | 31873 | 162.31 | 971 | 945 | 190.5 |
| C | 14 | 238 | 148610 | 667.08 | 933 | 938 | 221.4 |
| C | 3 | 233 | 44660 | 197.51 | 933 | 938 | 221.4 |
| C | 4 | 175 | 8118 | 32.43 | 933 | 938 | 221.4 |
| D | 1 | 52 | 526067 | 2297.36 | 935 | 910 | 228.6 |
| D | 13 | 104 | 290104 | 1265.11 | 935 | 910 | 228.6 |
| D | 2 | 250 | 88082 | 381.34 | 935 | 910 | 228.6 |
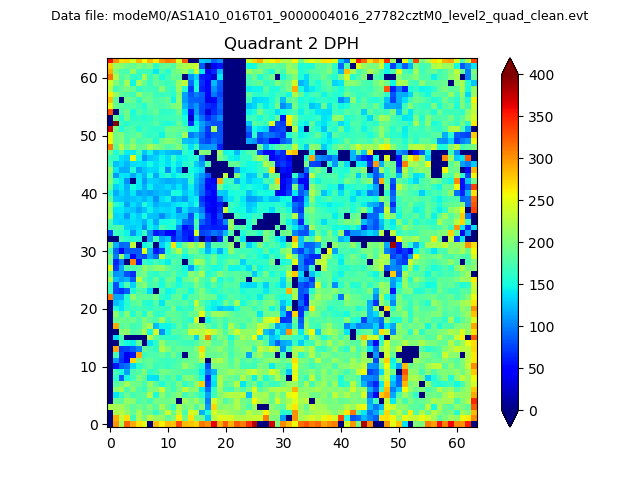
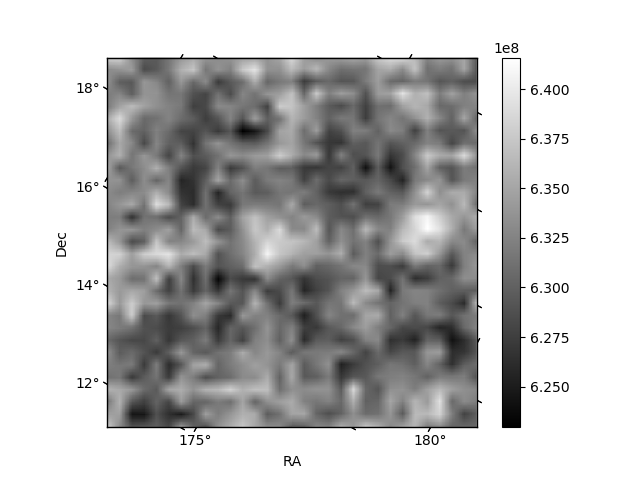
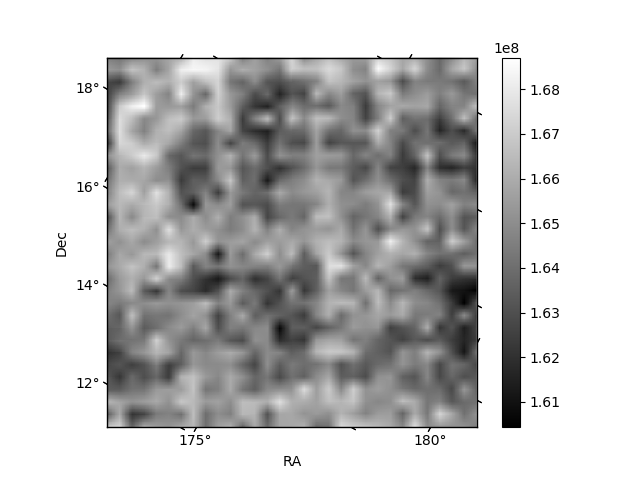
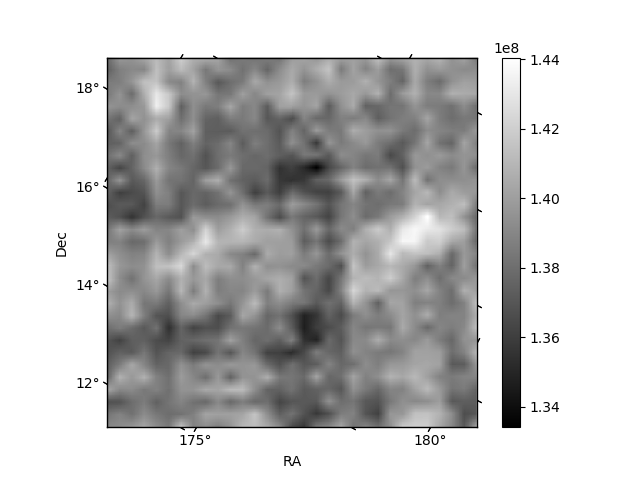
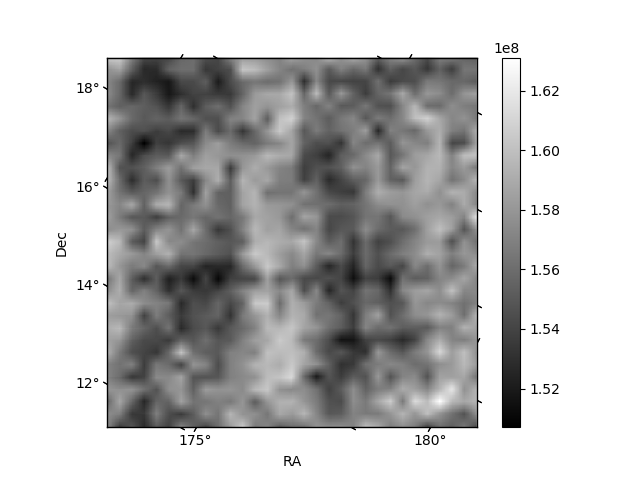
Histogram calculated using DETX and DETY for each event in the final _common_clean file
| Quadrant A | 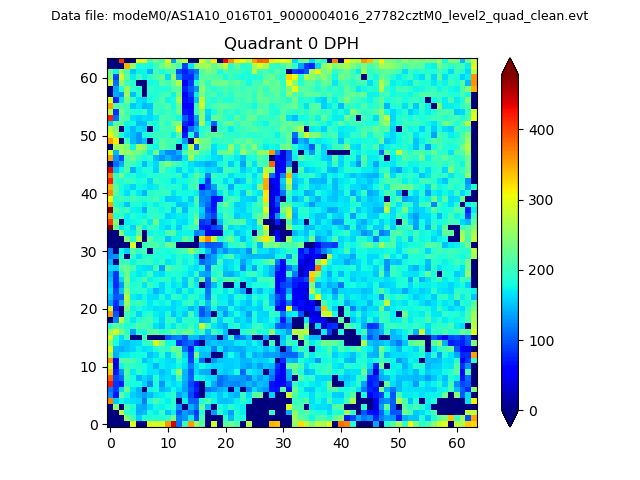 |
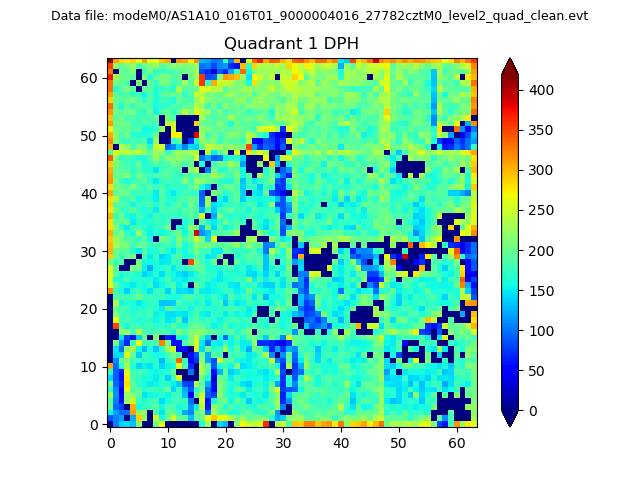 |
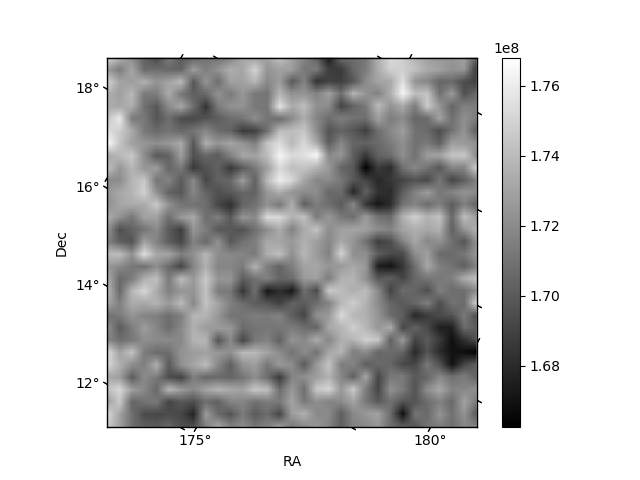
Quadrant B |
|---|---|---|---|
| Quadrant D | 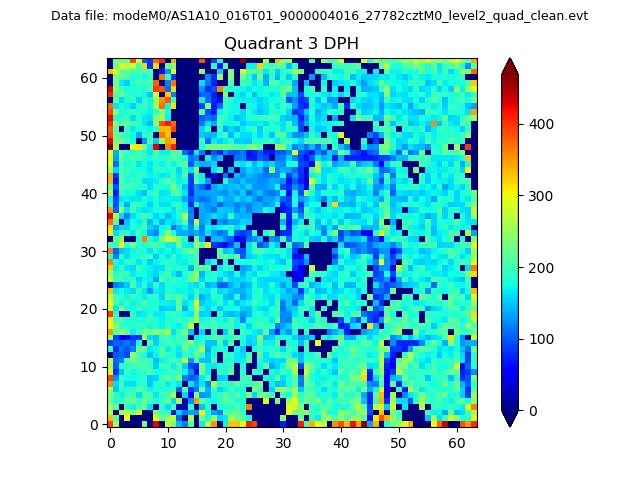 |
 |
Quadrant C |
| Plot type | Count rate plots | Images |
|---|---|---|
| Comparison with Poisson distribution Blue bars denote a histogram of data divided into 1 sec bins. Red curve is a Poisson curve with rate = median count rate of data. |
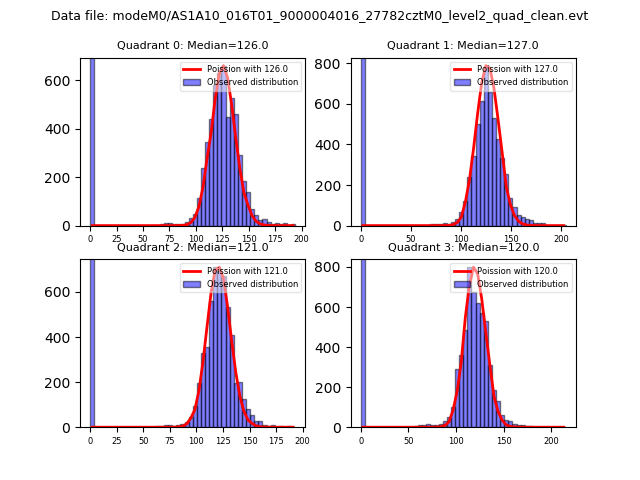 |
 |
| Quadrant-wise count rates Data is divided into 100 sec bins |
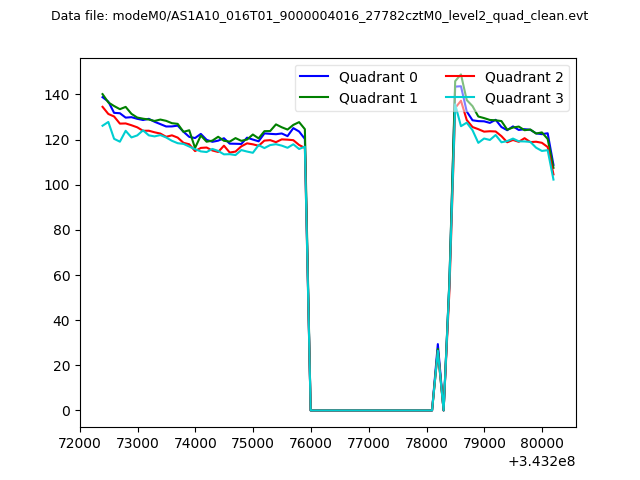 |
|
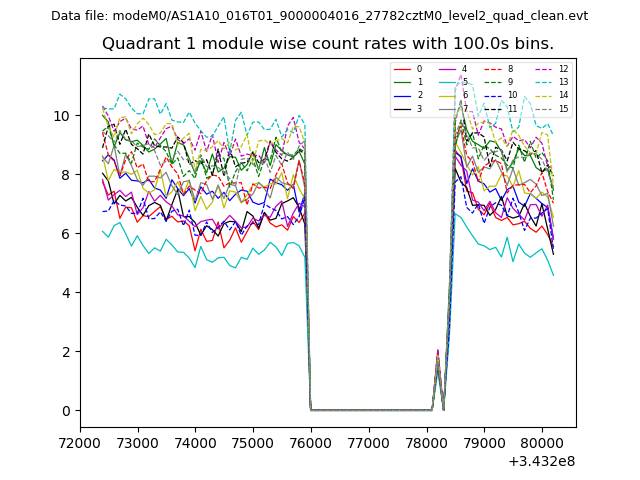
| Module-wise count rates for Quadrant A Data is divided into 100 sec bins |
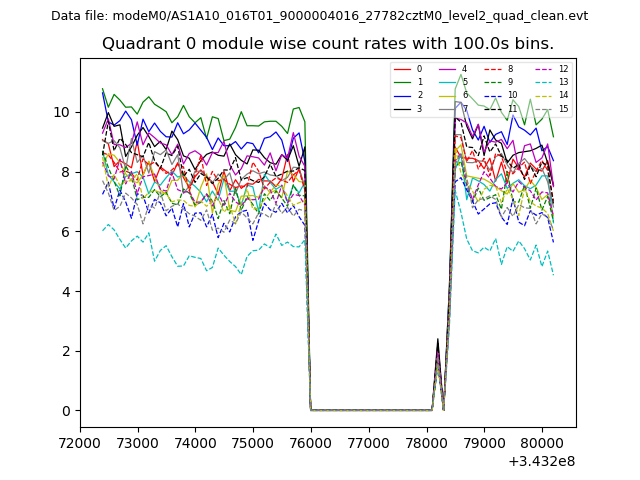 |
 |
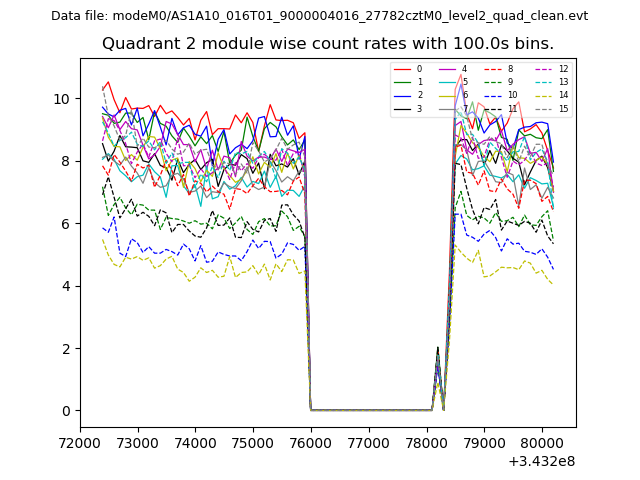
| Module-wise count rates for Quadrant B Data is divided into 100 sec bins |
 |
 |
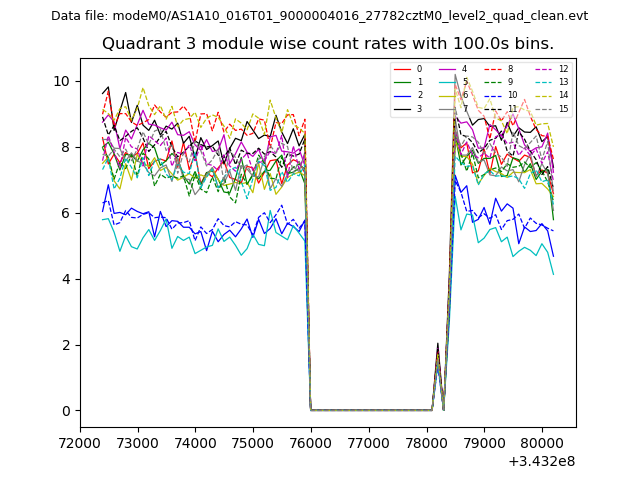
| Module-wise count rates for Quadrant C Data is divided into 100 sec bins |
 |
 |
| Module-wise count rates for Quadrant D Data is divided into 100 sec bins |
 |
 |
| Parameter | Plot |
|---|---|
| CZT HV Monitor | 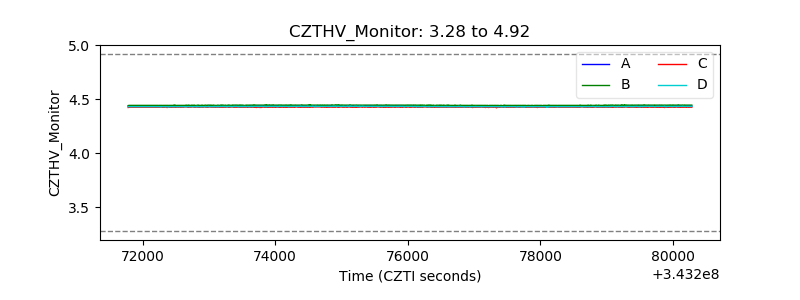 |
| D_VDD | 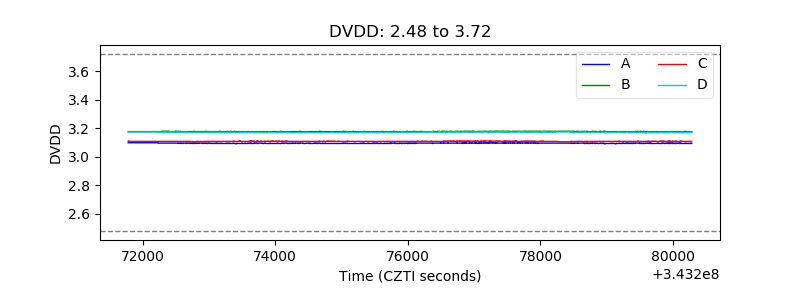 |
| Temperature 1 | 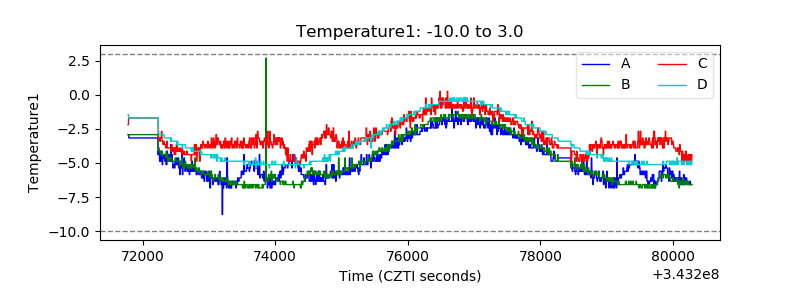 |
| Veto HV Monitor | 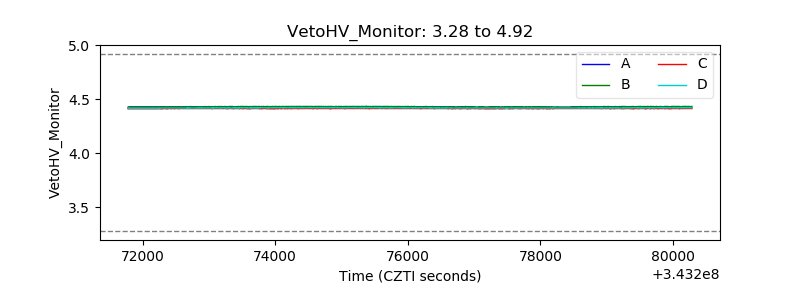 |
| Veto LLD | 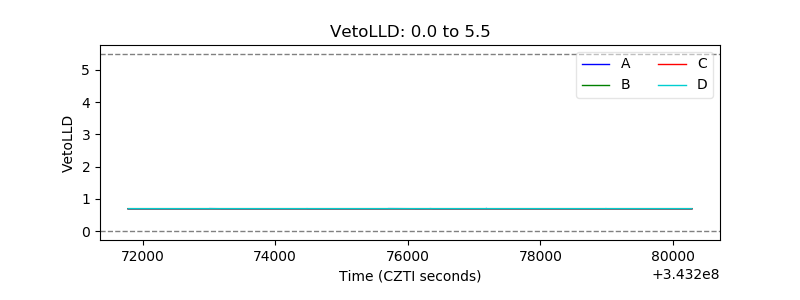 |
| Alpha Counter | 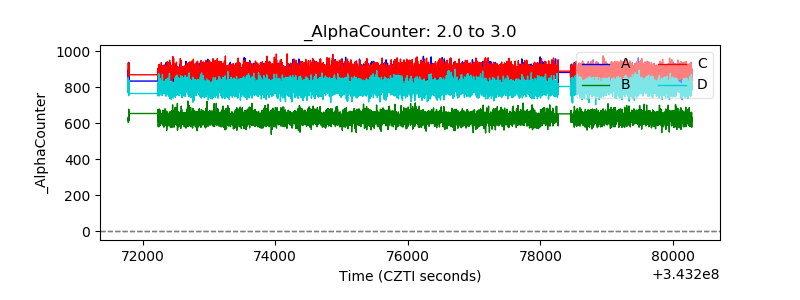 |
| _CPM_Rate | 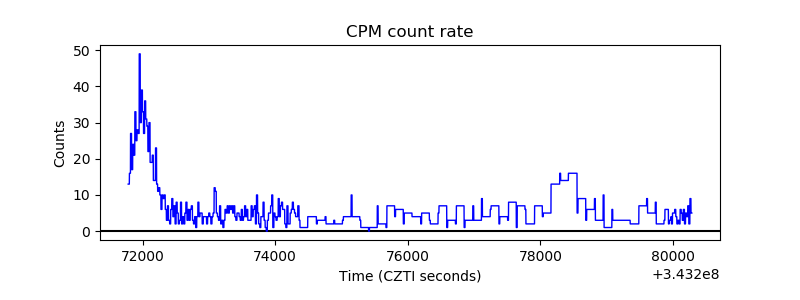 |
| CZT Counter | 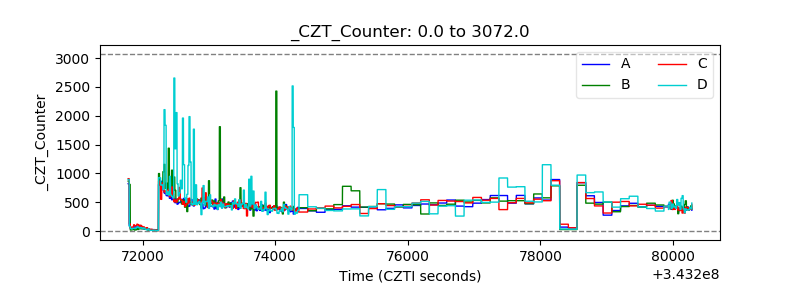 |
| +2.5 Volts monitor |  |
| +5 Volts monitor | 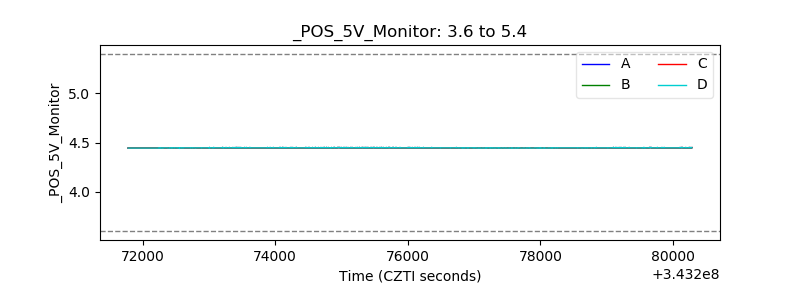 |
| _ROLL_ROT | 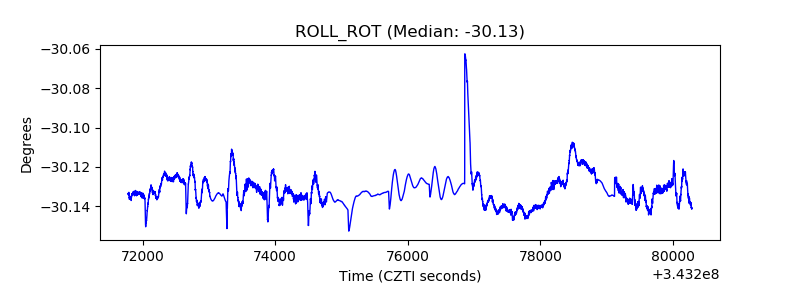 |
| _Roll_DEC |  |
| _Roll_RA | 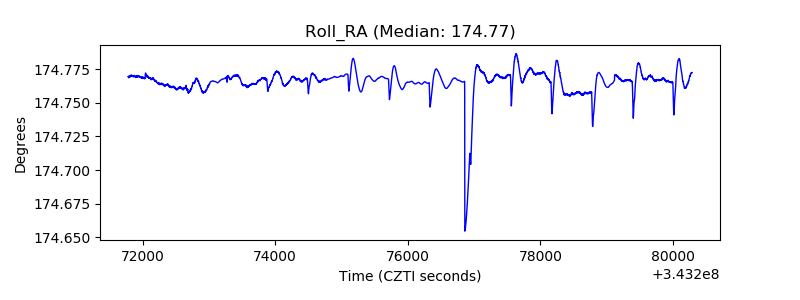 |
| Veto Counter | 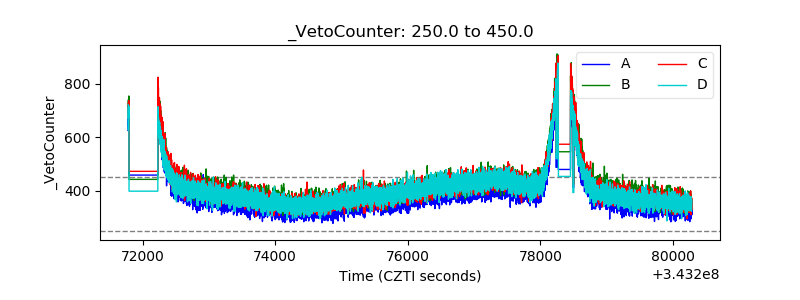 |