| Param | Original file | Final file |
|---|---|---|
| Filename | modeM0/AS1A10_016T01_9000004016_27783cztM0_level2.evt | modeM0/AS1A10_016T01_9000004016_27783cztM0_level2_quad_clean.evt |
| Size (bytes) | 484,591,680 | 87,871,680 |
| Size | 462.1 MB | 83.8 MB |
| Events in quadrant A | 3,155,565 | 561,493 |
| Events in quadrant B | 3,262,527 | 567,987 |
| Events in quadrant C | 3,226,536 | 541,273 |
| Events in quadrant D | 4,574,517 | 521,282 |
| Mode M9 | |||
|---|---|---|---|
| Quadrant | BADHDUFLAG | Total packets | Discarded packets |
| A | 0 | 4 | 0 |
| B | 0 | 4 | 0 |
| C | 0 | 4 | 0 |
| D | 0 | 4 | 0 |
| Mode M0 | |||
|---|---|---|---|
| Quadrant | BADHDUFLAG | Total packets | Discarded packets |
| A | 0 | 13872 | 0 |
| B | 0 | 14081 | 0 |
| C | 0 | 13968 | 0 |
| D | 0 | 18397 | 0 |
| Quadrant | Total seconds | Saturated seconds | Saturation percentage |
|---|---|---|---|
| A | 6727 | 54 | 0.802735% |
| B | 6727 | 85 | 1.263565% |
| C | 6726 | 103 | 1.531371% |
| D | 6727 | 258 | 3.835291% |
Noise dominated data is calculated using 1-second bins in cleaned event files. If a bin has >2000 counts, and if more than 50% of those come from <1% of pixels, then it is considered to be noise-dominated and hence unusable.
| Quadrant | # 1 sec bins | Bins with >0 counts | Bins with >2000 counts | High rate bins dominated by noise | Noise dominated (total time) | Noise dominated (detector-on time) | Marked lightcurve |
|---|---|---|---|---|---|---|---|
| A | 7107 | 6728 | 0 | 0 | 0.00% | 0.00% | 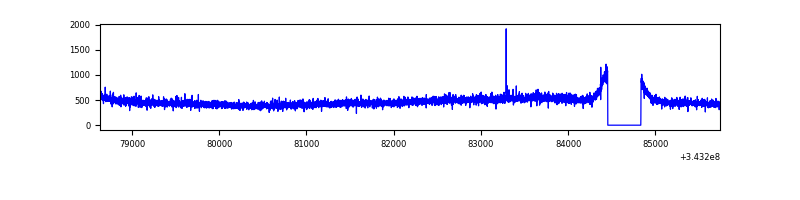 |
| B | 7107 | 6727 | 1 | 1 | 0.01% | 0.01% | 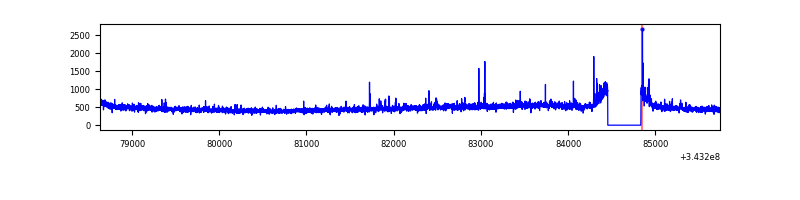 |
| C | 7106 | 6726 | 0 | 0 | 0.00% | 0.00% | 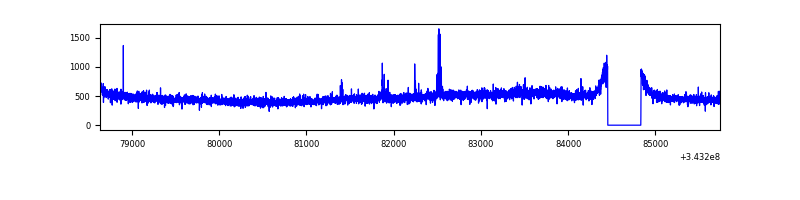 |
| D | 7107 | 6727 | 187 | 187 | 2.63% | 2.78% | 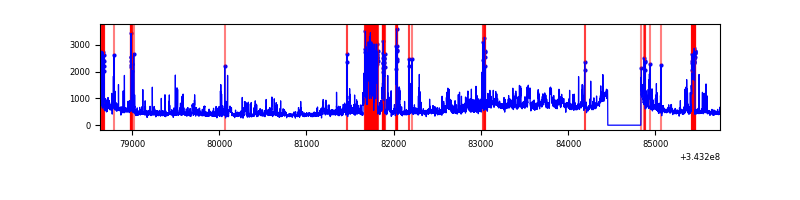 |
Top three noisy pixels from each quadrant. If the there are fewer than three noisy pixels in the level2.evt file, extra rows are filled as -1
| Pixel properties | Quadrant properties | ||||||
|---|---|---|---|---|---|---|---|
| Quadrant | DetID | PixID | Counts | Sigma | Mean | Median | Sigma |
| A | 13 | 254 | 10518 | 58.24 | 816 | 797 | 166.9 |
| A | 3 | 137 | 8010 | 43.21 | 816 | 797 | 166.9 |
| A | 0 | 226 | 7007 | 37.2 | 816 | 797 | 166.9 |
| B | 4 | 52 | 28822 | 175.29 | 813 | 790 | 159.9 |
| B | 12 | 111 | 19670 | 118.06 | 813 | 790 | 159.9 |
| B | 11 | 111 | 17684 | 105.64 | 813 | 790 | 159.9 |
| C | 14 | 238 | 124819 | 667.17 | 780 | 786 | 185.9 |
| C | 3 | 233 | 62128 | 329.96 | 780 | 786 | 185.9 |
| C | 13 | 61 | 5163 | 23.54 | 780 | 786 | 185.9 |
| D | 1 | 52 | 436961 | 2298.46 | 775 | 751 | 189.8 |
| D | 7 | 223 | 392612 | 2064.78 | 775 | 751 | 189.8 |
| D | 7 | 69 | 376764 | 1981.27 | 775 | 751 | 189.8 |
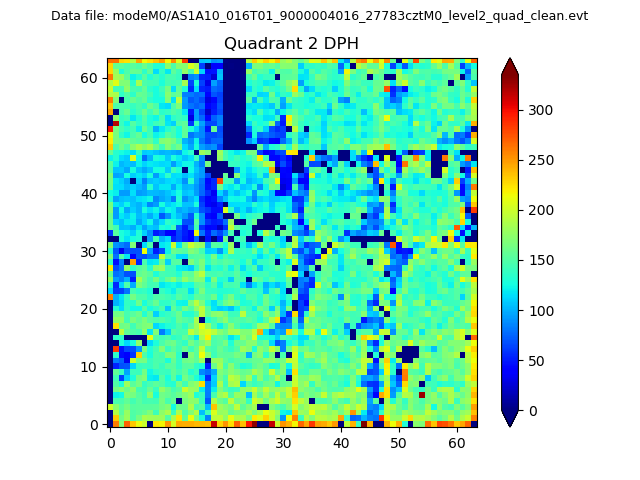
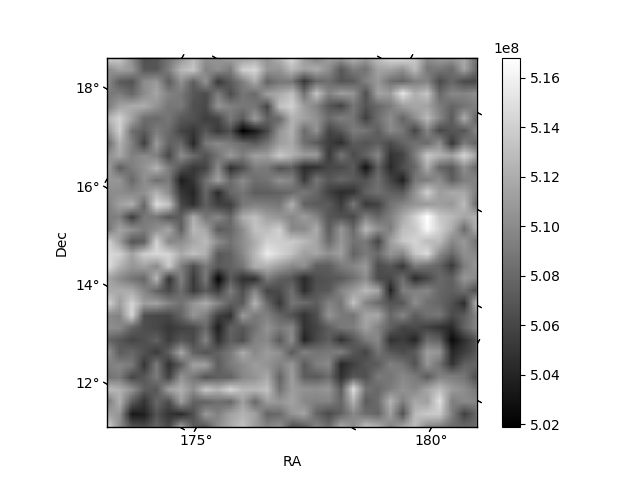
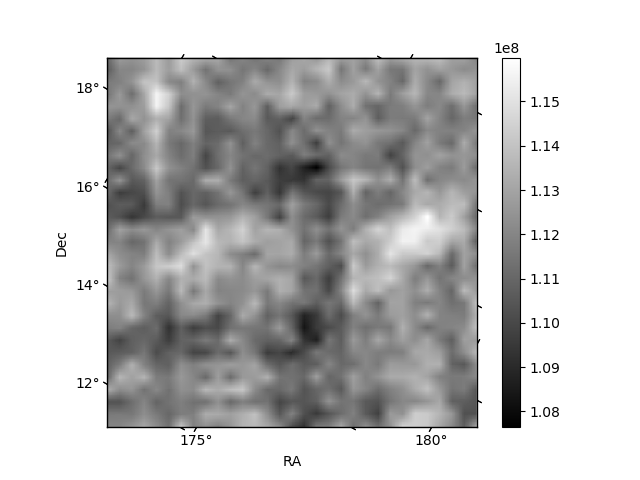
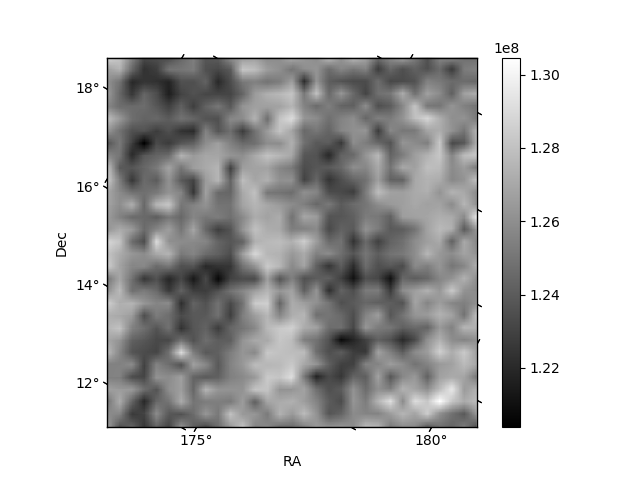
Histogram calculated using DETX and DETY for each event in the final _common_clean file
| Quadrant A | 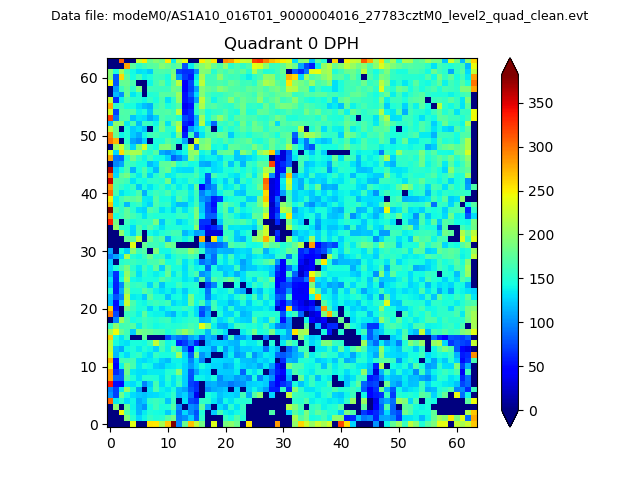 |
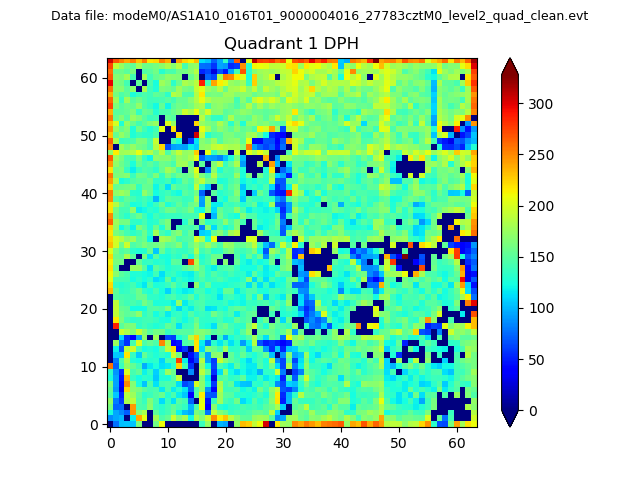 |
Quadrant B |
|---|---|---|---|
| Quadrant D | 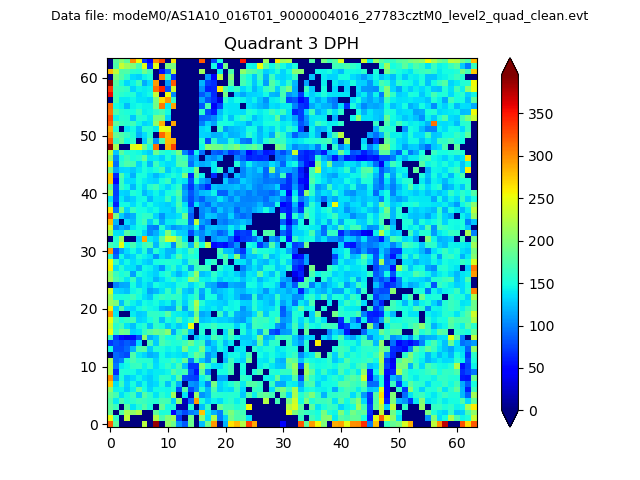 |
 |
Quadrant C |
| Plot type | Count rate plots | Images |
|---|---|---|
| Comparison with Poisson distribution Blue bars denote a histogram of data divided into 1 sec bins. Red curve is a Poisson curve with rate = median count rate of data. |
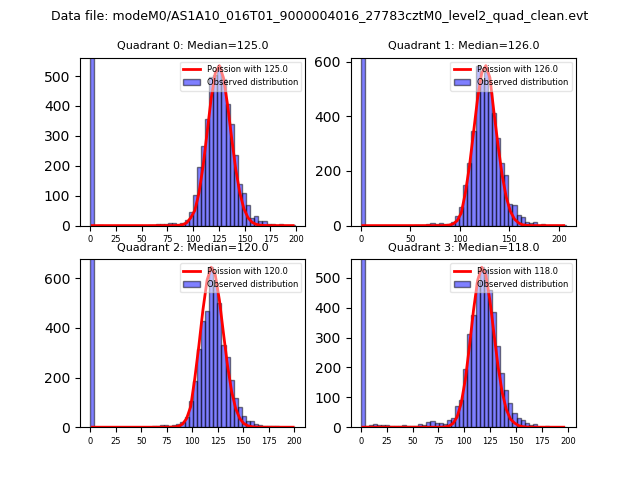 |
 |
| Quadrant-wise count rates Data is divided into 100 sec bins |
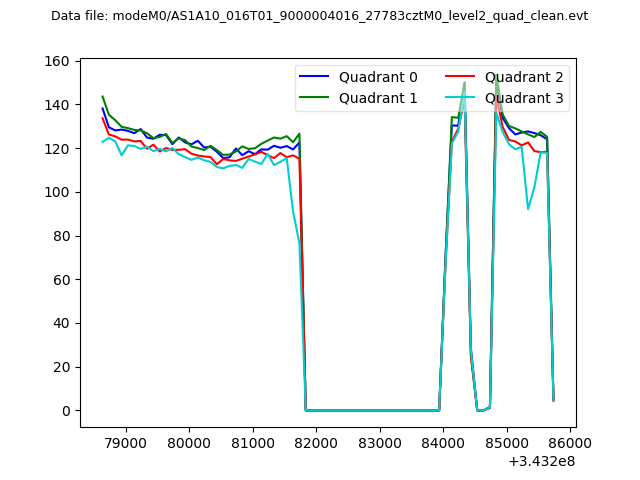 |
|
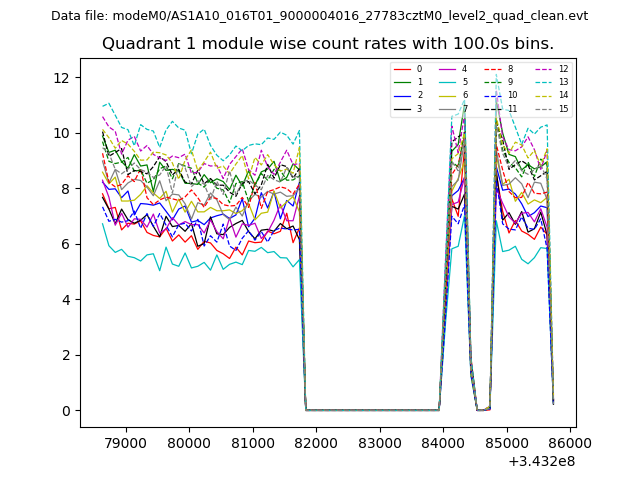
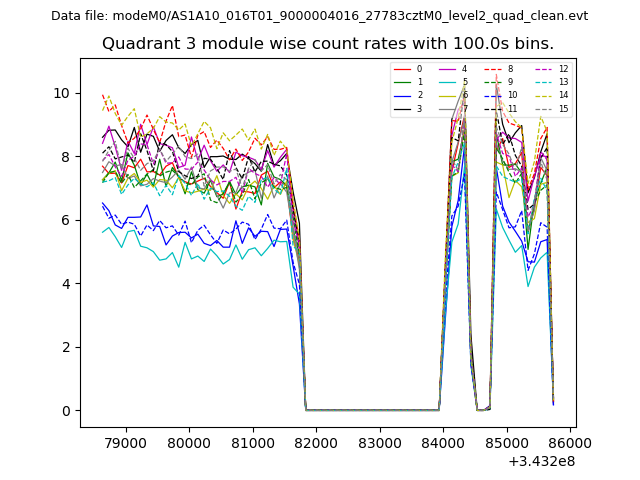
| Module-wise count rates for Quadrant A Data is divided into 100 sec bins |
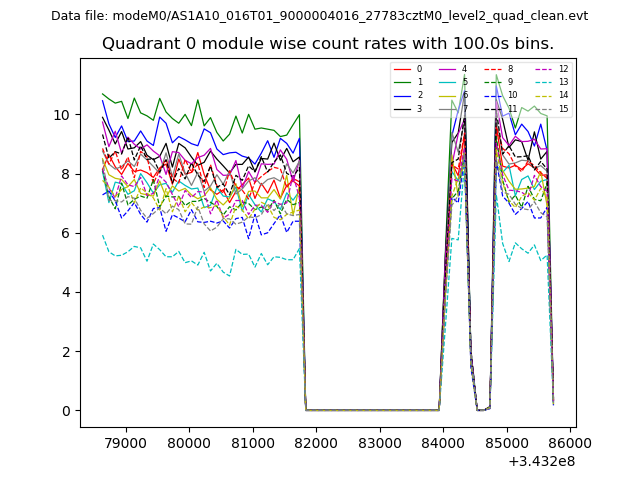 |
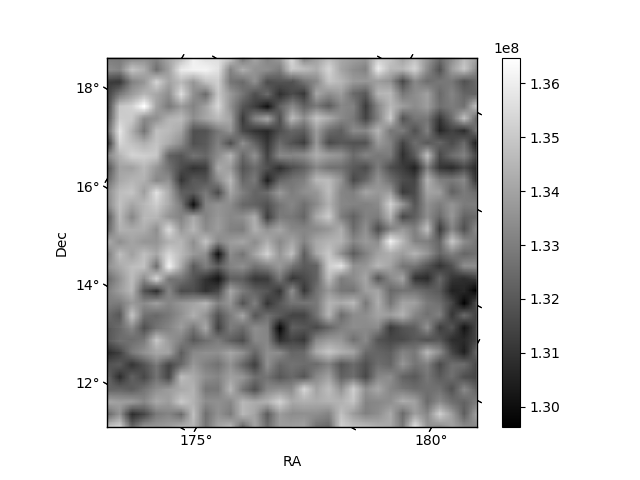 |
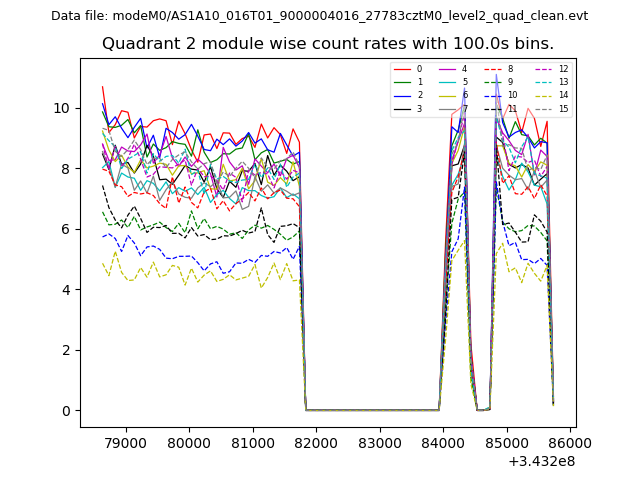
| Module-wise count rates for Quadrant B Data is divided into 100 sec bins |
 |
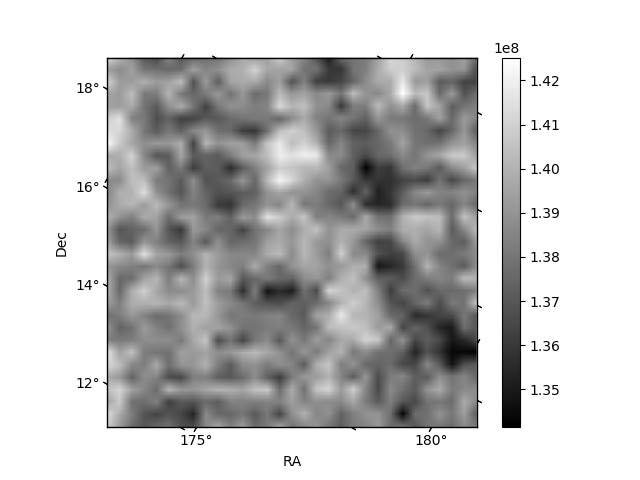 |
| Module-wise count rates for Quadrant C Data is divided into 100 sec bins |
 |
 |
| Module-wise count rates for Quadrant D Data is divided into 100 sec bins |
 |
 |
| Parameter | Plot |
|---|---|
| CZT HV Monitor | 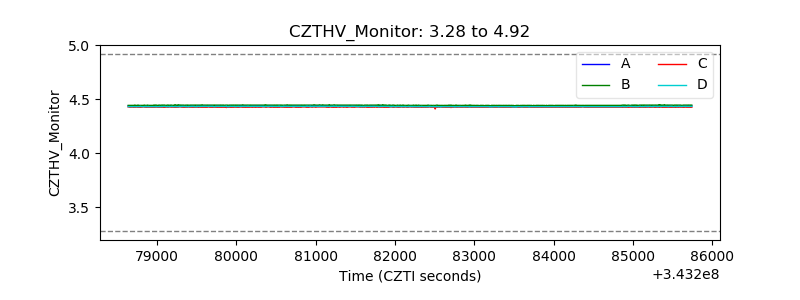 |
| D_VDD | 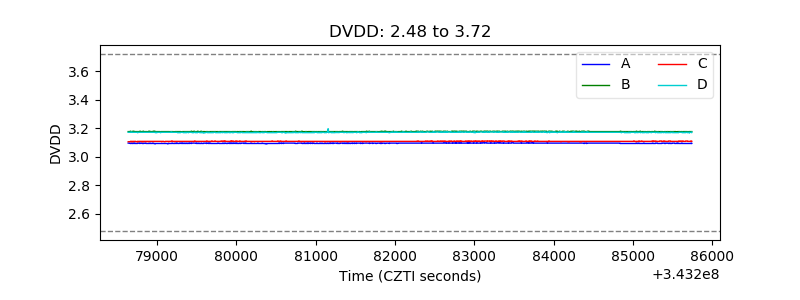 |
| Temperature 1 |  |
| Veto HV Monitor | 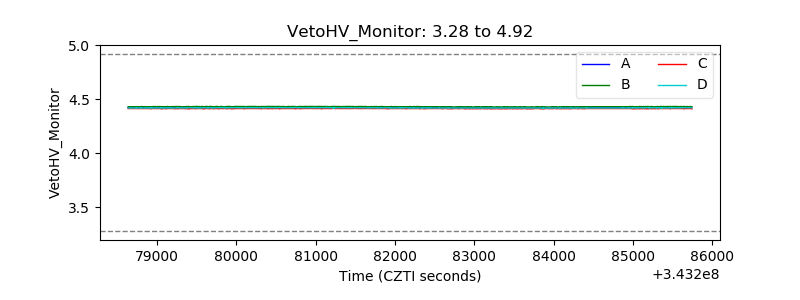 |
| Veto LLD | 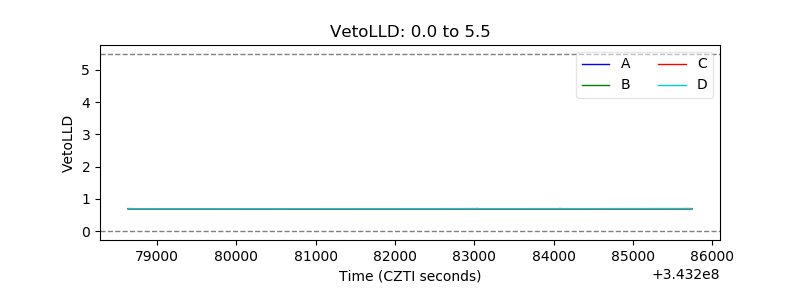 |
| Alpha Counter | 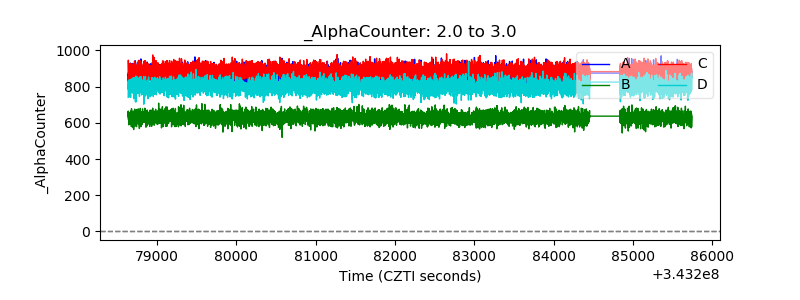 |
| _CPM_Rate | 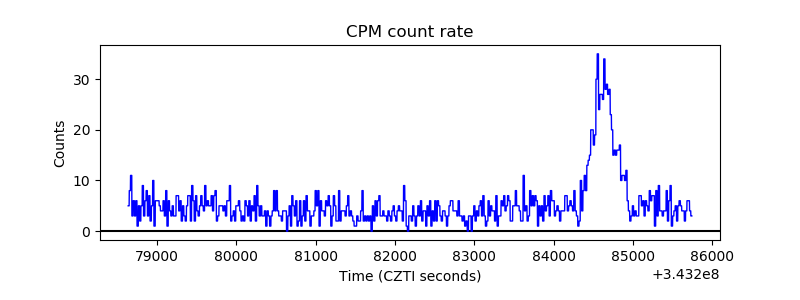 |
| CZT Counter | 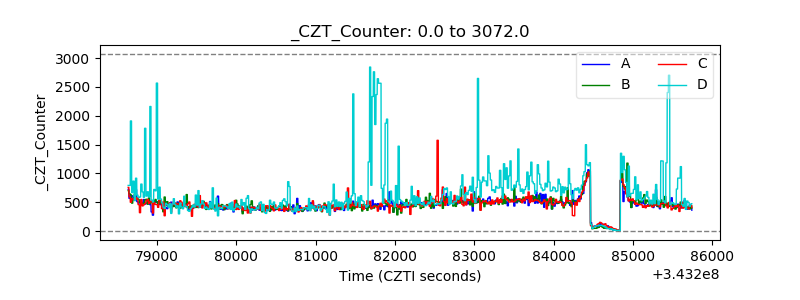 |
| +2.5 Volts monitor |  |
| +5 Volts monitor |  |
| _ROLL_ROT | 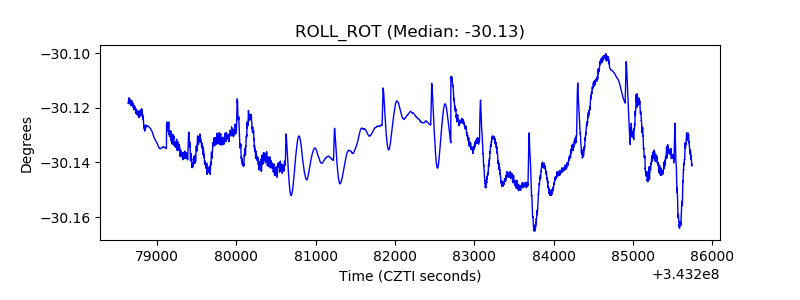 |
| _Roll_DEC | 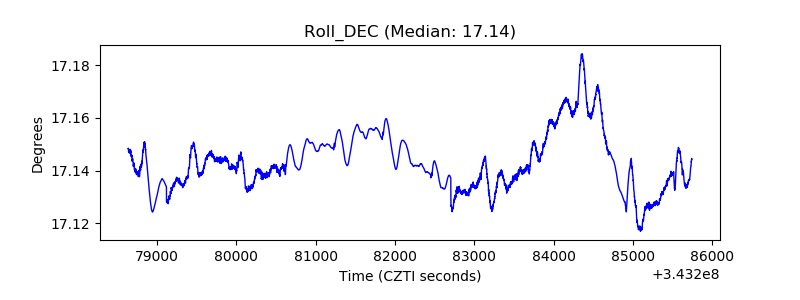 |
| _Roll_RA | 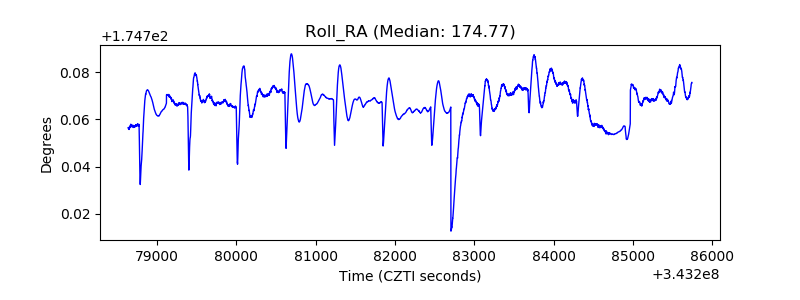 |
| Veto Counter | 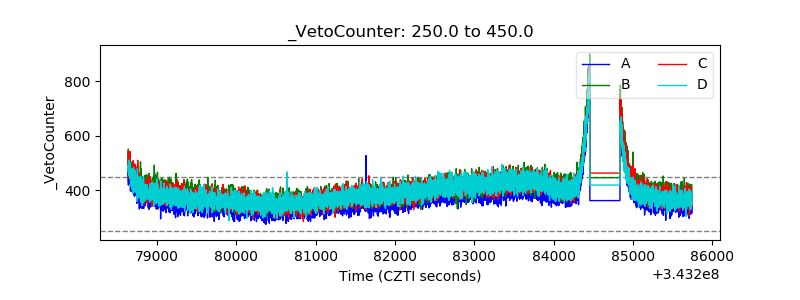 |