| Param | Original file | Final file |
|---|---|---|
| Filename | modeM0/AS1A10_016T01_9000004016_27785cztM0_level2.evt | modeM0/AS1A10_016T01_9000004016_27785cztM0_level2_quad_clean.evt |
| Size (bytes) | 777,479,040 | 129,343,680 |
| Size | 741.5 MB | 123.4 MB |
| Events in quadrant A | 5,105,912 | 806,736 |
| Events in quadrant B | 5,959,645 | 809,683 |
| Events in quadrant C | 5,200,420 | 780,032 |
| Events in quadrant D | 6,537,514 | 761,861 |
| Mode M9 | |||
|---|---|---|---|
| Quadrant | BADHDUFLAG | Total packets | Discarded packets |
| A | 0 | 9 | 0 |
| B | 0 | 9 | 0 |
| C | 0 | 9 | 0 |
| D | 0 | 9 | 0 |
| Mode M0 | |||
|---|---|---|---|
| Quadrant | BADHDUFLAG | Total packets | Discarded packets |
| A | 0 | 22380 | 0 |
| B | 0 | 24898 | 0 |
| C | 0 | 22505 | 0 |
| D | 0 | 26967 | 0 |
| Quadrant | Total seconds | Saturated seconds | Saturation percentage |
|---|---|---|---|
| A | 10965 | 91 | 0.829913% |
| B | 10966 | 274 | 2.498632% |
| C | 10966 | 166 | 1.513770% |
| D | 10966 | 165 | 1.504651% |
Noise dominated data is calculated using 1-second bins in cleaned event files. If a bin has >2000 counts, and if more than 50% of those come from <1% of pixels, then it is considered to be noise-dominated and hence unusable.
| Quadrant | # 1 sec bins | Bins with >0 counts | Bins with >2000 counts | High rate bins dominated by noise | Noise dominated (total time) | Noise dominated (detector-on time) | Marked lightcurve |
|---|---|---|---|---|---|---|---|
| A | 11489 | 10964 | 0 | 0 | 0.00% | 0.00% | 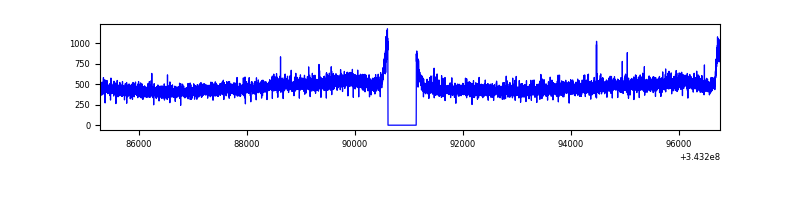 |
| B | 11490 | 10965 | 89 | 89 | 0.77% | 0.81% | 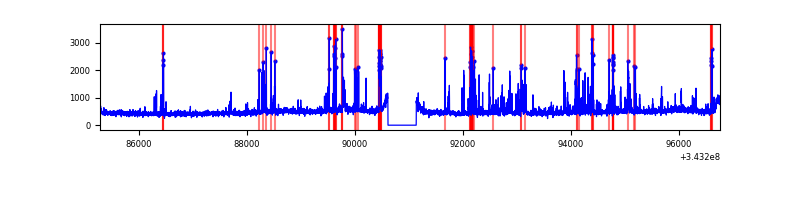 |
| C | 11490 | 10965 | 0 | 0 | 0.00% | 0.00% | 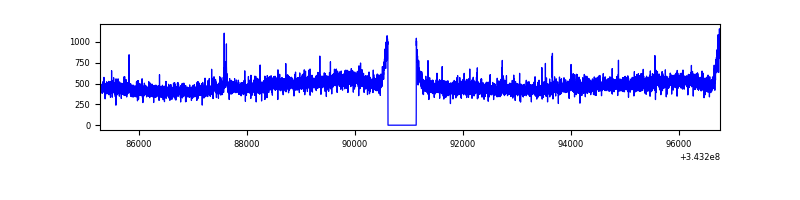 |
| D | 11490 | 10965 | 62 | 62 | 0.54% | 0.57% | 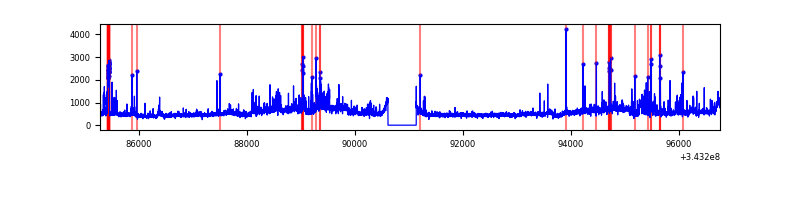 |
Top three noisy pixels from each quadrant. If the there are fewer than three noisy pixels in the level2.evt file, extra rows are filled as -1
| Pixel properties | Quadrant properties | ||||||
|---|---|---|---|---|---|---|---|
| Quadrant | DetID | PixID | Counts | Sigma | Mean | Median | Sigma |
| A | 13 | 254 | 18957 | 66.02 | 1321 | 1292 | 267.6 |
| A | 3 | 137 | 12642 | 42.42 | 1321 | 1292 | 267.6 |
| A | 0 | 226 | 11251 | 37.22 | 1321 | 1292 | 267.6 |
| B | 3 | 64 | 592123 | 2376.53 | 1300 | 1269 | 248.6 |
| B | 10 | 245 | 195007 | 779.25 | 1300 | 1269 | 248.6 |
| B | 4 | 52 | 39932 | 155.51 | 1300 | 1269 | 248.6 |
| C | 14 | 238 | 200875 | 668.23 | 1261 | 1268 | 298.7 |
| C | 3 | 233 | 85838 | 283.12 | 1261 | 1268 | 298.7 |
| C | 13 | 61 | 8568 | 24.44 | 1261 | 1268 | 298.7 |
| D | 7 | 223 | 856060 | 2796.53 | 1270 | 1235 | 305.7 |
| D | 1 | 52 | 564088 | 1841.36 | 1270 | 1235 | 305.7 |
| D | 2 | 250 | 111283 | 360.02 | 1270 | 1235 | 305.7 |
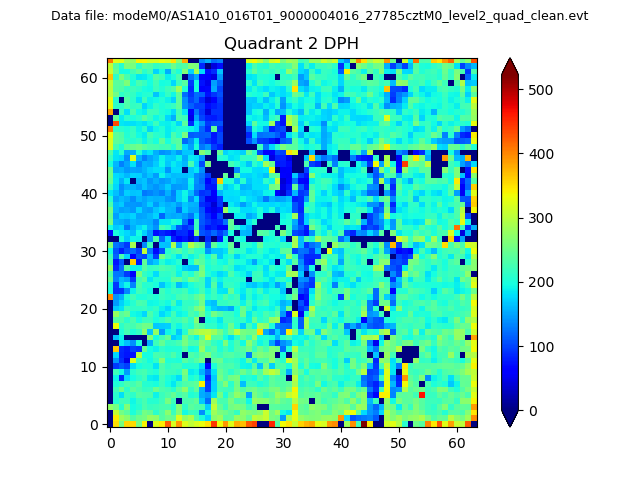
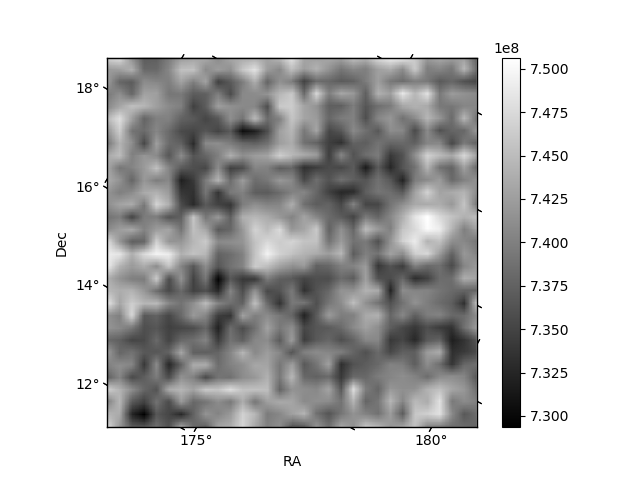
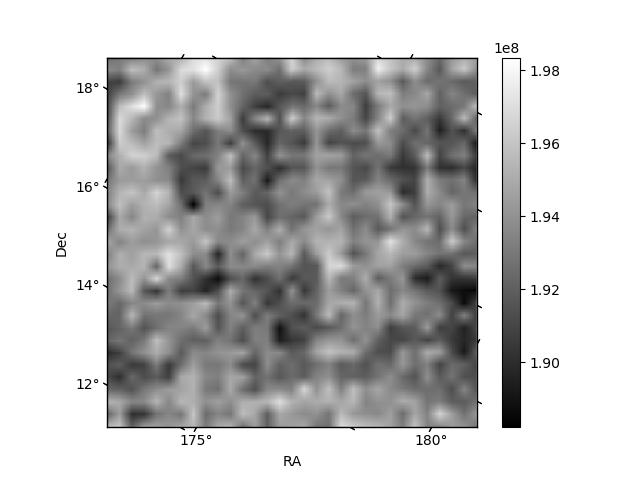
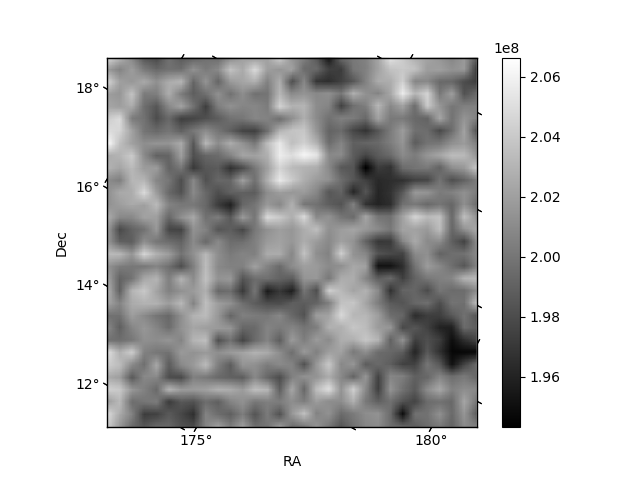
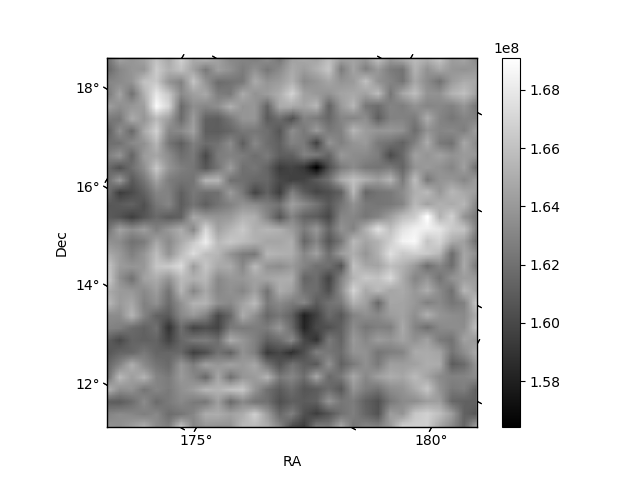
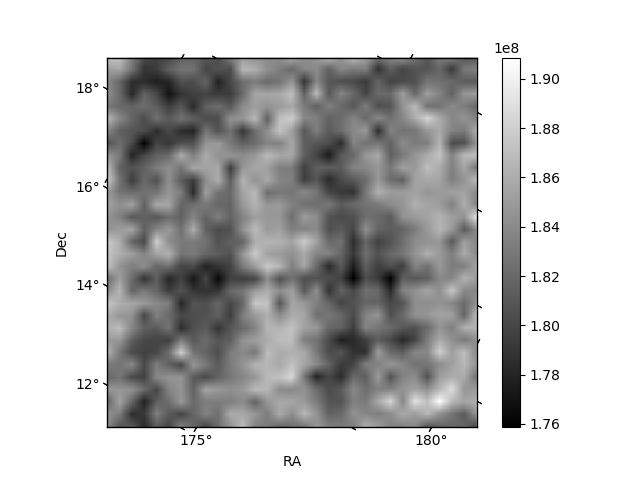
Histogram calculated using DETX and DETY for each event in the final _common_clean file
| Quadrant A | 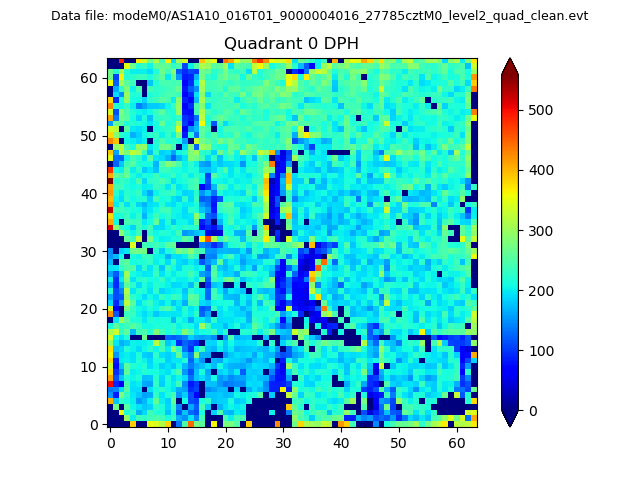 |
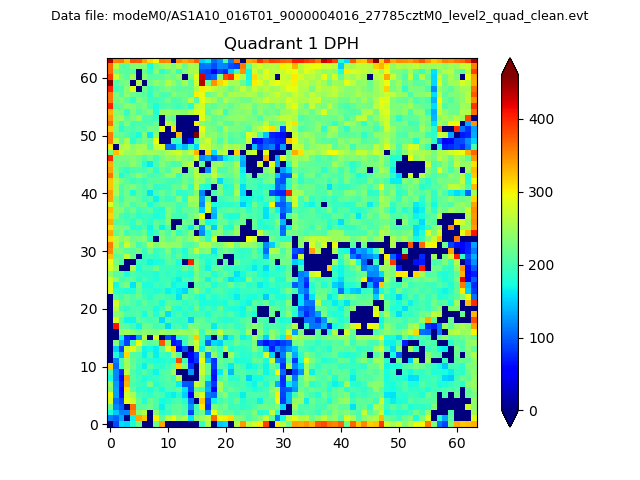 |
Quadrant B |
|---|---|---|---|
| Quadrant D | 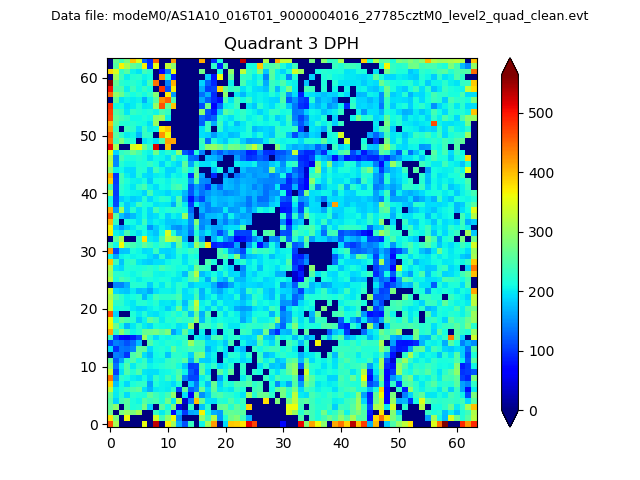 |
 |
Quadrant C |
| Plot type | Count rate plots | Images |
|---|---|---|
| Comparison with Poisson distribution Blue bars denote a histogram of data divided into 1 sec bins. Red curve is a Poisson curve with rate = median count rate of data. |
 |
 |
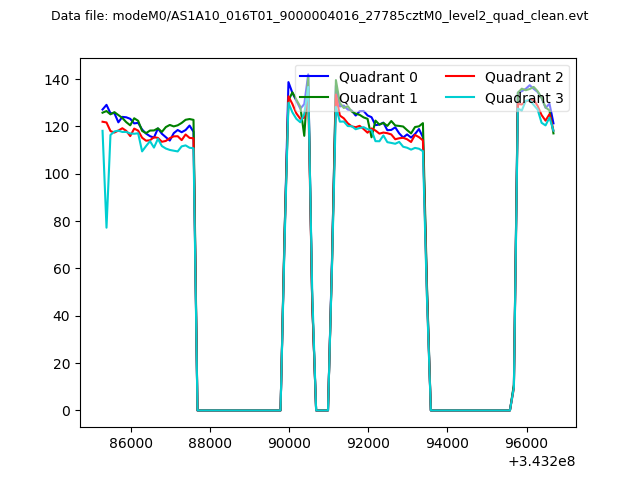
| Quadrant-wise count rates Data is divided into 100 sec bins |
 |
|
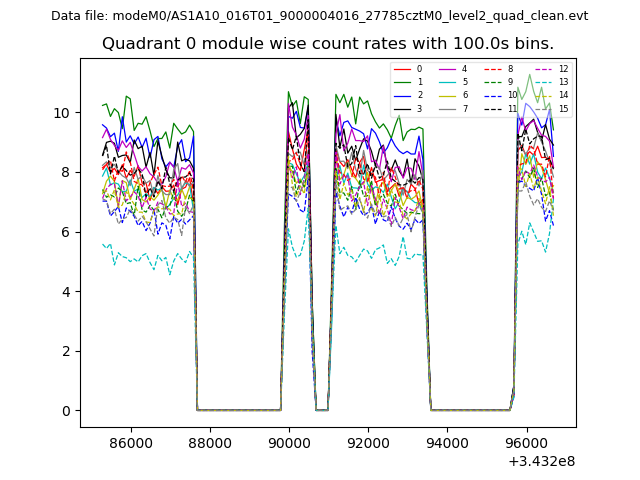
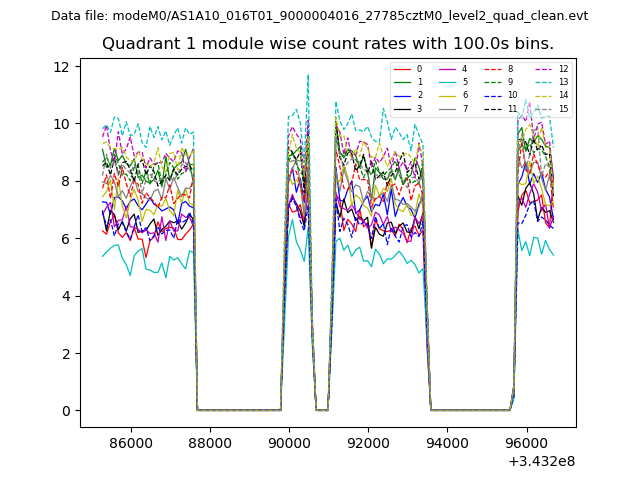
| Module-wise count rates for Quadrant A Data is divided into 100 sec bins |
 |
 |
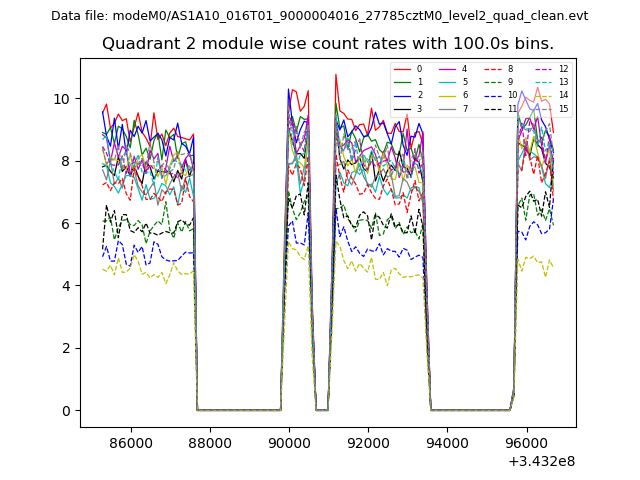
| Module-wise count rates for Quadrant B Data is divided into 100 sec bins |
 |
 |
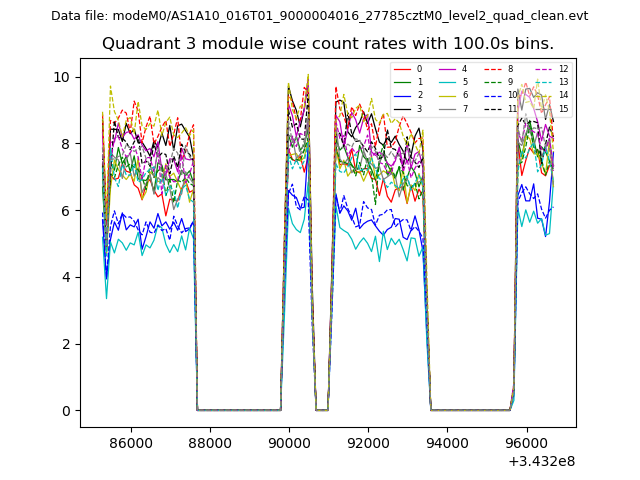
| Module-wise count rates for Quadrant C Data is divided into 100 sec bins |
 |
 |
| Module-wise count rates for Quadrant D Data is divided into 100 sec bins |
 |
 |
| Parameter | Plot |
|---|---|
| CZT HV Monitor | 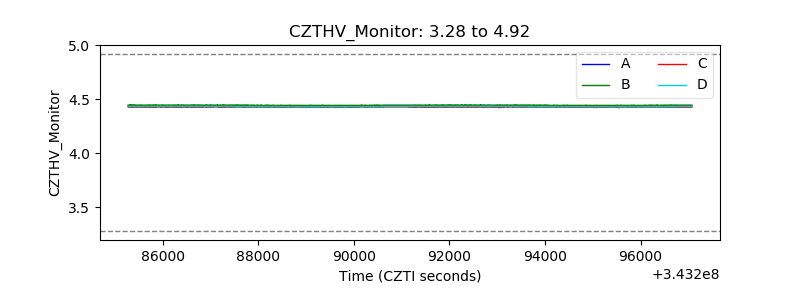 |
| D_VDD | 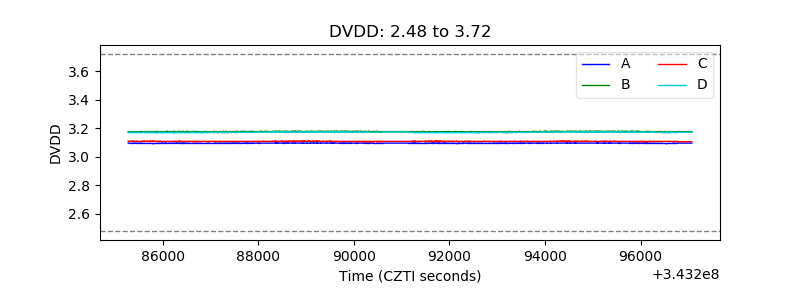 |
| Temperature 1 | 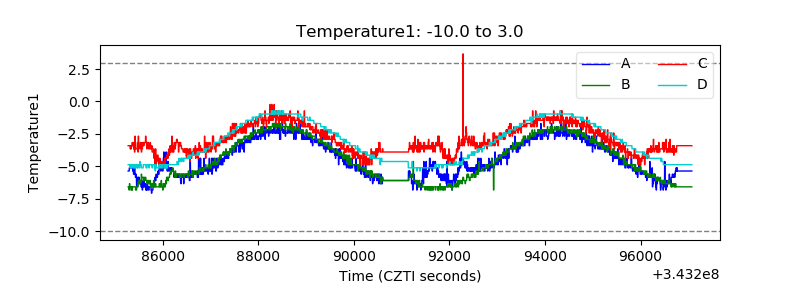 |
| Veto HV Monitor | 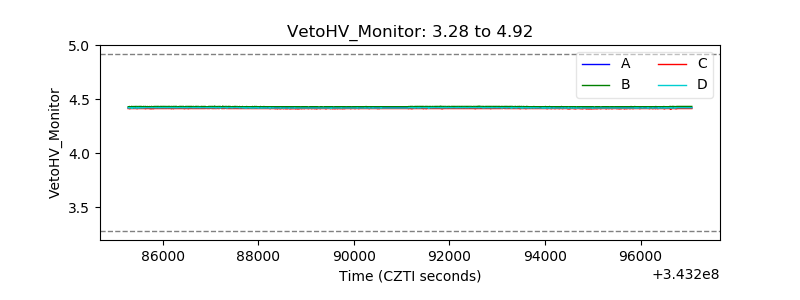 |
| Veto LLD | 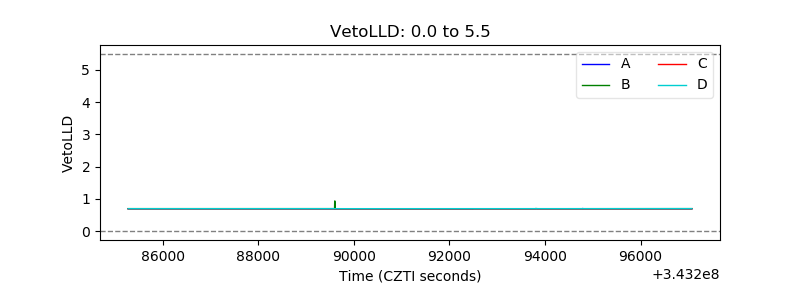 |
| Alpha Counter | 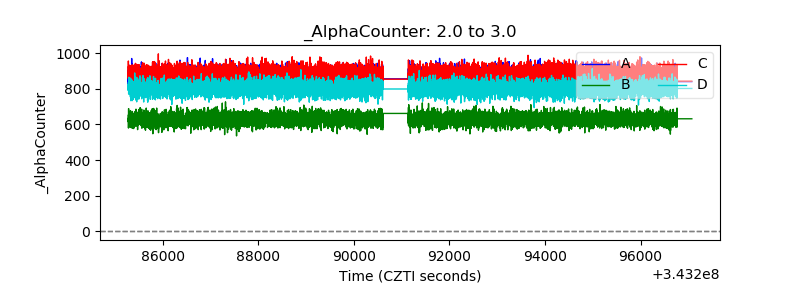 |
| _CPM_Rate | 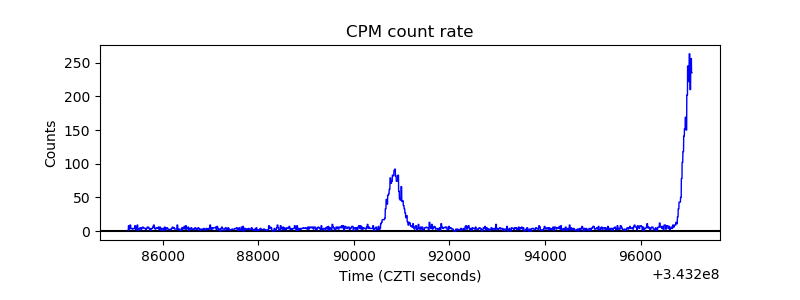 |
| CZT Counter | 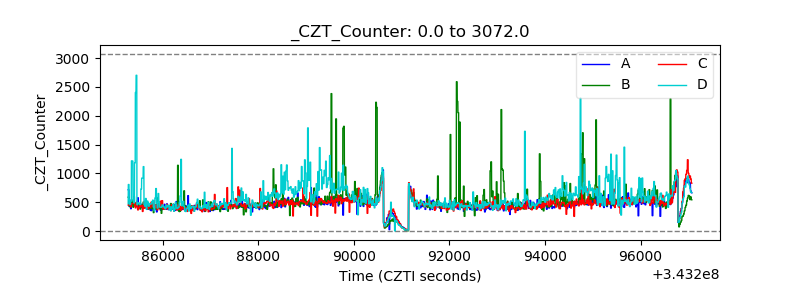 |
| +2.5 Volts monitor |  |
| +5 Volts monitor |  |
| _ROLL_ROT | 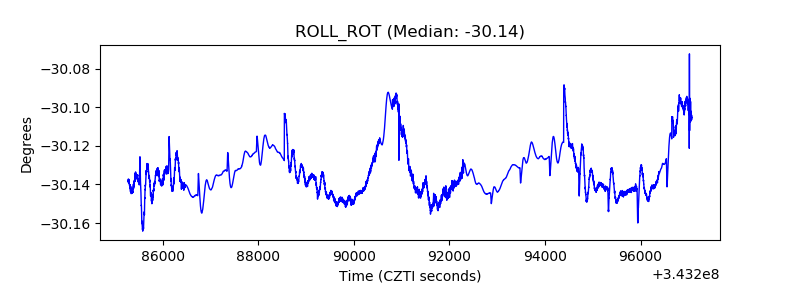 |
| _Roll_DEC | 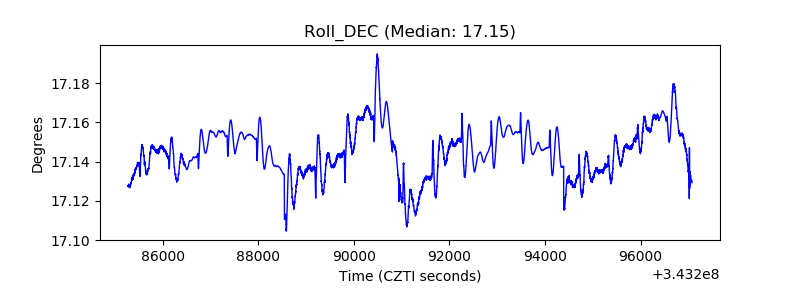 |
| _Roll_RA | 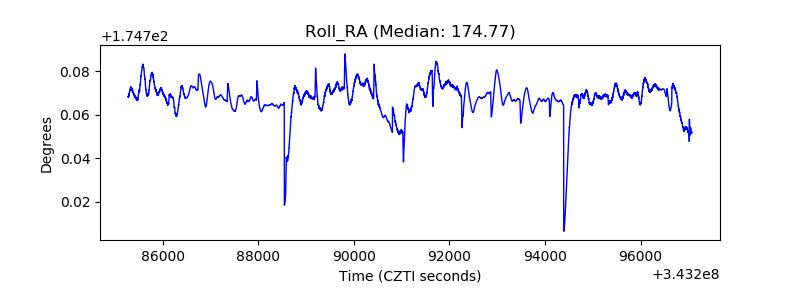 |
| Veto Counter | 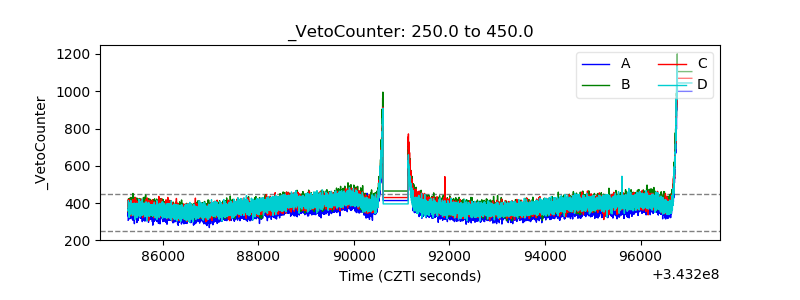 |