| Param | Original file | Final file |
|---|---|---|
| Filename | modeM0/AS1A10_016T01_9000004016_27786cztM0_level2.evt | modeM0/AS1A10_016T01_9000004016_27786cztM0_level2_quad_clean.evt |
| Size (bytes) | 572,693,760 | 96,396,480 |
| Size | 546.2 MB | 91.9 MB |
| Events in quadrant A | 3,349,429 | 623,222 |
| Events in quadrant B | 4,267,619 | 622,281 |
| Events in quadrant C | 3,507,786 | 606,208 |
| Events in quadrant D | 5,741,309 | 576,301 |
| Mode M9 | |||
|---|---|---|---|
| Quadrant | BADHDUFLAG | Total packets | Discarded packets |
| A | 0 | 15 | 0 |
| B | 0 | 15 | 0 |
| C | 0 | 15 | 0 |
| D | 0 | 15 | 0 |
| Mode M0 | |||
|---|---|---|---|
| Quadrant | BADHDUFLAG | Total packets | Discarded packets |
| A | 0 | 14397 | 0 |
| B | 0 | 17167 | 0 |
| C | 0 | 14750 | 0 |
| D | 0 | 21863 | 0 |
| Quadrant | Total seconds | Saturated seconds | Saturation percentage |
|---|---|---|---|
| A | 7050 | 117 | 1.659574% |
| B | 7051 | 412 | 5.843143% |
| C | 7051 | 164 | 2.325911% |
| D | 7051 | 599 | 8.495249% |
Noise dominated data is calculated using 1-second bins in cleaned event files. If a bin has >2000 counts, and if more than 50% of those come from <1% of pixels, then it is considered to be noise-dominated and hence unusable.
| Quadrant | # 1 sec bins | Bins with >0 counts | Bins with >2000 counts | High rate bins dominated by noise | Noise dominated (total time) | Noise dominated (detector-on time) | Marked lightcurve |
|---|---|---|---|---|---|---|---|
| A | 8530 | 7050 | 0 | 0 | 0.00% | 0.00% | 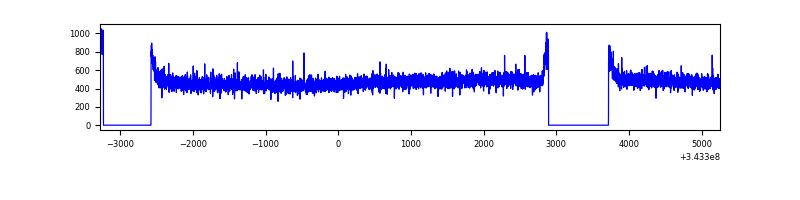 |
| B | 8531 | 7051 | 213 | 213 | 2.50% | 3.02% | 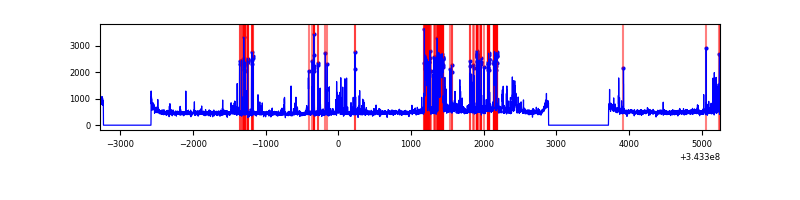 |
| C | 8531 | 7051 | 1 | 1 | 0.01% | 0.01% | 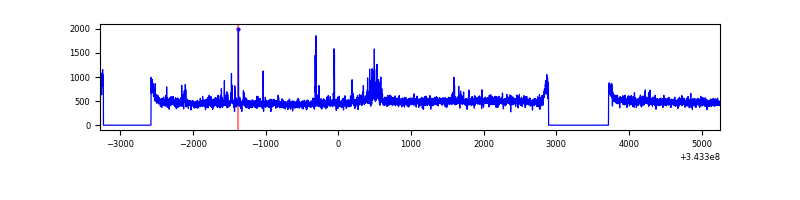 |
| D | 8530 | 7050 | 418 | 418 | 4.90% | 5.93% | 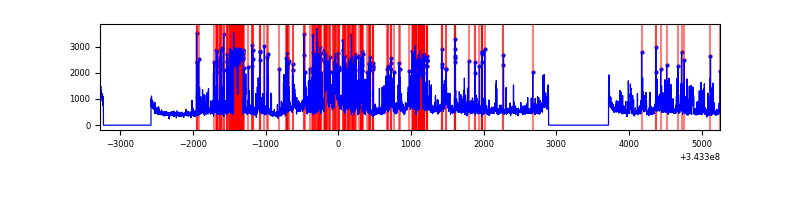 |
Top three noisy pixels from each quadrant. If the there are fewer than three noisy pixels in the level2.evt file, extra rows are filled as -1
| Pixel properties | Quadrant properties | ||||||
|---|---|---|---|---|---|---|---|
| Quadrant | DetID | PixID | Counts | Sigma | Mean | Median | Sigma |
| A | 13 | 254 | 12912 | 68.34 | 868 | 847 | 176.5 |
| A | 3 | 137 | 8234 | 41.84 | 868 | 847 | 176.5 |
| A | 0 | 226 | 7591 | 38.2 | 868 | 847 | 176.5 |
| B | 3 | 64 | 542626 | 3324.36 | 840 | 817 | 163.0 |
| B | 10 | 245 | 371047 | 2271.61 | 840 | 817 | 163.0 |
| B | 4 | 52 | 47863 | 288.66 | 840 | 817 | 163.0 |
| C | 3 | 233 | 150100 | 760.87 | 827 | 832 | 196.2 |
| C | 14 | 238 | 132143 | 669.34 | 827 | 832 | 196.2 |
| C | 13 | 61 | 5695 | 24.79 | 827 | 832 | 196.2 |
| D | 1 | 52 | 2305673 | 11766.6 | 811 | 788 | 195.9 |
| D | 7 | 223 | 157652 | 800.8 | 811 | 788 | 195.9 |
| D | 13 | 104 | 84389 | 426.79 | 811 | 788 | 195.9 |
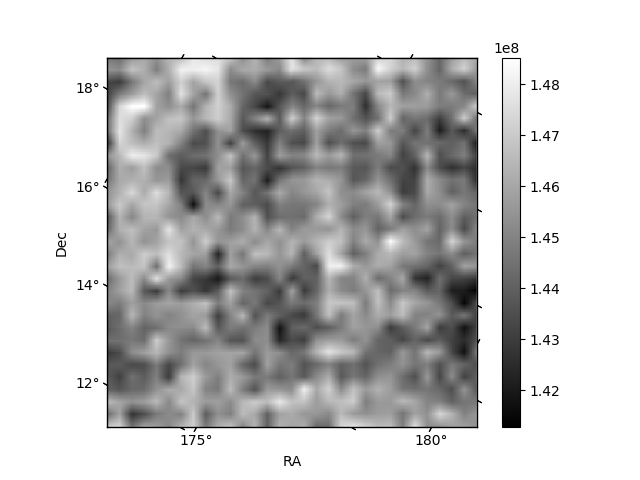
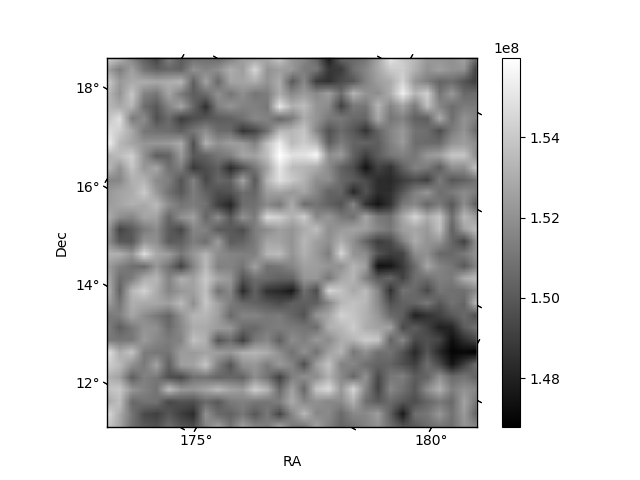
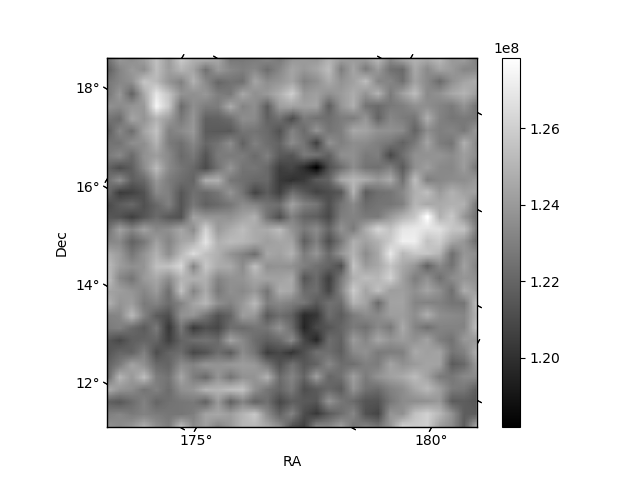
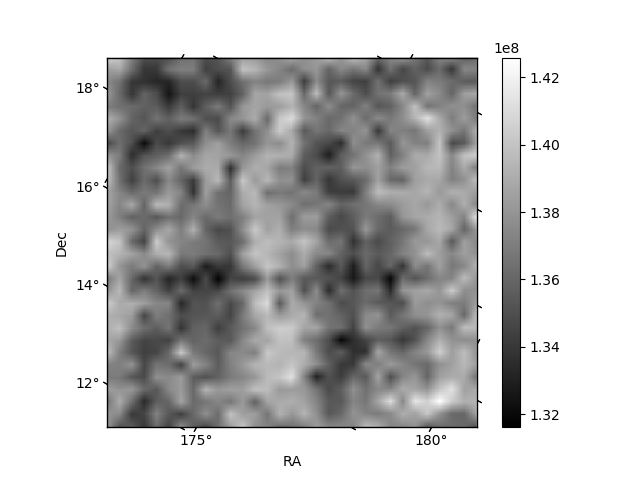
Histogram calculated using DETX and DETY for each event in the final _common_clean file
| Quadrant A |  |
 |
Quadrant B |
|---|---|---|---|
| Quadrant D |  |
 |
Quadrant C |
| Plot type | Count rate plots | Images |
|---|---|---|
| Comparison with Poisson distribution Blue bars denote a histogram of data divided into 1 sec bins. Red curve is a Poisson curve with rate = median count rate of data. |
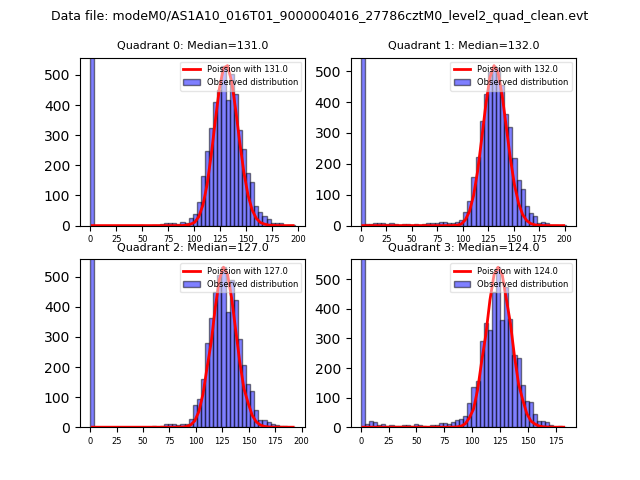 |
 |
| Quadrant-wise count rates Data is divided into 100 sec bins |
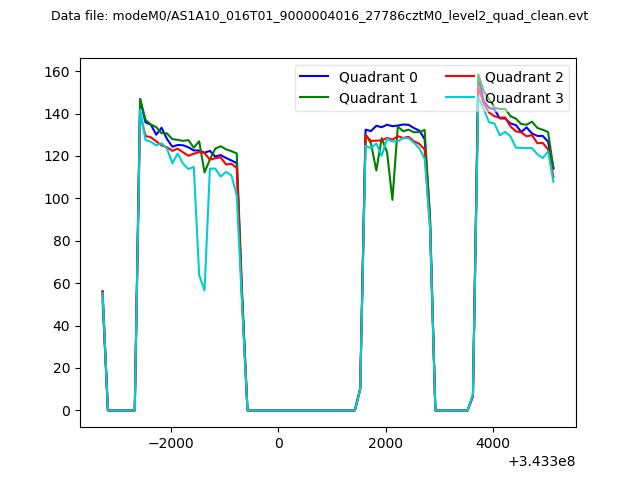 |
|
| Module-wise count rates for Quadrant A Data is divided into 100 sec bins |
 |
 |
| Module-wise count rates for Quadrant B Data is divided into 100 sec bins |
 |
 |
| Module-wise count rates for Quadrant C Data is divided into 100 sec bins |
 |
 |
| Module-wise count rates for Quadrant D Data is divided into 100 sec bins |
 |
 |
| Parameter | Plot |
|---|---|
| CZT HV Monitor |  |
| D_VDD | 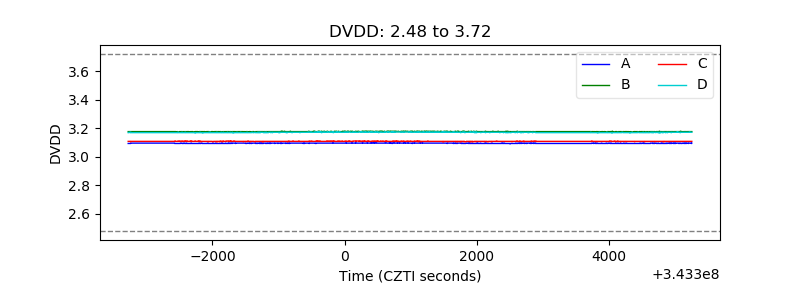 |
| Temperature 1 |  |
| Veto HV Monitor |  |
| Veto LLD |  |
| Alpha Counter | 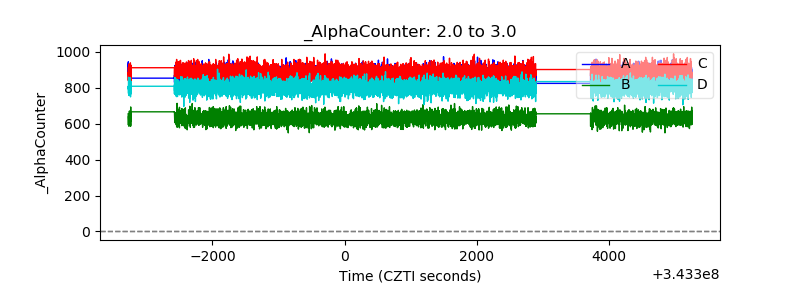 |
| _CPM_Rate | 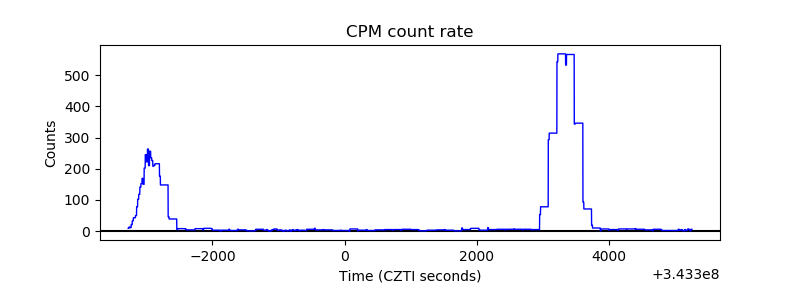 |
| CZT Counter |  |
| +2.5 Volts monitor |  |
| +5 Volts monitor |  |
| _ROLL_ROT |  |
| _Roll_DEC |  |
| _Roll_RA |  |
| Veto Counter |  |