| Param | Original file | Final file |
|---|---|---|
| Filename | modeM0/AS1A10_016T01_9000004016_27787cztM0_level2.evt | modeM0/AS1A10_016T01_9000004016_27787cztM0_level2_quad_clean.evt |
| Size (bytes) | 494,444,160 | 78,307,200 |
| Size | 471.5 MB | 74.7 MB |
| Events in quadrant A | 2,990,213 | 495,240 |
| Events in quadrant B | 3,291,453 | 503,783 |
| Events in quadrant C | 3,282,300 | 479,735 |
| Events in quadrant D | 4,991,792 | 461,621 |
| Mode M9 | |||
|---|---|---|---|
| Quadrant | BADHDUFLAG | Total packets | Discarded packets |
| A | 0 | 10 | 0 |
| B | 0 | 10 | 0 |
| C | 0 | 10 | 0 |
| D | 0 | 10 | 0 |
| Mode M0 | |||
|---|---|---|---|
| Quadrant | BADHDUFLAG | Total packets | Discarded packets |
| A | 0 | 12664 | 0 |
| B | 0 | 13484 | 0 |
| C | 0 | 13473 | 0 |
| D | 0 | 19012 | 0 |
| Quadrant | Total seconds | Saturated seconds | Saturation percentage |
|---|---|---|---|
| A | 6168 | 46 | 0.745785% |
| B | 6169 | 66 | 1.069865% |
| C | 6169 | 89 | 1.442697% |
| D | 6169 | 327 | 5.300697% |
Noise dominated data is calculated using 1-second bins in cleaned event files. If a bin has >2000 counts, and if more than 50% of those come from <1% of pixels, then it is considered to be noise-dominated and hence unusable.
| Quadrant | # 1 sec bins | Bins with >0 counts | Bins with >2000 counts | High rate bins dominated by noise | Noise dominated (total time) | Noise dominated (detector-on time) | Marked lightcurve |
|---|---|---|---|---|---|---|---|
| A | 7163 | 6168 | 0 | 0 | 0.00% | 0.00% | 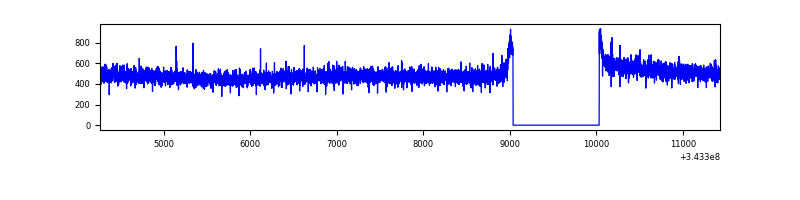 |
| B | 7164 | 6169 | 13 | 13 | 0.18% | 0.21% | 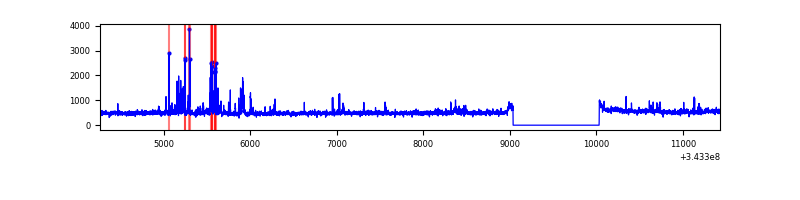 |
| C | 7164 | 6169 | 2 | 2 | 0.03% | 0.03% | 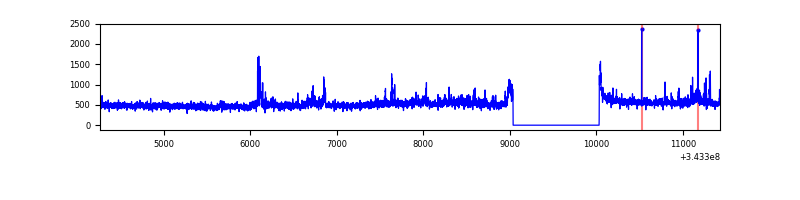 |
| D | 7164 | 6169 | 254 | 254 | 3.55% | 4.12% | 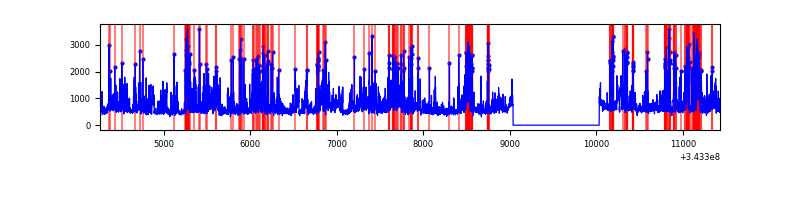 |
Top three noisy pixels from each quadrant. If the there are fewer than three noisy pixels in the level2.evt file, extra rows are filled as -1
| Pixel properties | Quadrant properties | ||||||
|---|---|---|---|---|---|---|---|
| Quadrant | DetID | PixID | Counts | Sigma | Mean | Median | Sigma |
| A | 13 | 254 | 10514 | 62.7 | 775 | 759 | 155.6 |
| A | 3 | 137 | 7285 | 41.94 | 775 | 759 | 155.6 |
| A | 0 | 226 | 6751 | 38.51 | 775 | 759 | 155.6 |
| B | 3 | 64 | 184039 | 1248.8 | 764 | 747 | 146.8 |
| B | 10 | 245 | 48480 | 325.21 | 764 | 747 | 146.8 |
| B | 0 | 190 | 19441 | 127.37 | 764 | 747 | 146.8 |
| C | 3 | 233 | 266599 | 1532.12 | 742 | 749 | 173.5 |
| C | 14 | 238 | 117133 | 670.73 | 742 | 749 | 173.5 |
| C | 10 | 22 | 6575 | 33.58 | 742 | 749 | 173.5 |
| D | 1 | 52 | 1567003 | 8834.06 | 740 | 719 | 177.3 |
| D | 13 | 104 | 289016 | 1626.03 | 740 | 719 | 177.3 |
| D | 2 | 250 | 145804 | 818.3 | 740 | 719 | 177.3 |
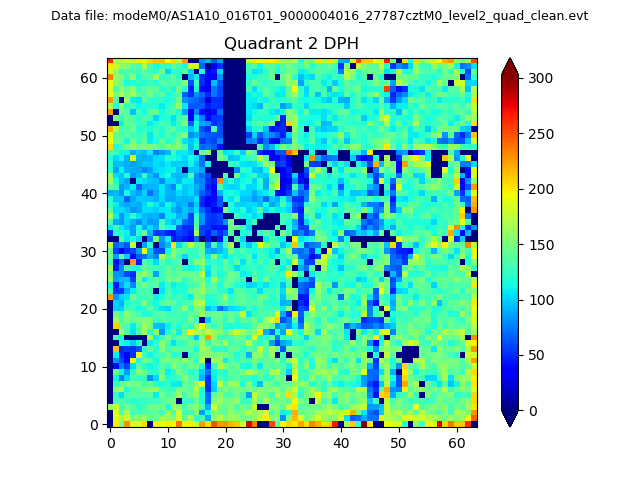
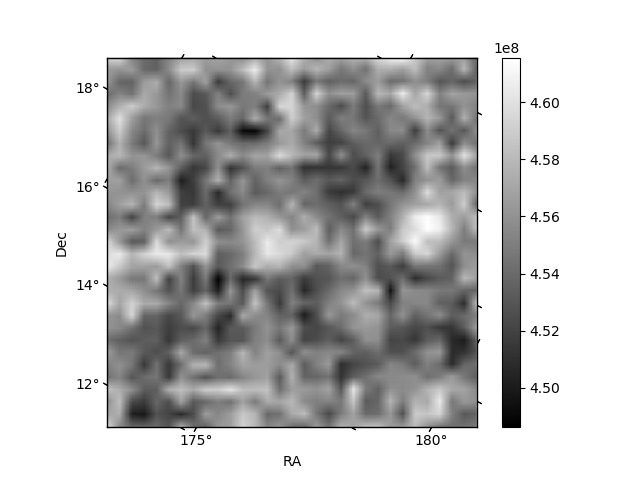
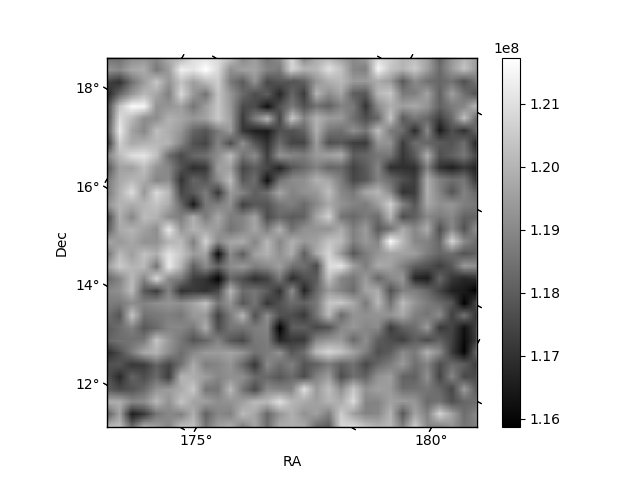
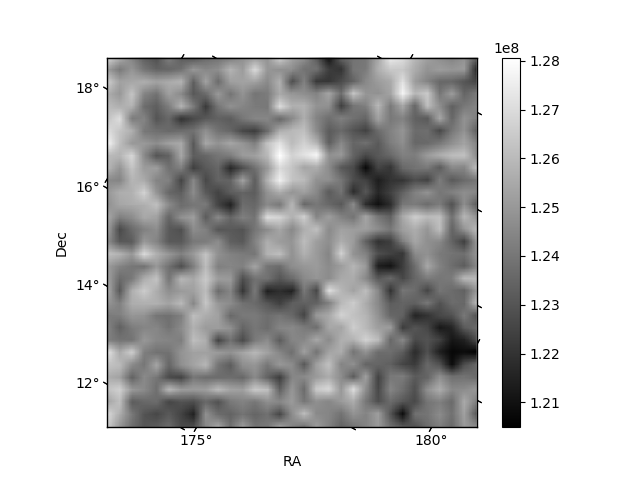
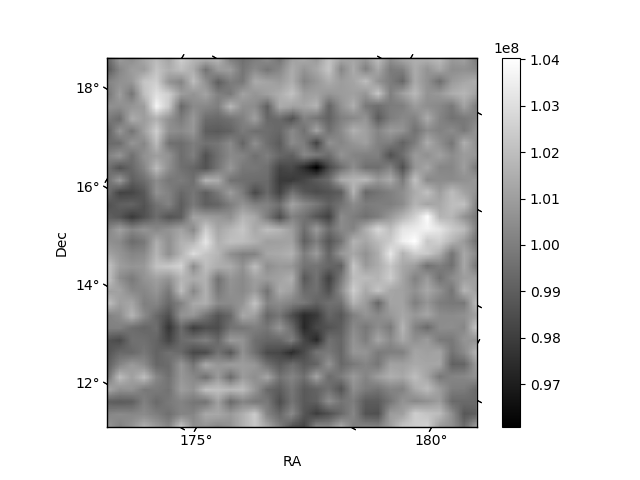
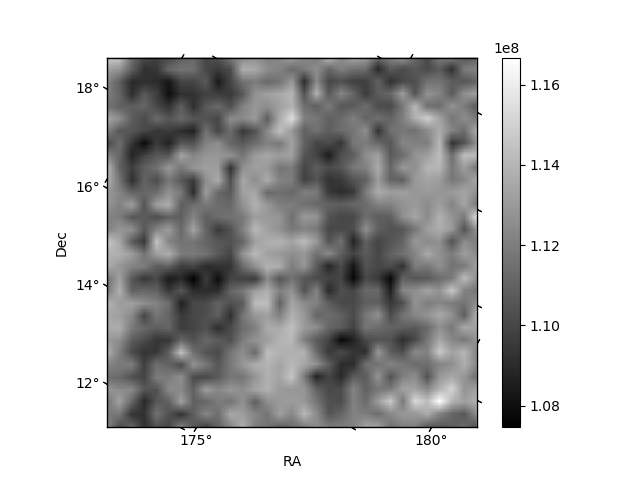
Histogram calculated using DETX and DETY for each event in the final _common_clean file
| Quadrant A | 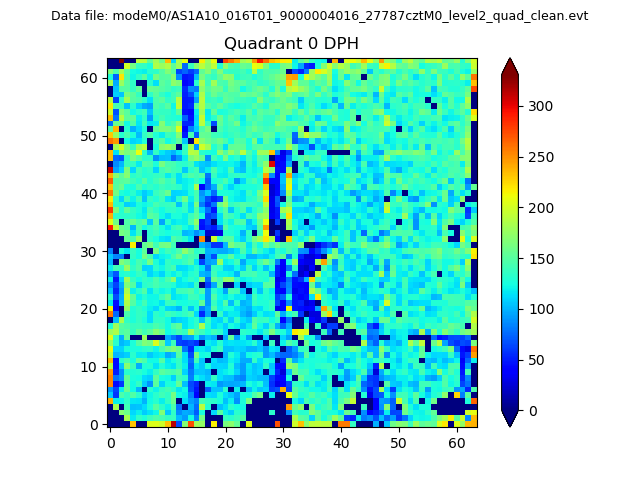 |
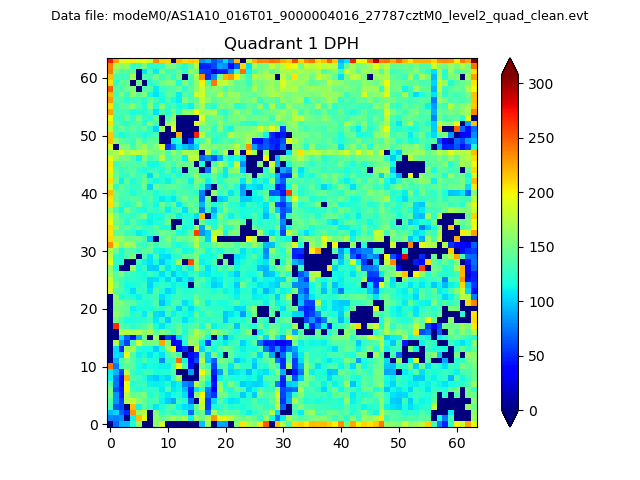 |
Quadrant B |
|---|---|---|---|
| Quadrant D | 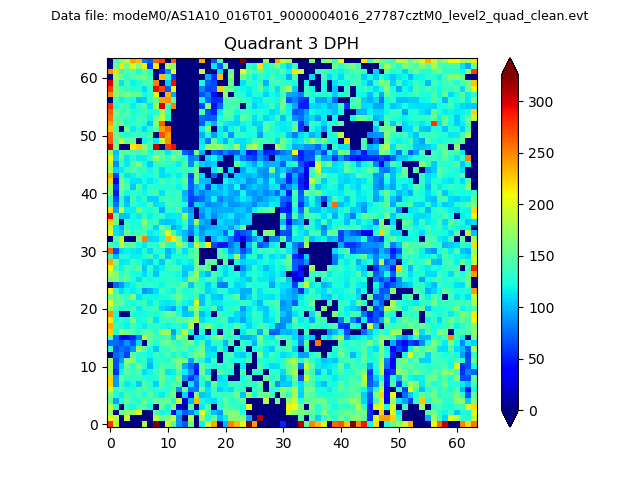 |
 |
Quadrant C |
| Plot type | Count rate plots | Images |
|---|---|---|
| Comparison with Poisson distribution Blue bars denote a histogram of data divided into 1 sec bins. Red curve is a Poisson curve with rate = median count rate of data. |
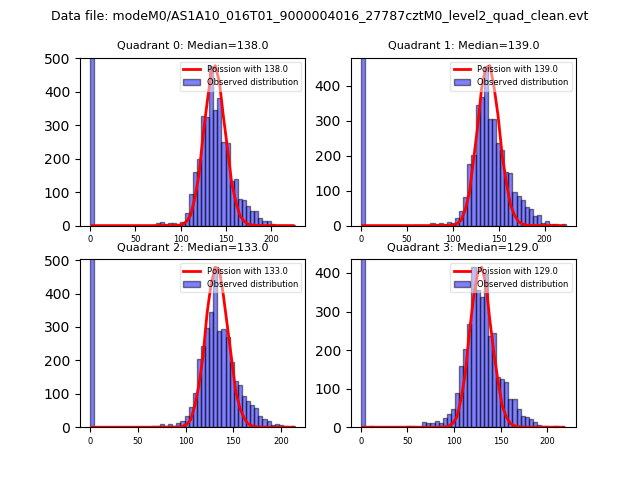 |
 |
| Quadrant-wise count rates Data is divided into 100 sec bins |
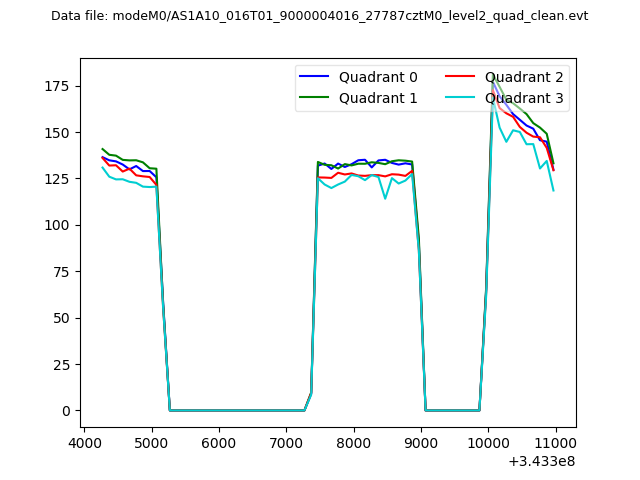 |
|
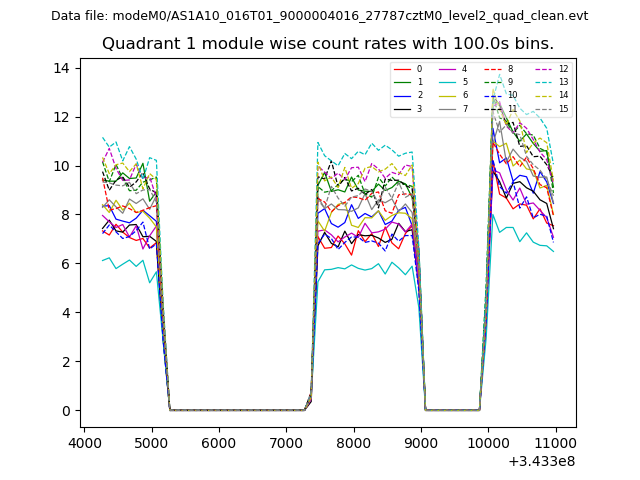
| Module-wise count rates for Quadrant A Data is divided into 100 sec bins |
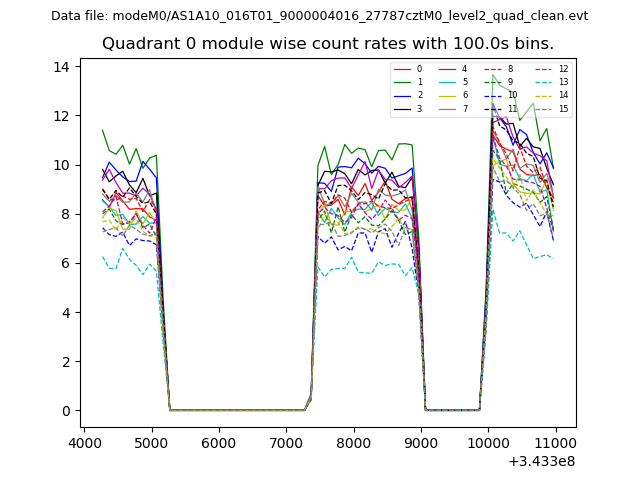 |
 |
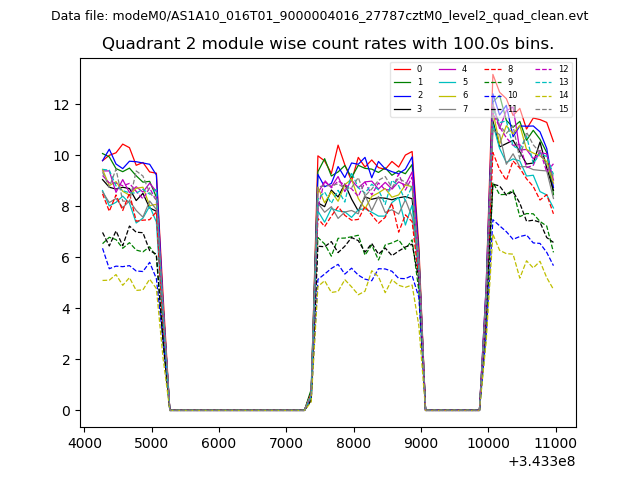
| Module-wise count rates for Quadrant B Data is divided into 100 sec bins |
 |
 |
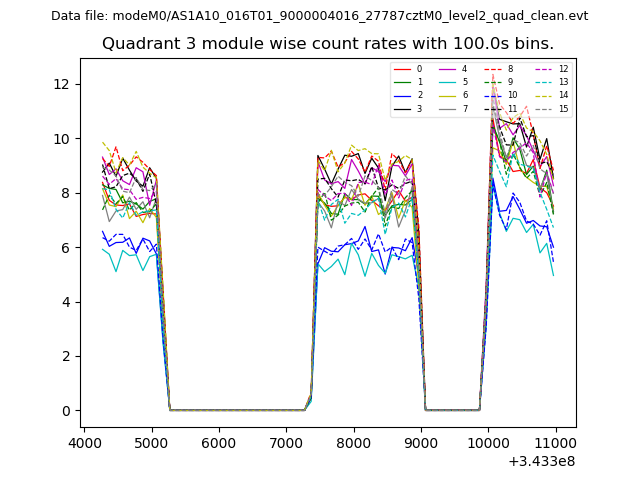
| Module-wise count rates for Quadrant C Data is divided into 100 sec bins |
 |
 |
| Module-wise count rates for Quadrant D Data is divided into 100 sec bins |
 |
 |
| Parameter | Plot |
|---|---|
| CZT HV Monitor | 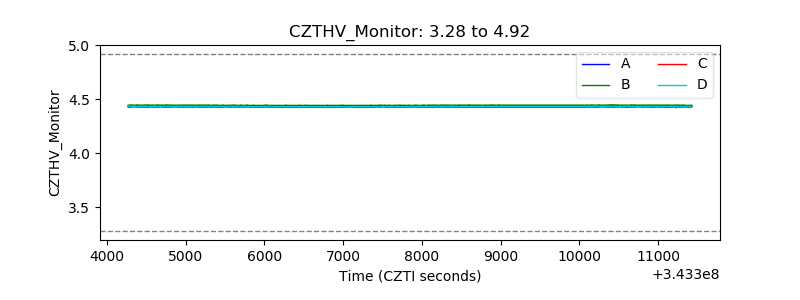 |
| D_VDD |  |
| Temperature 1 | 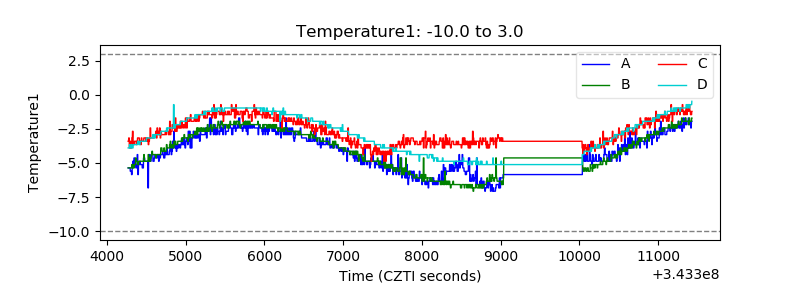 |
| Veto HV Monitor | 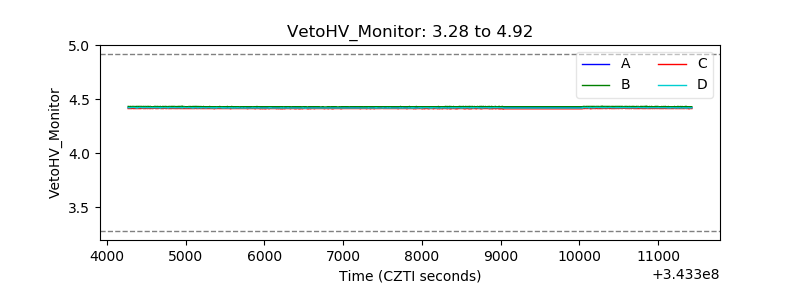 |
| Veto LLD | 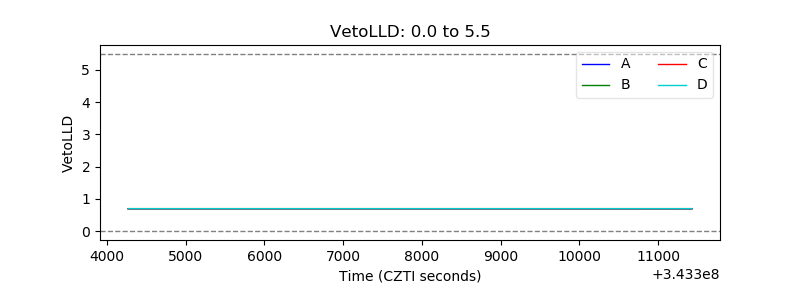 |
| Alpha Counter | 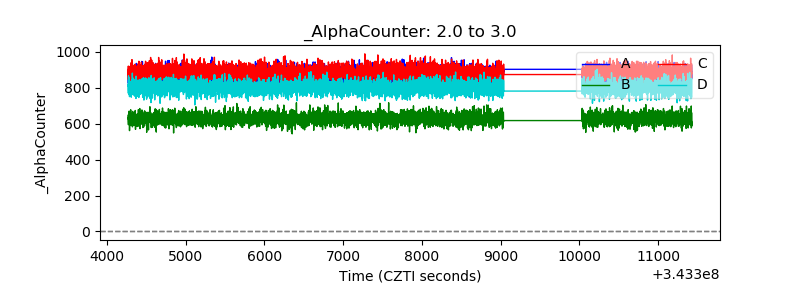 |
| _CPM_Rate | 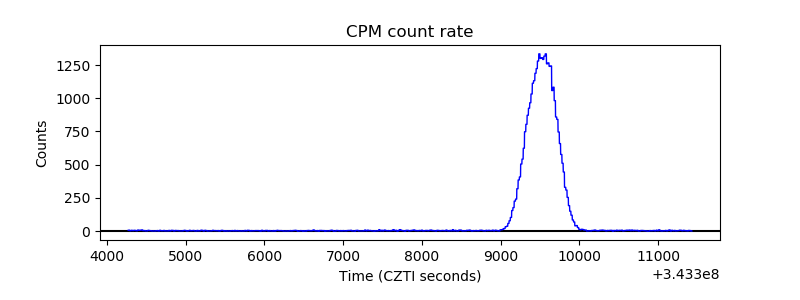 |
| CZT Counter | 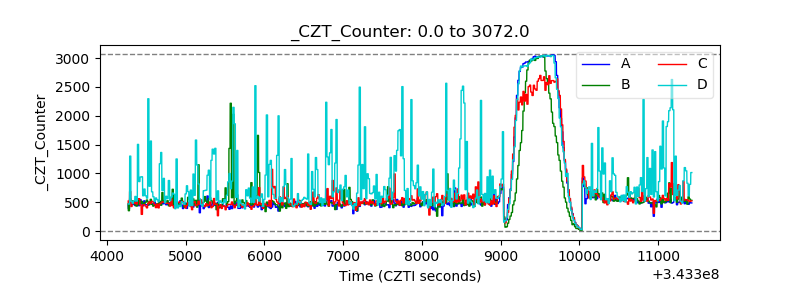 |
| +2.5 Volts monitor | 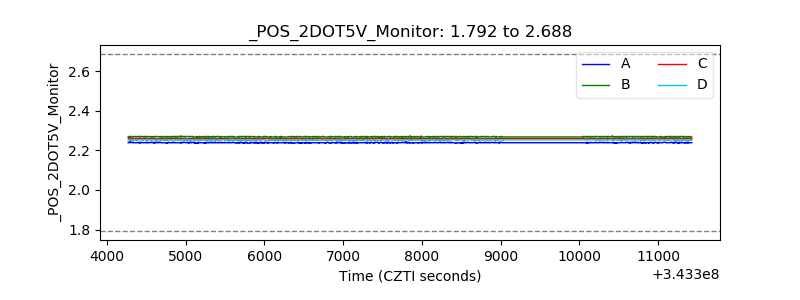 |
| +5 Volts monitor |  |
| _ROLL_ROT | 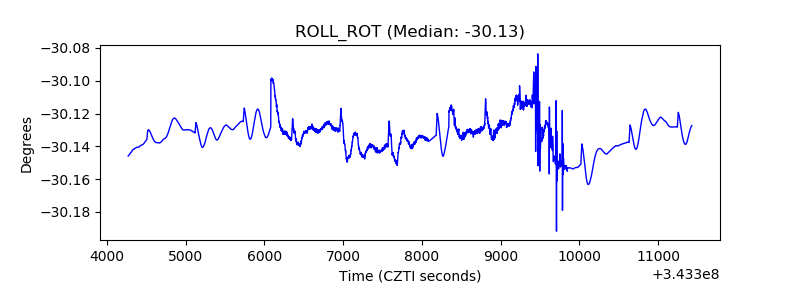 |
| _Roll_DEC | 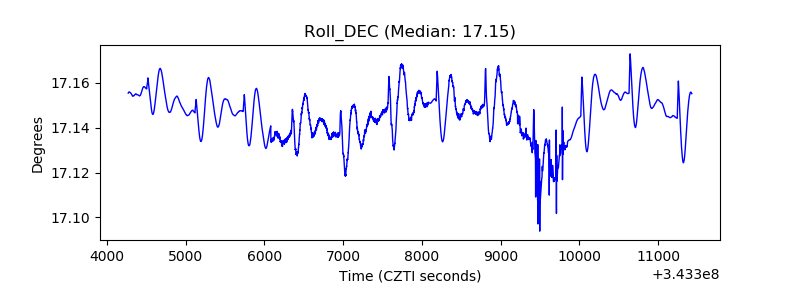 |
| _Roll_RA | 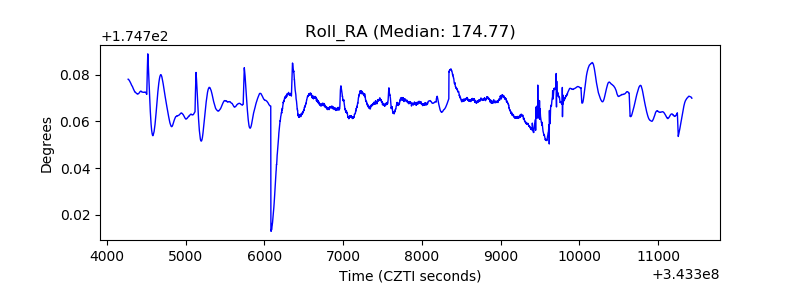 |
| Veto Counter | 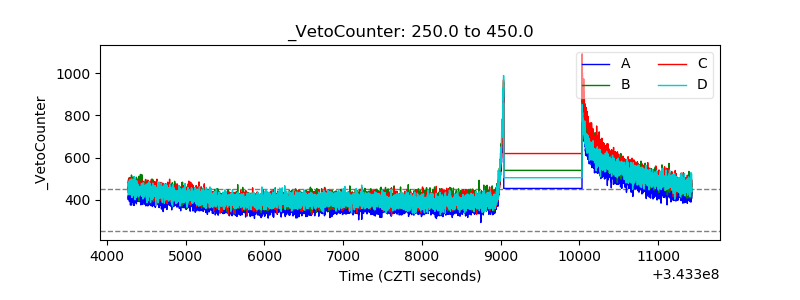 |