| Param | Original file | Final file |
|---|---|---|
| Filename | modeM0/AS1A10_016T01_9000004016_27789cztM0_level2.evt | modeM0/AS1A10_016T01_9000004016_27789cztM0_level2_quad_clean.evt |
| Size (bytes) | 546,215,040 | 79,608,960 |
| Size | 520.9 MB | 75.9 MB |
| Events in quadrant A | 3,245,031 | 503,059 |
| Events in quadrant B | 3,585,511 | 510,180 |
| Events in quadrant C | 3,774,907 | 488,256 |
| Events in quadrant D | 5,507,440 | 466,875 |
| Mode M9 | |||
|---|---|---|---|
| Quadrant | BADHDUFLAG | Total packets | Discarded packets |
| A | 0 | 12 | 0 |
| B | 0 | 12 | 0 |
| C | 0 | 12 | 0 |
| D | 0 | 12 | 0 |
| Mode M0 | |||
|---|---|---|---|
| Quadrant | BADHDUFLAG | Total packets | Discarded packets |
| A | 0 | 13525 | 0 |
| B | 0 | 14585 | 0 |
| C | 0 | 15159 | 0 |
| D | 0 | 20865 | 0 |
| Quadrant | Total seconds | Saturated seconds | Saturation percentage |
|---|---|---|---|
| A | 6347 | 36 | 0.567197% |
| B | 6347 | 97 | 1.528281% |
| C | 6347 | 137 | 2.158500% |
| D | 6346 | 452 | 7.122597% |
Noise dominated data is calculated using 1-second bins in cleaned event files. If a bin has >2000 counts, and if more than 50% of those come from <1% of pixels, then it is considered to be noise-dominated and hence unusable.
| Quadrant | # 1 sec bins | Bins with >0 counts | Bins with >2000 counts | High rate bins dominated by noise | Noise dominated (total time) | Noise dominated (detector-on time) | Marked lightcurve |
|---|---|---|---|---|---|---|---|
| A | 7487 | 6347 | 0 | 0 | 0.00% | 0.00% | 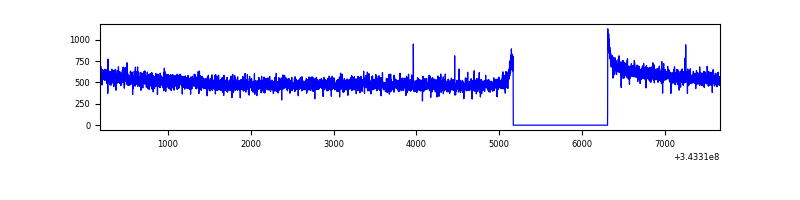 |
| B | 7487 | 6347 | 43 | 43 | 0.57% | 0.68% |  |
| C | 7487 | 6347 | 42 | 42 | 0.56% | 0.66% | 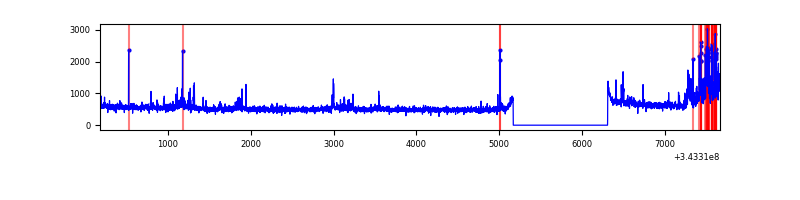 |
| D | 7486 | 6346 | 397 | 397 | 5.30% | 6.26% | 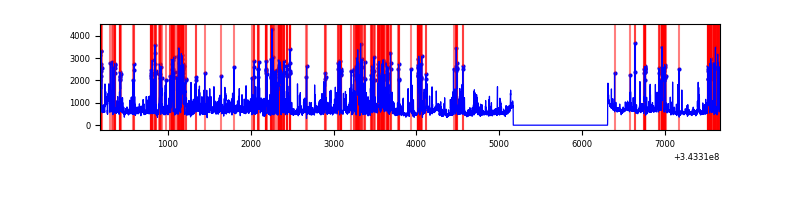 |
Top three noisy pixels from each quadrant. If the there are fewer than three noisy pixels in the level2.evt file, extra rows are filled as -1
| Pixel properties | Quadrant properties | ||||||
|---|---|---|---|---|---|---|---|
| Quadrant | DetID | PixID | Counts | Sigma | Mean | Median | Sigma |
| A | 13 | 254 | 11027 | 59.97 | 841 | 825 | 170.1 |
| A | 3 | 137 | 7553 | 39.55 | 841 | 825 | 170.1 |
| A | 0 | 226 | 7319 | 38.17 | 841 | 825 | 170.1 |
| B | 10 | 245 | 139328 | 887.47 | 825 | 806 | 156.1 |
| B | 3 | 64 | 86211 | 547.17 | 825 | 806 | 156.1 |
| B | 4 | 52 | 70421 | 446.0 | 825 | 806 | 156.1 |
| C | 3 | 233 | 484741 | 2590.16 | 806 | 815 | 186.8 |
| C | 14 | 238 | 128819 | 685.13 | 806 | 815 | 186.8 |
| C | 10 | 22 | 7714 | 36.93 | 806 | 815 | 186.8 |
| D | 1 | 52 | 1764649 | 9313.36 | 796 | 776 | 189.4 |
| D | 13 | 104 | 404859 | 2133.58 | 796 | 776 | 189.4 |
| D | 7 | 223 | 150931 | 792.83 | 796 | 776 | 189.4 |
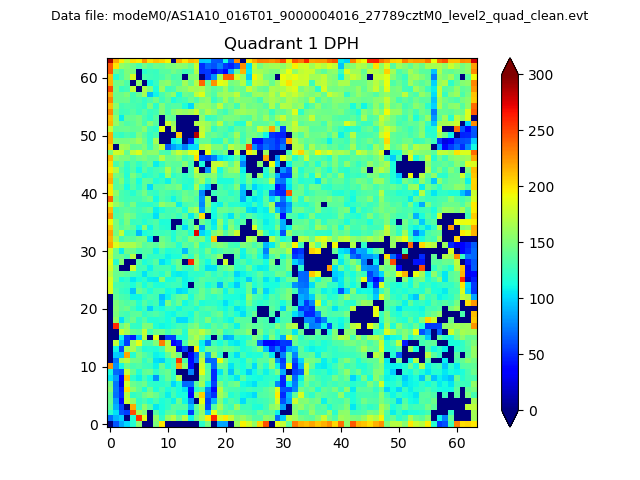
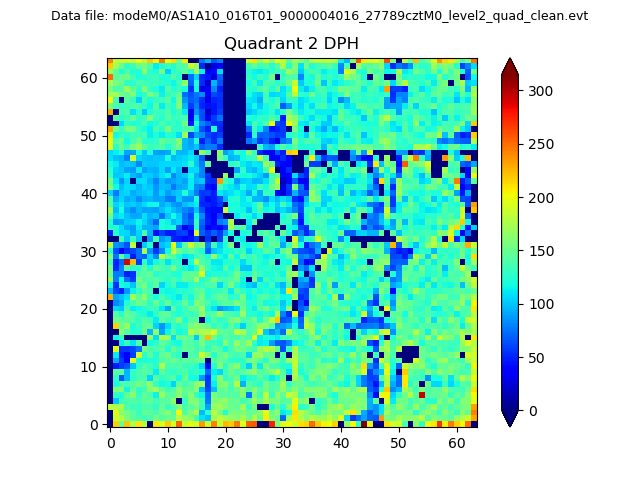
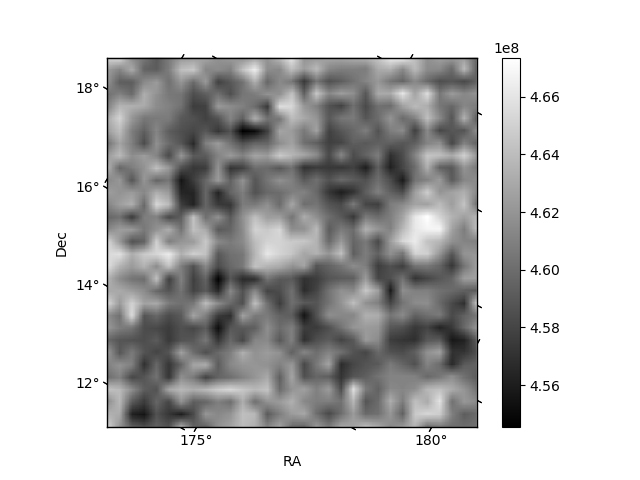
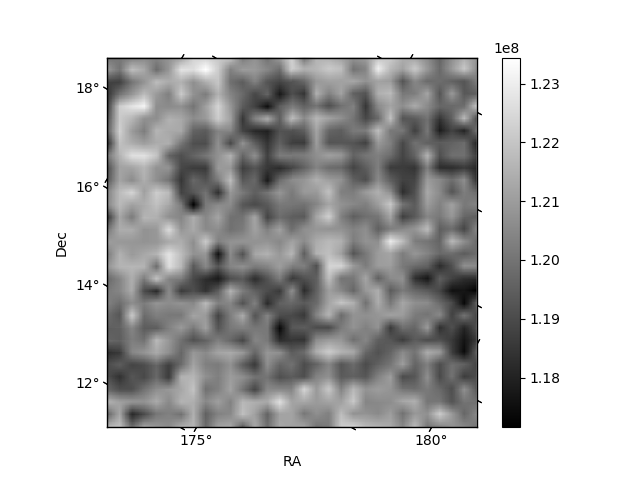
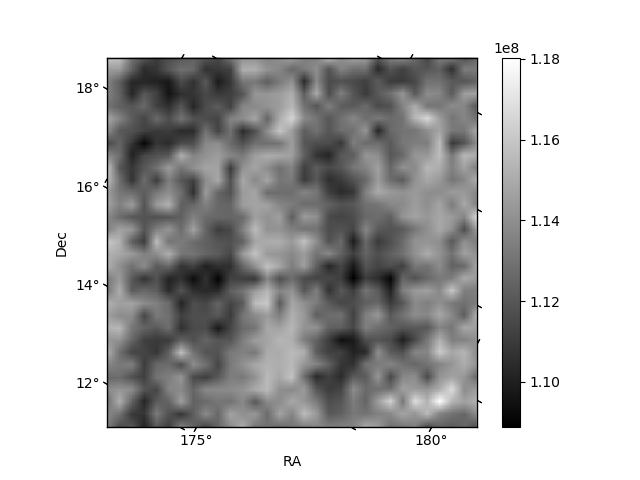
Histogram calculated using DETX and DETY for each event in the final _common_clean file
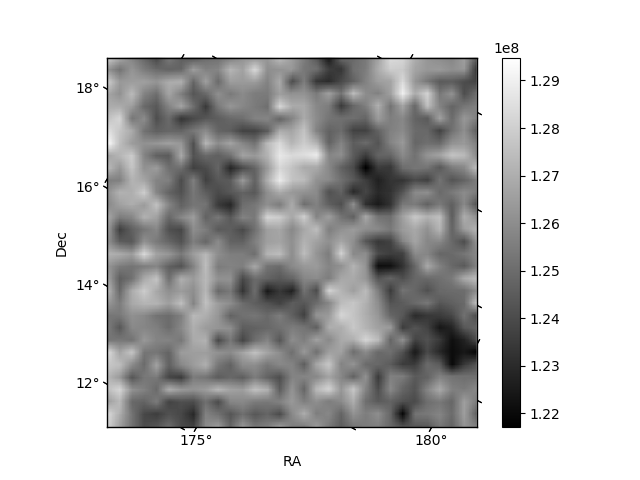
| Quadrant A | 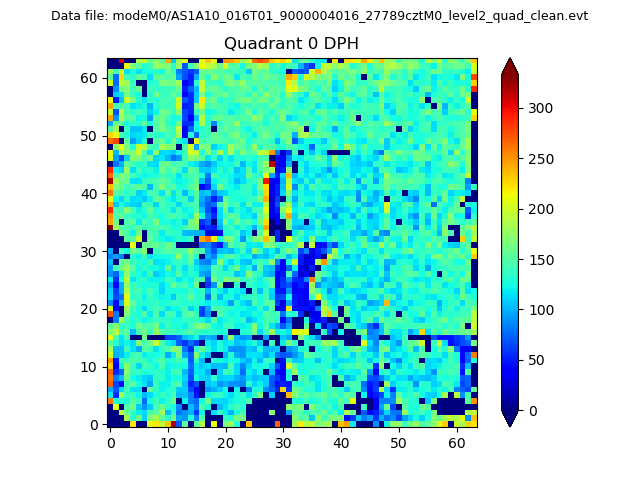 |
 |
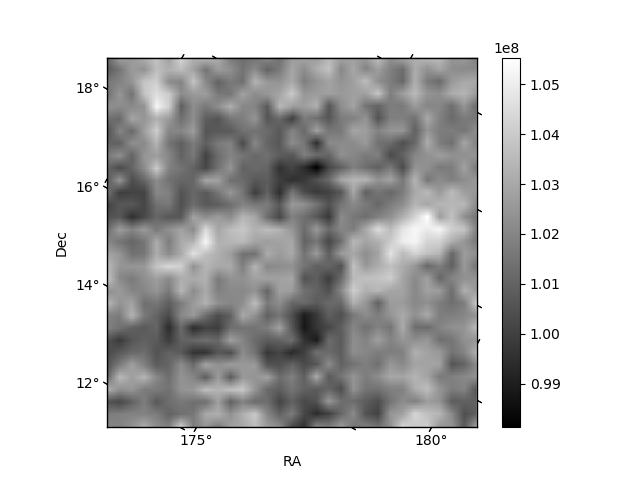
Quadrant B |
|---|---|---|---|
| Quadrant D | 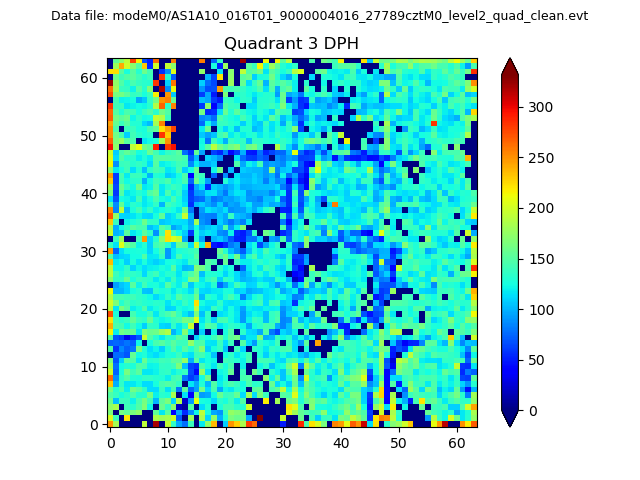 |
 |
Quadrant C |
| Plot type | Count rate plots | Images |
|---|---|---|
| Comparison with Poisson distribution Blue bars denote a histogram of data divided into 1 sec bins. Red curve is a Poisson curve with rate = median count rate of data. |
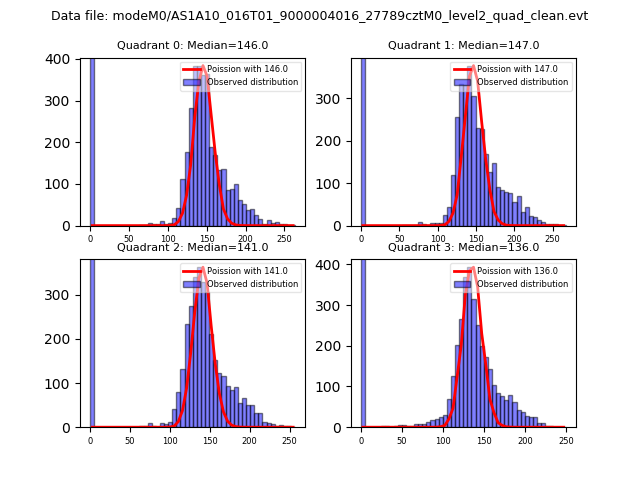 |
 |
| Quadrant-wise count rates Data is divided into 100 sec bins |
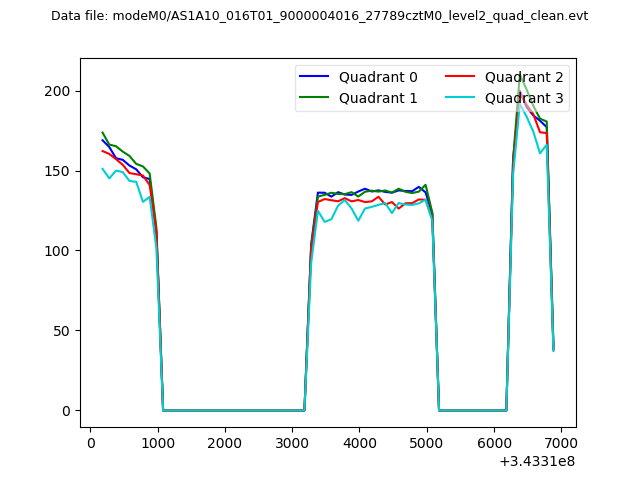 |
|
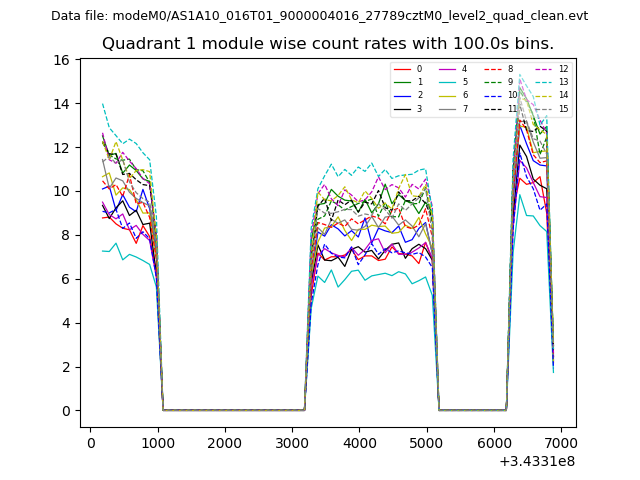
| Module-wise count rates for Quadrant A Data is divided into 100 sec bins |
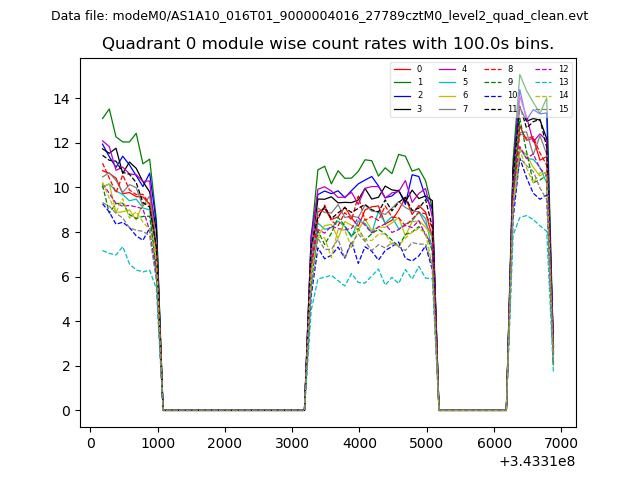 |
 |
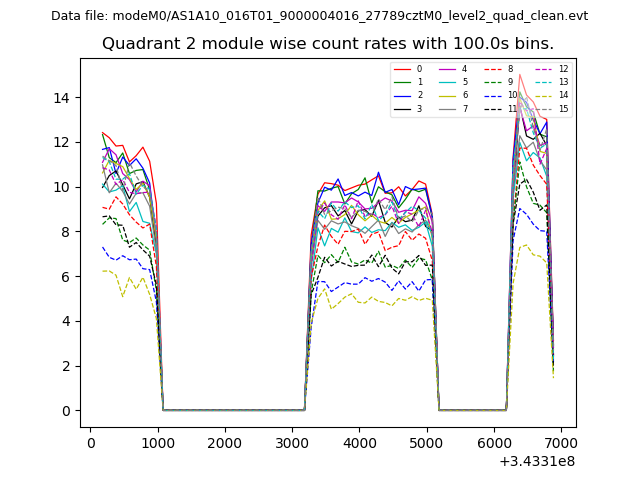
| Module-wise count rates for Quadrant B Data is divided into 100 sec bins |
 |
 |
| Module-wise count rates for Quadrant C Data is divided into 100 sec bins |
 |
 |
| Module-wise count rates for Quadrant D Data is divided into 100 sec bins |
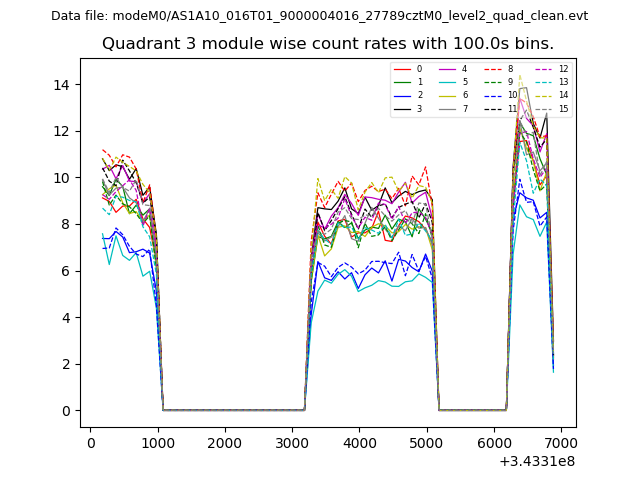 |
 |
| Parameter | Plot |
|---|---|
| CZT HV Monitor | 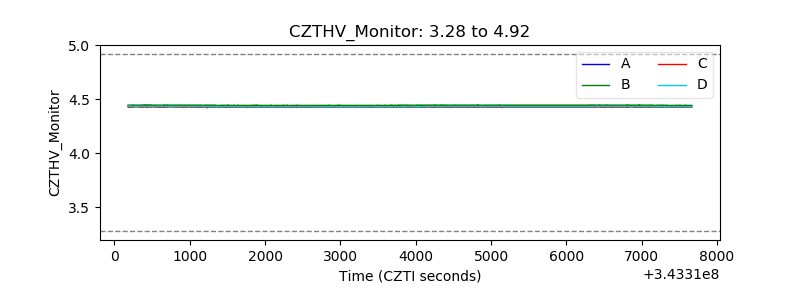 |
| D_VDD | 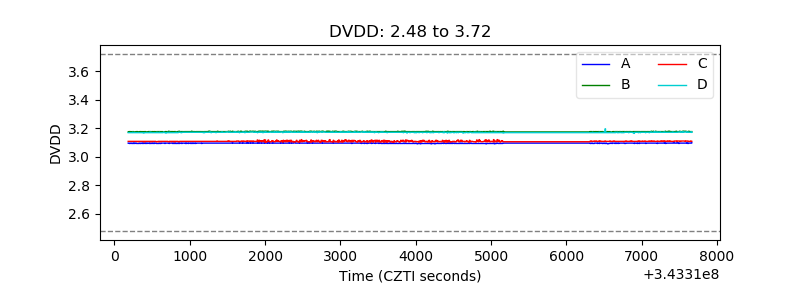 |
| Temperature 1 | 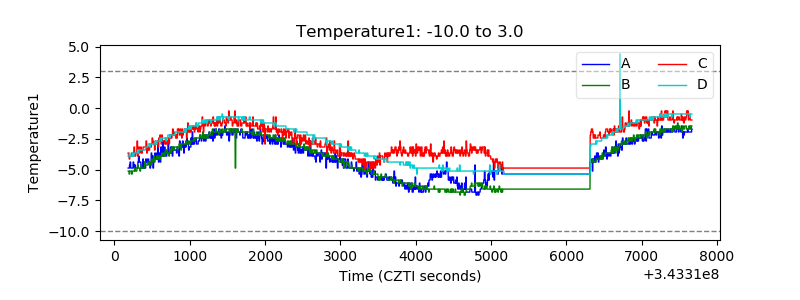 |
| Veto HV Monitor | 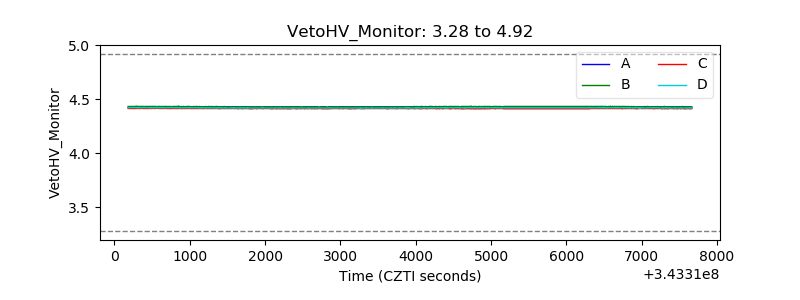 |
| Veto LLD | 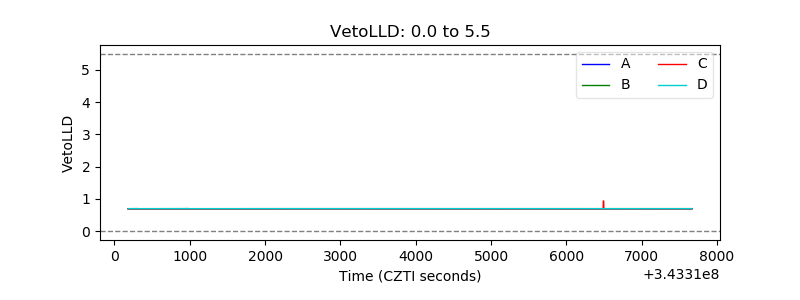 |
| Alpha Counter | 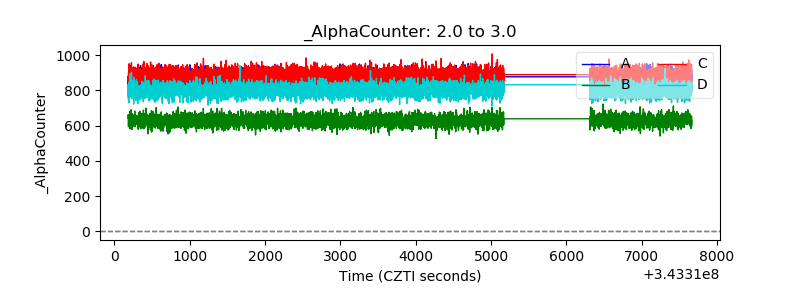 |
| _CPM_Rate | 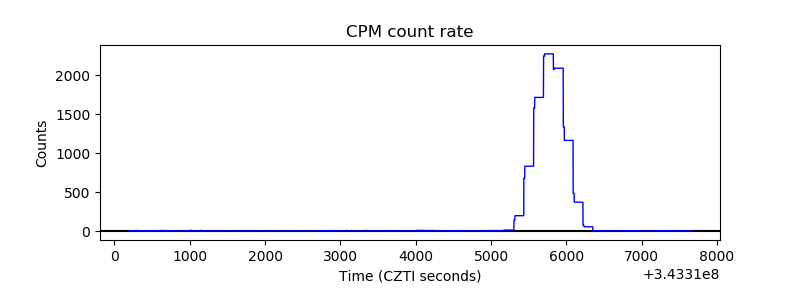 |
| CZT Counter | 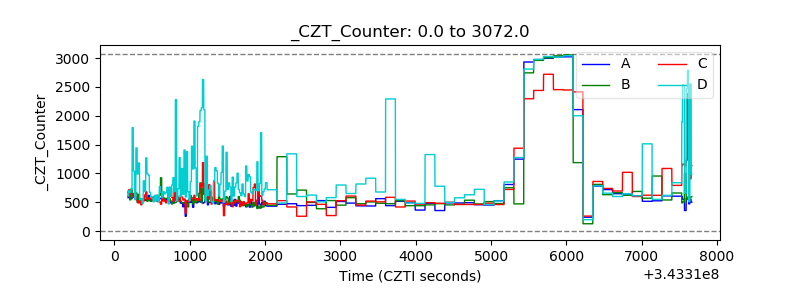 |
| +2.5 Volts monitor |  |
| +5 Volts monitor |  |
| _ROLL_ROT | 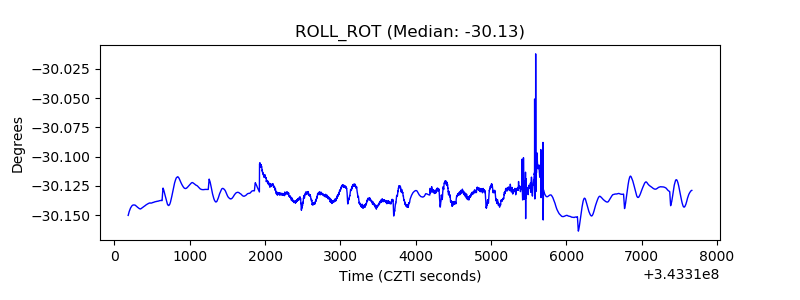 |
| _Roll_DEC | 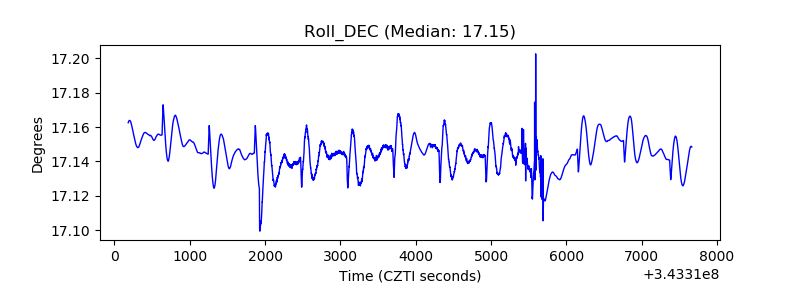 |
| _Roll_RA | 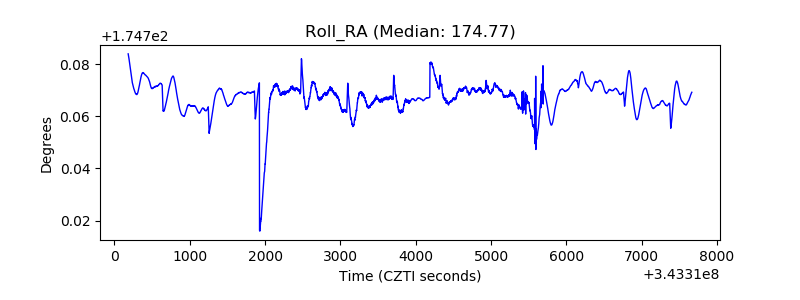 |
| Veto Counter | 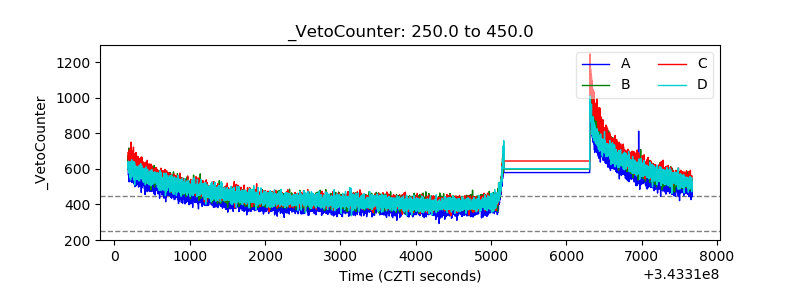 |