| Param | Original file | Final file |
|---|---|---|
| Filename | modeM0/AS1A10_016T01_9000004016_27790cztM0_level2.evt | modeM0/AS1A10_016T01_9000004016_27790cztM0_level2_quad_clean.evt |
| Size (bytes) | 682,197,120 | 73,056,960 |
| Size | 650.6 MB | 69.7 MB |
| Events in quadrant A | 3,436,911 | 463,210 |
| Events in quadrant B | 4,719,916 | 459,630 |
| Events in quadrant C | 4,770,671 | 444,311 |
| Events in quadrant D | 7,308,900 | 406,464 |
| Mode M9 | |||
|---|---|---|---|
| Quadrant | BADHDUFLAG | Total packets | Discarded packets |
| A | 0 | 14 | 0 |
| B | 0 | 15 | 0 |
| C | 0 | 15 | 0 |
| D | 0 | 15 | 0 |
| Mode M0 | |||
|---|---|---|---|
| Quadrant | BADHDUFLAG | Total packets | Discarded packets |
| A | 0 | 14226 | 0 |
| B | 0 | 18334 | 0 |
| C | 0 | 18640 | 0 |
| D | 0 | 26120 | 0 |
| Quadrant | Total seconds | Saturated seconds | Saturation percentage |
|---|---|---|---|
| A | 6282 | 75 | 1.193887% |
| B | 6282 | 407 | 6.478828% |
| C | 6282 | 409 | 6.510665% |
| D | 6282 | 1425 | 22.683859% |
Noise dominated data is calculated using 1-second bins in cleaned event files. If a bin has >2000 counts, and if more than 50% of those come from <1% of pixels, then it is considered to be noise-dominated and hence unusable.
| Quadrant | # 1 sec bins | Bins with >0 counts | Bins with >2000 counts | High rate bins dominated by noise | Noise dominated (total time) | Noise dominated (detector-on time) | Marked lightcurve |
|---|---|---|---|---|---|---|---|
| A | 7502 | 6282 | 2 | 2 | 0.03% | 0.03% | 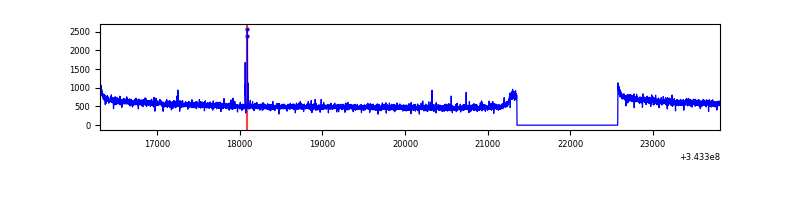 |
| B | 7502 | 6282 | 263 | 263 | 3.51% | 4.19% | 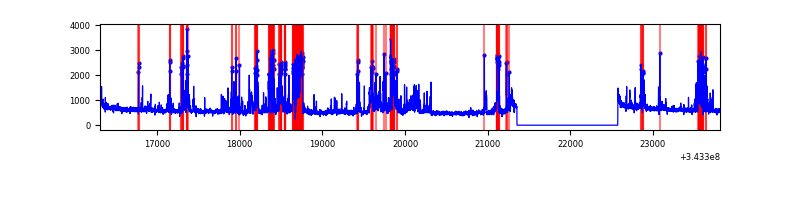 |
| C | 7502 | 6282 | 214 | 214 | 2.85% | 3.41% | 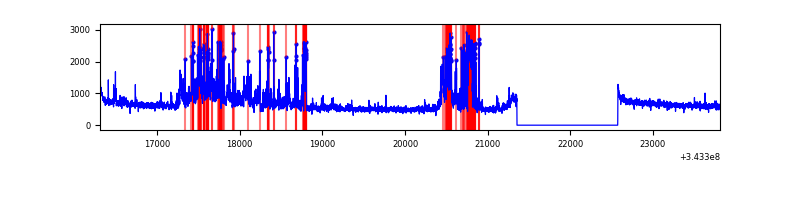 |
| D | 7502 | 6282 | 1260 | 1260 | 16.80% | 20.06% | 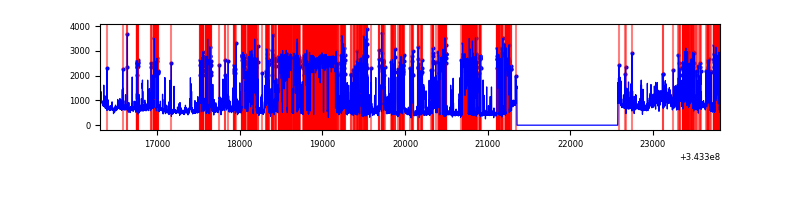 |
Top three noisy pixels from each quadrant. If the there are fewer than three noisy pixels in the level2.evt file, extra rows are filled as -1
| Pixel properties | Quadrant properties | ||||||
|---|---|---|---|---|---|---|---|
| Quadrant | DetID | PixID | Counts | Sigma | Mean | Median | Sigma |
| A | 0 | 31 | 11140 | 58.0 | 888 | 871 | 177.0 |
| A | 13 | 254 | 11119 | 57.88 | 888 | 871 | 177.0 |
| A | 3 | 137 | 7647 | 38.27 | 888 | 871 | 177.0 |
| B | 3 | 64 | 723779 | 4554.44 | 856 | 837 | 158.7 |
| B | 10 | 245 | 589627 | 3709.3 | 856 | 837 | 158.7 |
| B | 0 | 190 | 33714 | 207.12 | 856 | 837 | 158.7 |
| C | 3 | 233 | 1325593 | 6803.26 | 846 | 854 | 194.7 |
| C | 14 | 238 | 136918 | 698.76 | 846 | 854 | 194.7 |
| C | 4 | 175 | 11584 | 55.1 | 846 | 854 | 194.7 |
| D | 1 | 52 | 3696883 | 19804.82 | 786 | 766 | 186.6 |
| D | 13 | 104 | 265931 | 1420.83 | 786 | 766 | 186.6 |
| D | 2 | 250 | 198562 | 1059.85 | 786 | 766 | 186.6 |
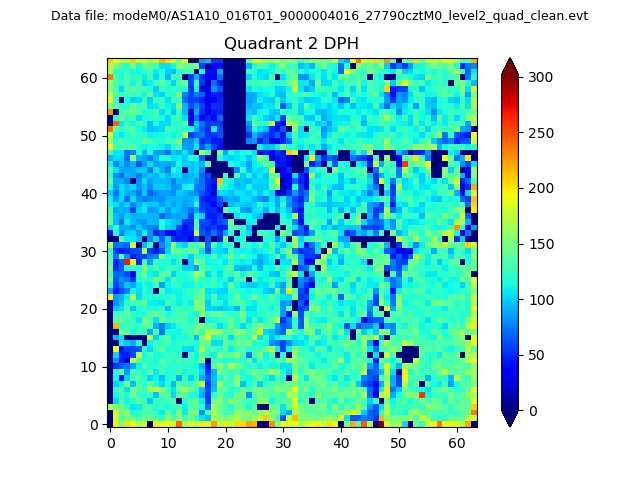
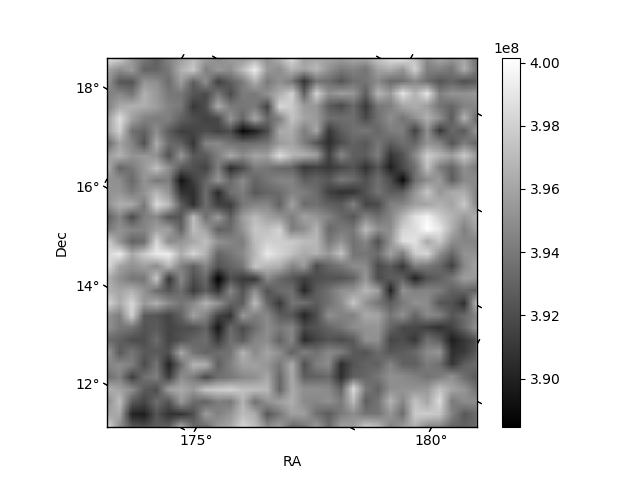
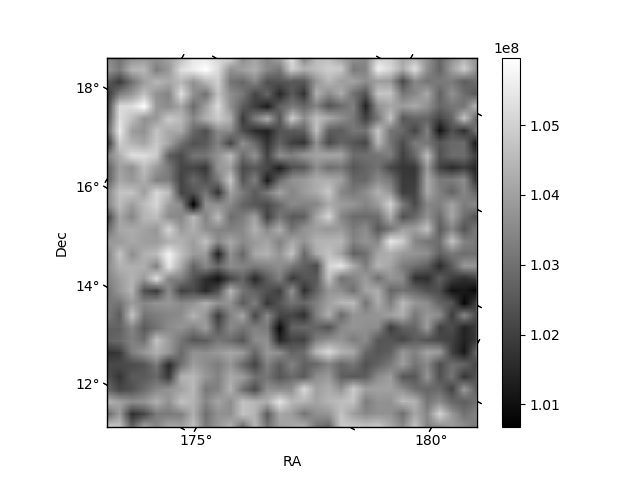
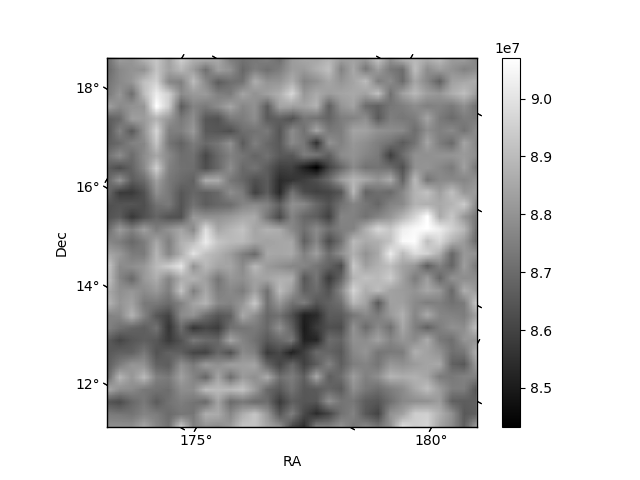
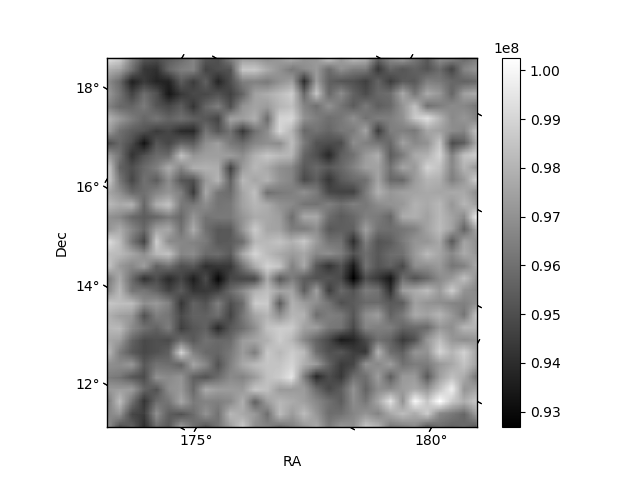
Histogram calculated using DETX and DETY for each event in the final _common_clean file
| Quadrant A | 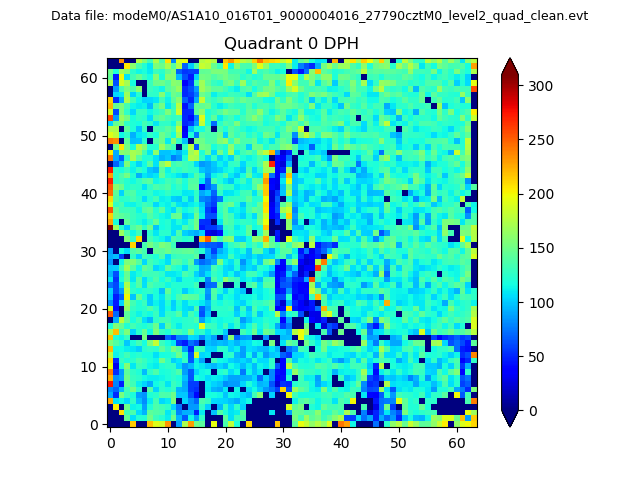 |
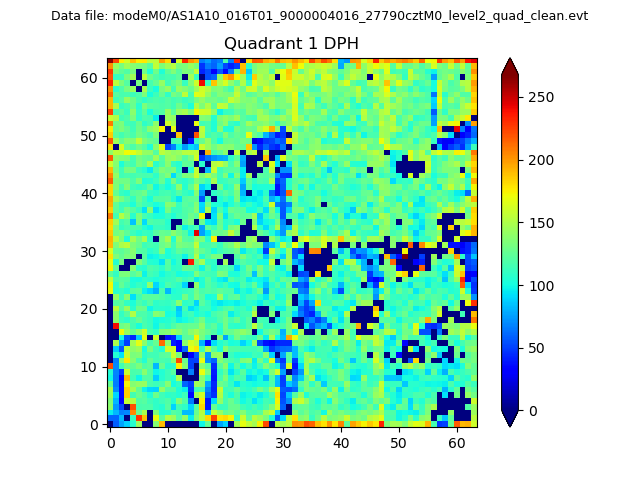 |
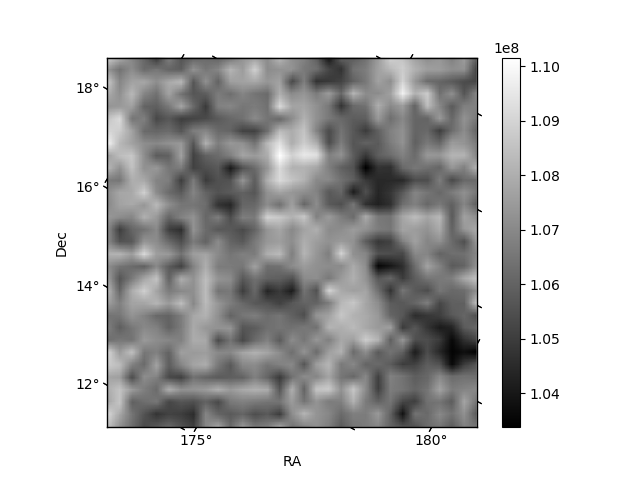
Quadrant B |
|---|---|---|---|
| Quadrant D | 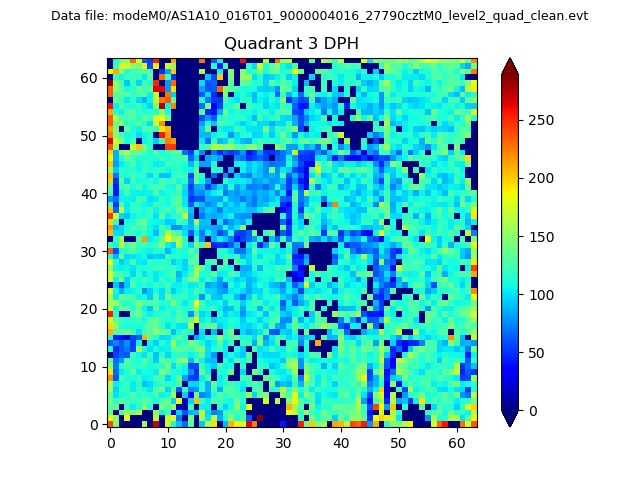 |
 |
Quadrant C |
| Plot type | Count rate plots | Images |
|---|---|---|
| Comparison with Poisson distribution Blue bars denote a histogram of data divided into 1 sec bins. Red curve is a Poisson curve with rate = median count rate of data. |
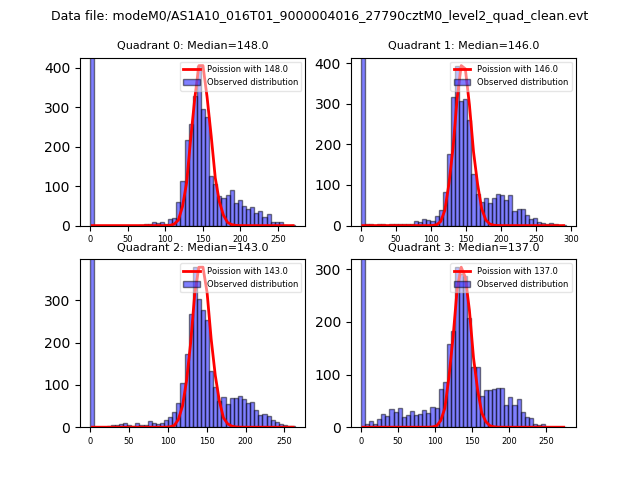 |
 |
| Quadrant-wise count rates Data is divided into 100 sec bins |
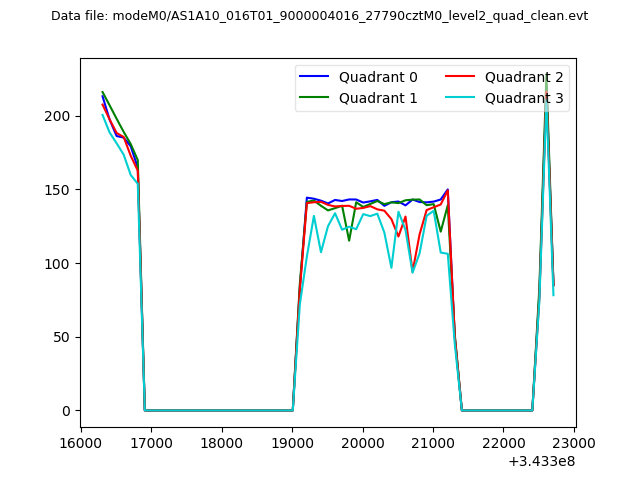 |
|
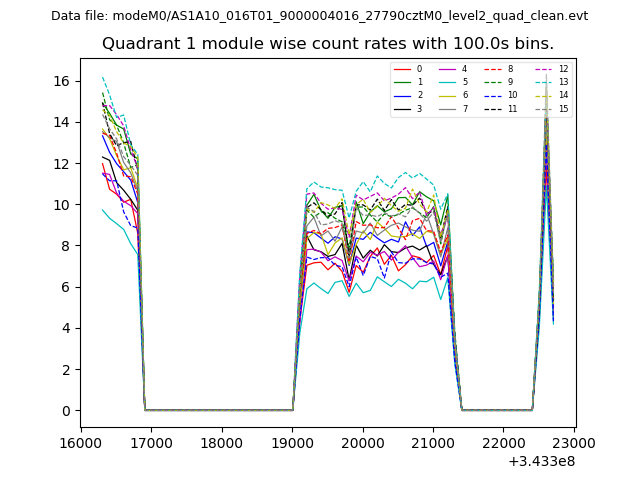
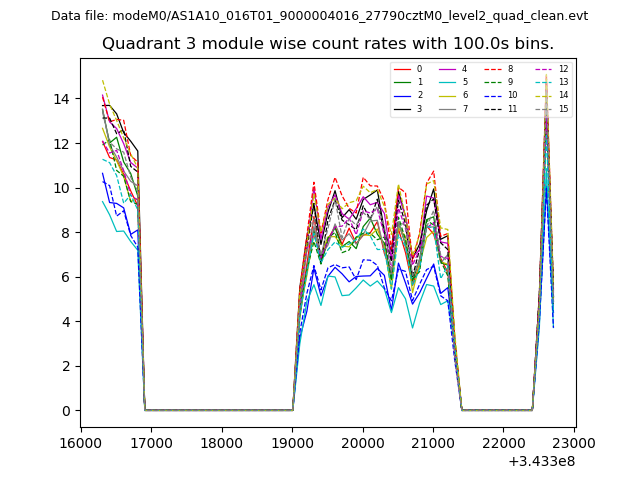
| Module-wise count rates for Quadrant A Data is divided into 100 sec bins |
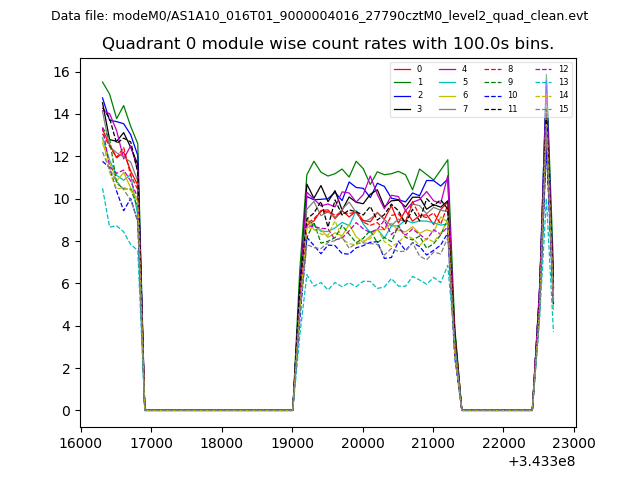 |
 |
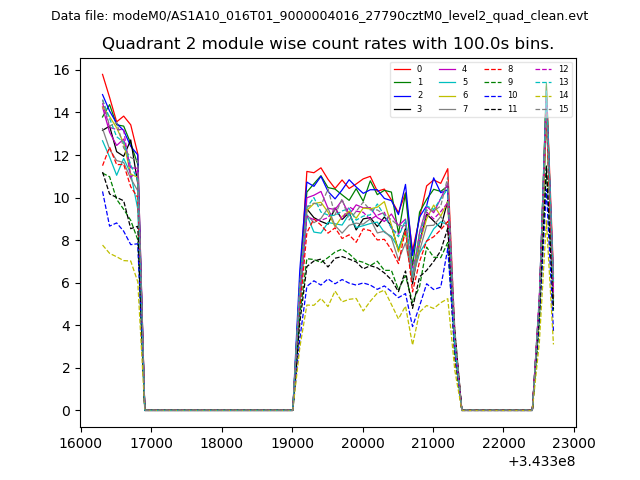
| Module-wise count rates for Quadrant B Data is divided into 100 sec bins |
 |
 |
| Module-wise count rates for Quadrant C Data is divided into 100 sec bins |
 |
 |
| Module-wise count rates for Quadrant D Data is divided into 100 sec bins |
 |
 |
| Parameter | Plot |
|---|---|
| CZT HV Monitor | 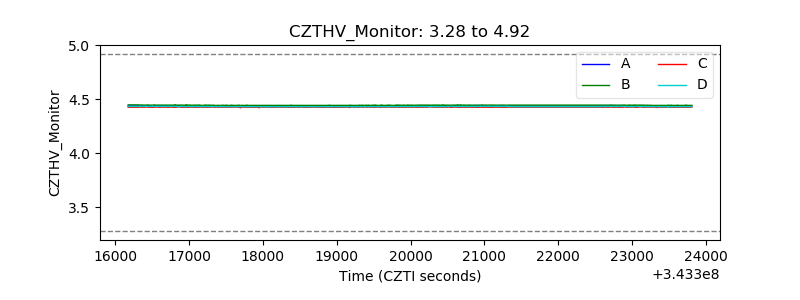 |
| D_VDD | 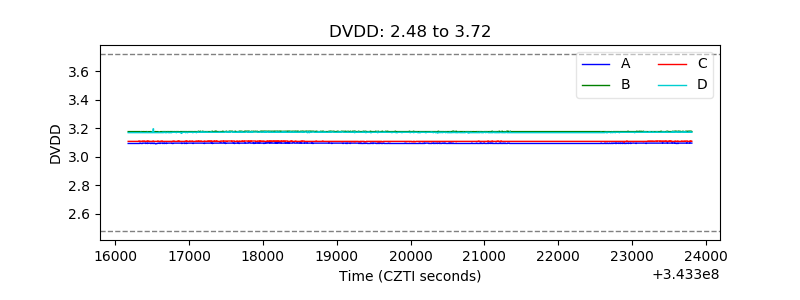 |
| Temperature 1 | 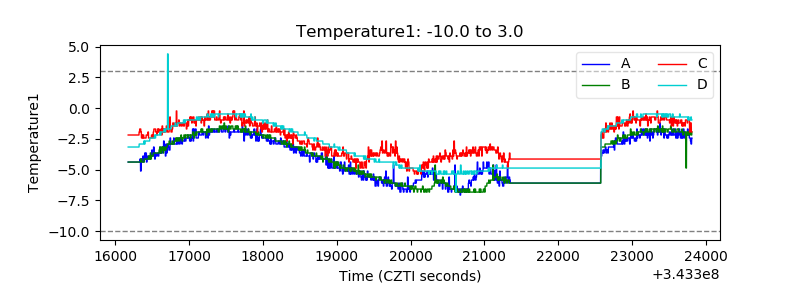 |
| Veto HV Monitor | 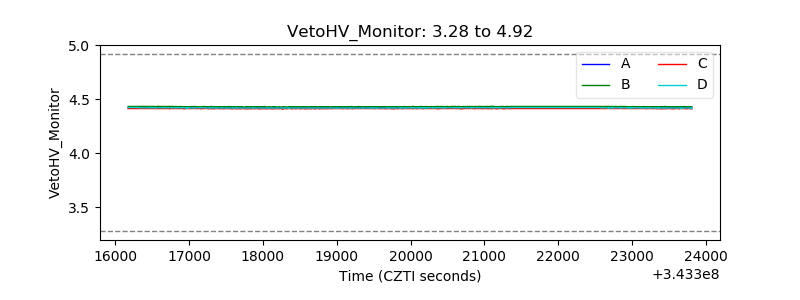 |
| Veto LLD | 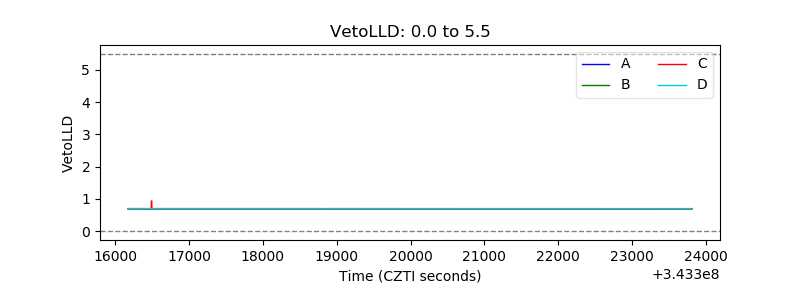 |
| Alpha Counter | 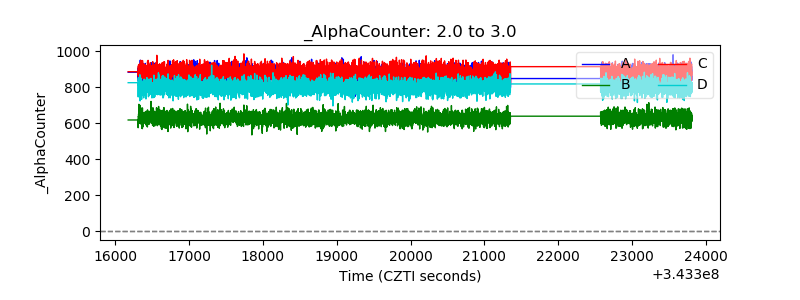 |
| _CPM_Rate | 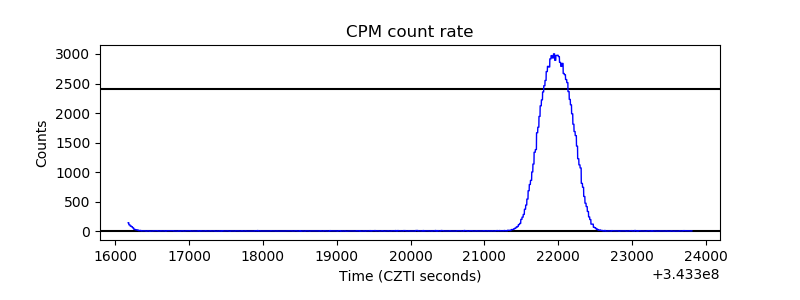 |
| CZT Counter | 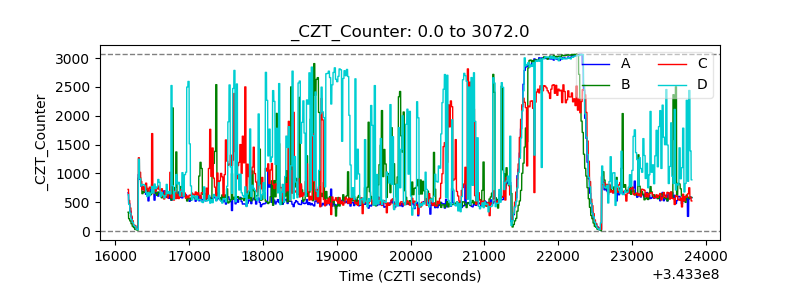 |
| +2.5 Volts monitor |  |
| +5 Volts monitor | 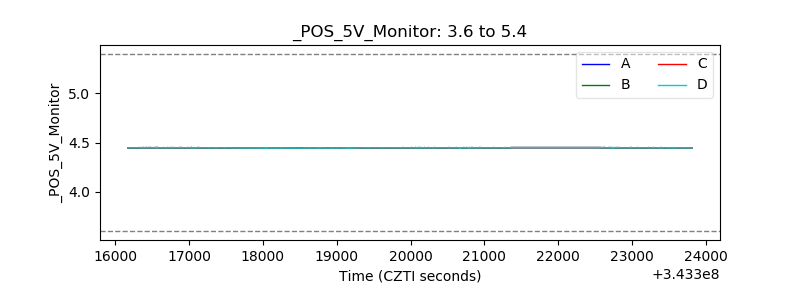 |
| _ROLL_ROT | 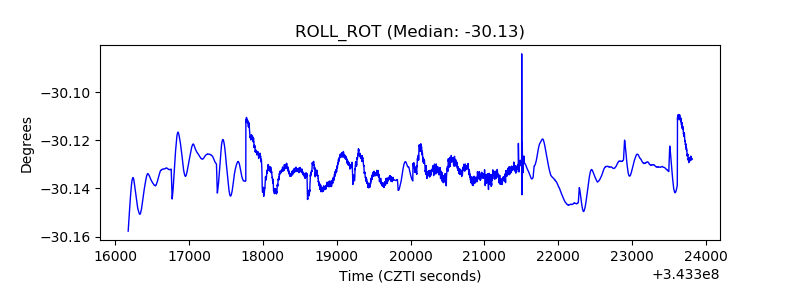 |
| _Roll_DEC | 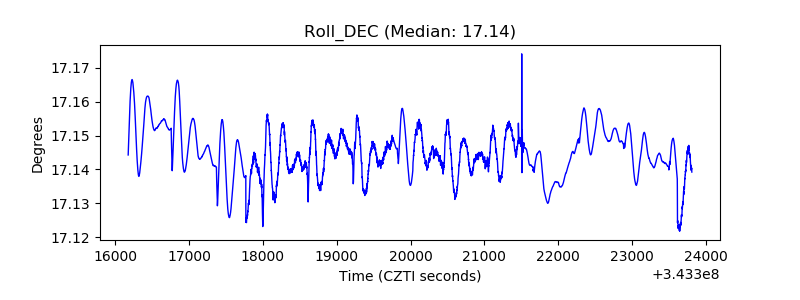 |
| _Roll_RA | 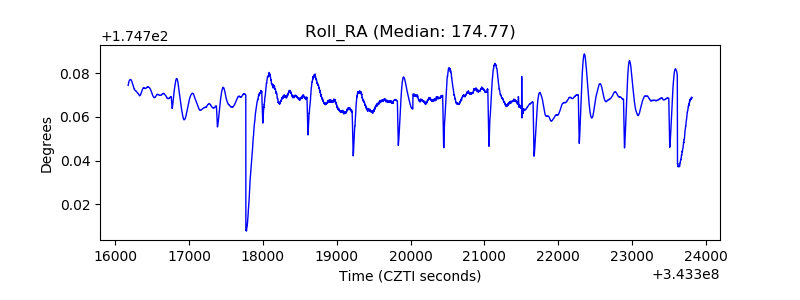 |
| Veto Counter | 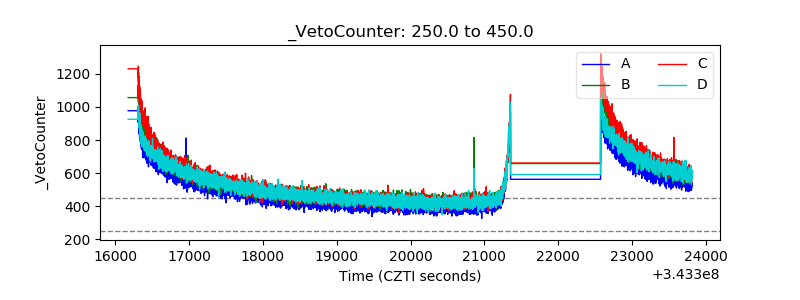 |