| Param | Original file | Final file |
|---|---|---|
| Filename | modeM0/AS1A10_016T01_9000004016_27791cztM0_level2.evt | modeM0/AS1A10_016T01_9000004016_27791cztM0_level2_quad_clean.evt |
| Size (bytes) | 663,932,160 | 61,752,960 |
| Size | 633.2 MB | 58.9 MB |
| Events in quadrant A | 3,543,001 | 379,471 |
| Events in quadrant B | 4,323,698 | 376,643 |
| Events in quadrant C | 3,713,002 | 369,167 |
| Events in quadrant D | 8,100,067 | 302,870 |
| Mode M9 | |||
|---|---|---|---|
| Quadrant | BADHDUFLAG | Total packets | Discarded packets |
| A | 0 | 13 | 0 |
| B | 0 | 13 | 0 |
| C | 0 | 13 | 0 |
| D | 0 | 13 | 0 |
| Mode M0 | |||
|---|---|---|---|
| Quadrant | BADHDUFLAG | Total packets | Discarded packets |
| A | 0 | 14633 | 0 |
| B | 0 | 17104 | 0 |
| C | 0 | 15277 | 0 |
| D | 0 | 28518 | 0 |
| Quadrant | Total seconds | Saturated seconds | Saturation percentage |
|---|---|---|---|
| A | 6320 | 98 | 1.550633% |
| B | 6321 | 328 | 5.189052% |
| C | 6321 | 179 | 2.831830% |
| D | 6320 | 1753 | 27.737342% |
Noise dominated data is calculated using 1-second bins in cleaned event files. If a bin has >2000 counts, and if more than 50% of those come from <1% of pixels, then it is considered to be noise-dominated and hence unusable.
| Quadrant | # 1 sec bins | Bins with >0 counts | Bins with >2000 counts | High rate bins dominated by noise | Noise dominated (total time) | Noise dominated (detector-on time) | Marked lightcurve |
|---|---|---|---|---|---|---|---|
| A | 7585 | 6320 | 1 | 1 | 0.01% | 0.02% | 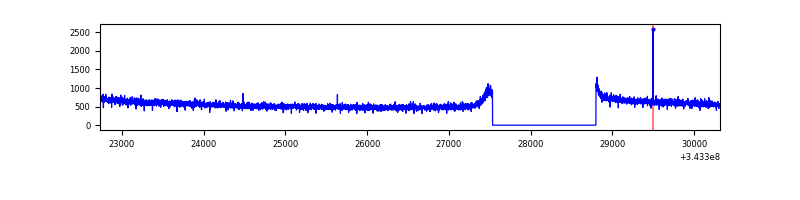 |
| B | 7586 | 6321 | 179 | 179 | 2.36% | 2.83% | 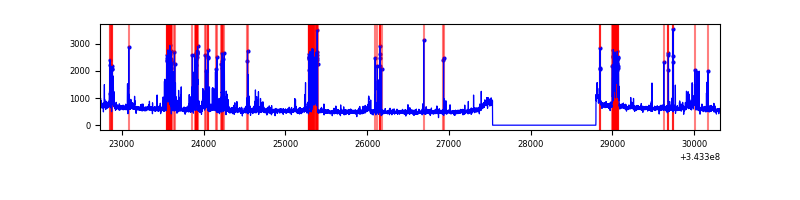 |
| C | 7586 | 6321 | 5 | 5 | 0.07% | 0.08% | 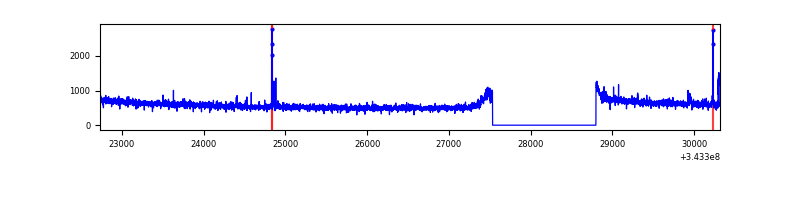 |
| D | 7584 | 6319 | 1506 | 1506 | 19.86% | 23.83% | 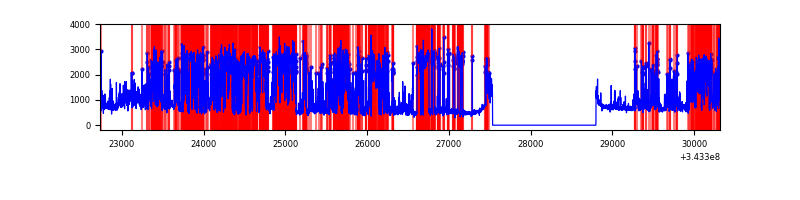 |
Top three noisy pixels from each quadrant. If the there are fewer than three noisy pixels in the level2.evt file, extra rows are filled as -1
| Pixel properties | Quadrant properties | ||||||
|---|---|---|---|---|---|---|---|
| Quadrant | DetID | PixID | Counts | Sigma | Mean | Median | Sigma |
| A | 13 | 254 | 11352 | 57.66 | 917 | 901 | 181.2 |
| A | 3 | 137 | 7946 | 38.87 | 917 | 901 | 181.2 |
| A | 0 | 226 | 7887 | 38.54 | 917 | 901 | 181.2 |
| B | 3 | 64 | 767826 | 4623.21 | 892 | 874 | 165.9 |
| B | 10 | 245 | 21630 | 125.11 | 892 | 874 | 165.9 |
| B | 0 | 190 | 19277 | 110.93 | 892 | 874 | 165.9 |
| C | 14 | 238 | 146827 | 708.62 | 890 | 900 | 205.9 |
| C | 3 | 233 | 90763 | 436.38 | 890 | 900 | 205.9 |
| C | 4 | 175 | 6579 | 27.58 | 890 | 900 | 205.9 |
| D | 1 | 52 | 4679606 | 24777.65 | 793 | 773 | 188.8 |
| D | 13 | 172 | 165489 | 872.28 | 793 | 773 | 188.8 |
| D | 13 | 104 | 122121 | 642.62 | 793 | 773 | 188.8 |
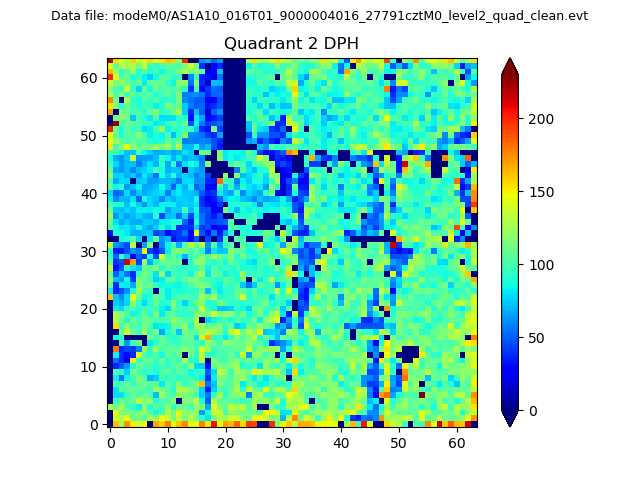
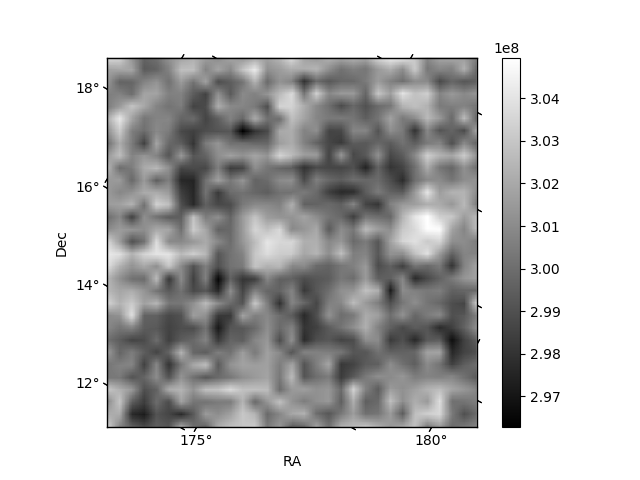
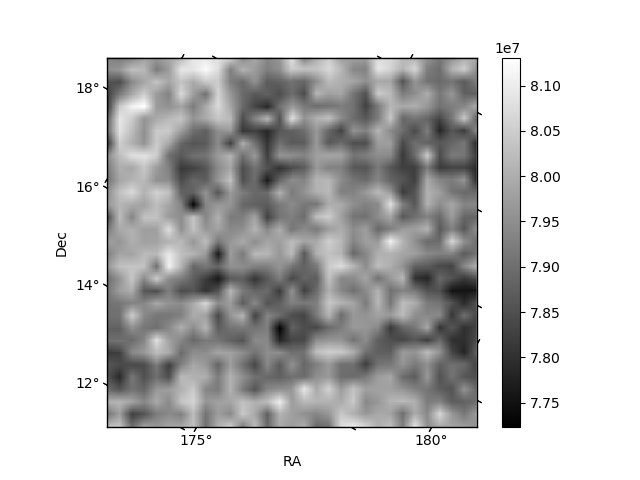
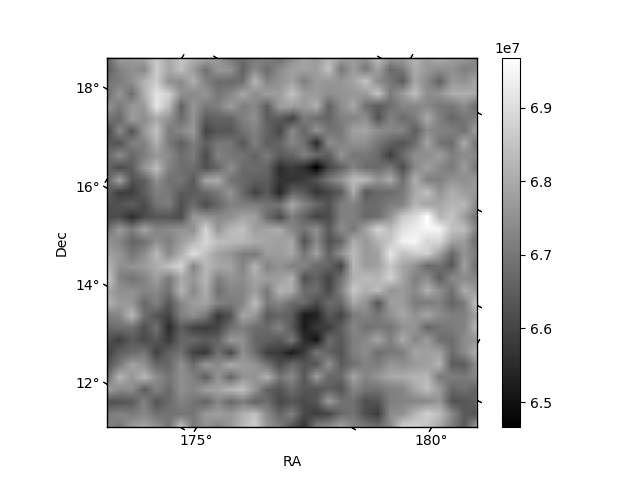
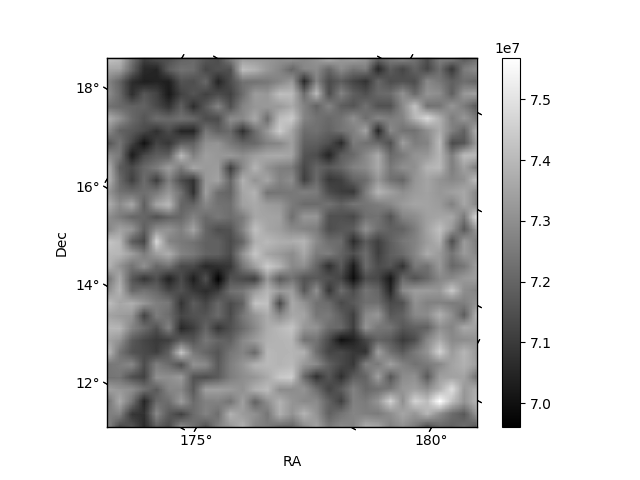
Histogram calculated using DETX and DETY for each event in the final _common_clean file
| Quadrant A | 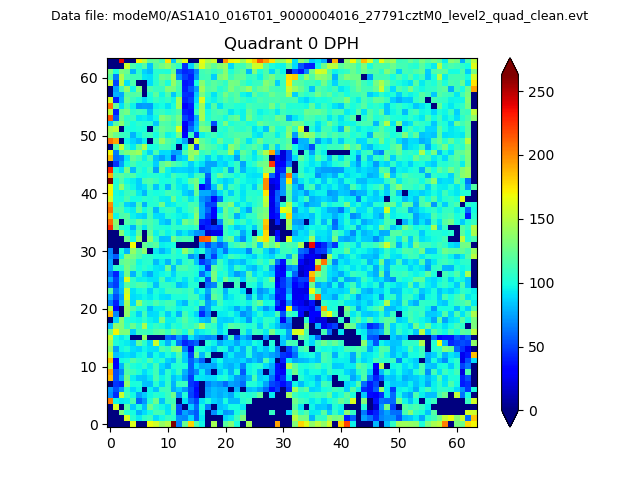 |
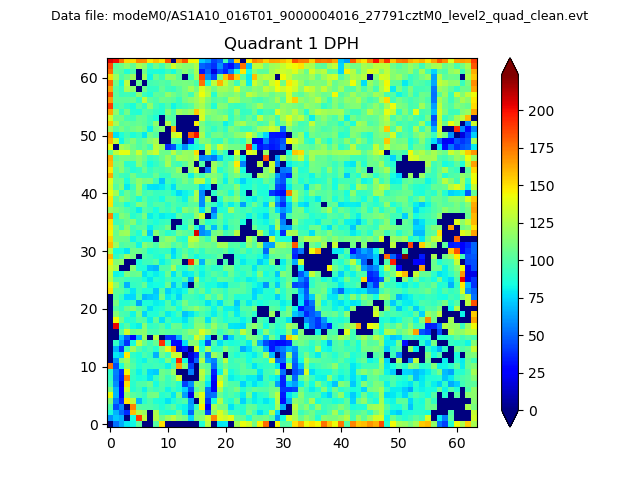 |
Quadrant B |
|---|---|---|---|
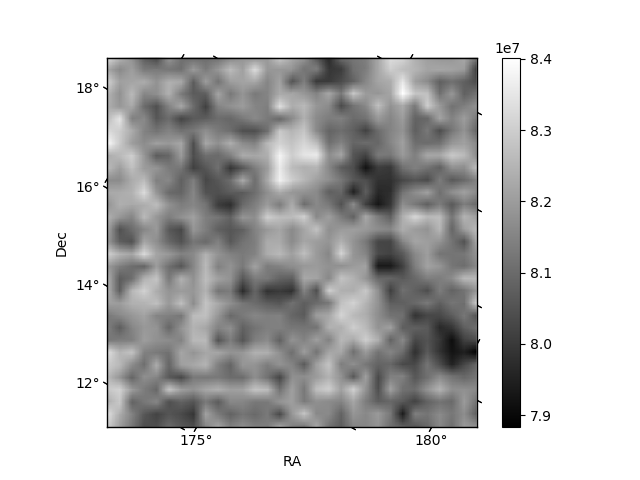
| Quadrant D | 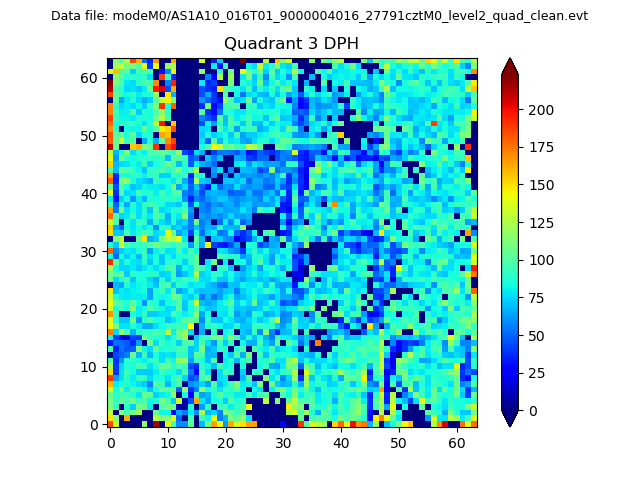 |
 |
Quadrant C |
| Plot type | Count rate plots | Images |
|---|---|---|
| Comparison with Poisson distribution Blue bars denote a histogram of data divided into 1 sec bins. Red curve is a Poisson curve with rate = median count rate of data. |
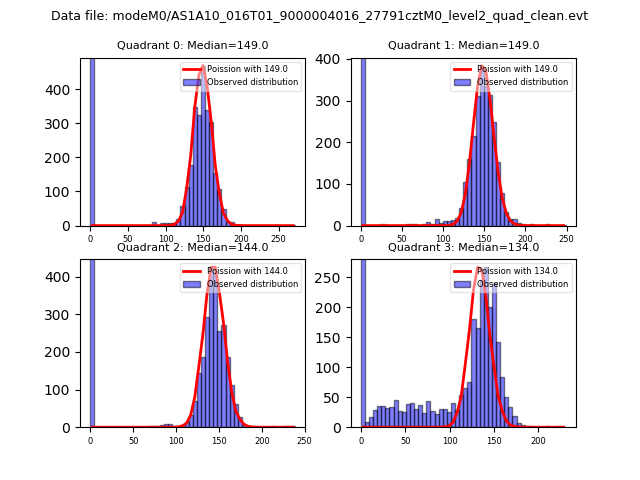 |
 |
| Quadrant-wise count rates Data is divided into 100 sec bins |
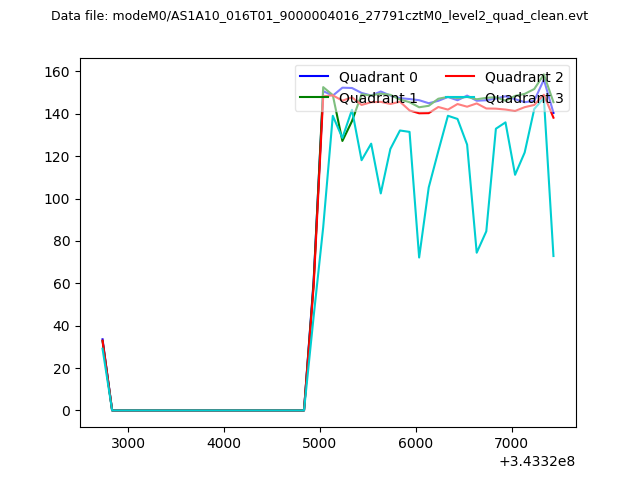 |
|
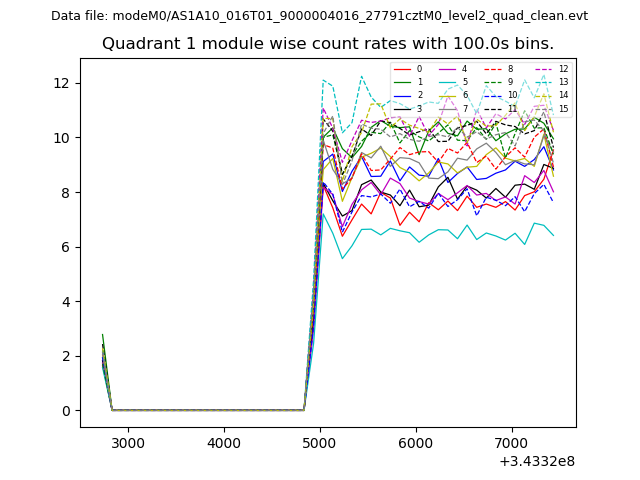
| Module-wise count rates for Quadrant A Data is divided into 100 sec bins |
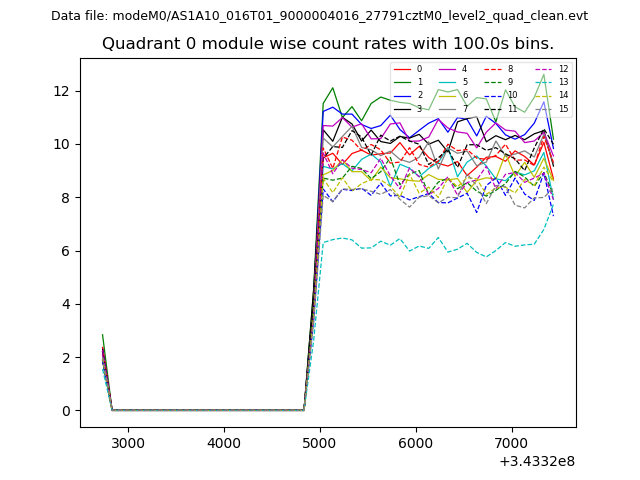 |
 |
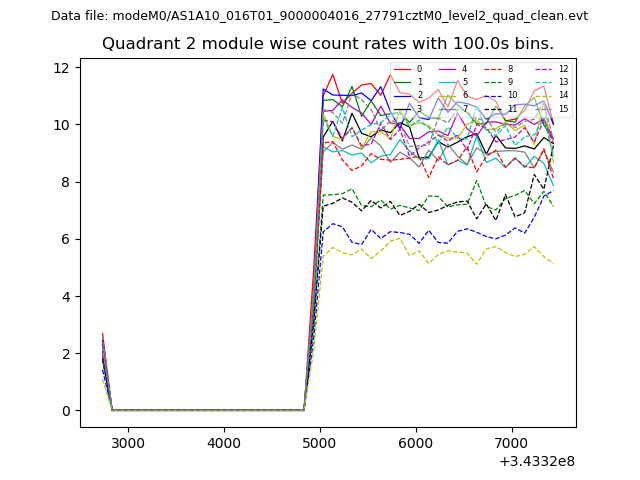
| Module-wise count rates for Quadrant B Data is divided into 100 sec bins |
 |
 |
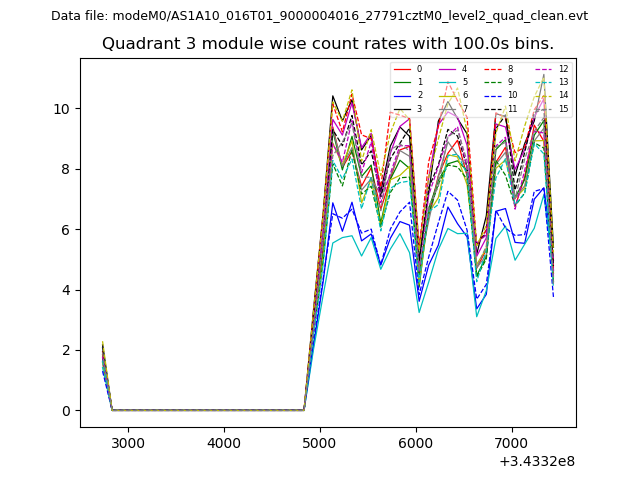
| Module-wise count rates for Quadrant C Data is divided into 100 sec bins |
 |
 |
| Module-wise count rates for Quadrant D Data is divided into 100 sec bins |
 |
 |
| Parameter | Plot |
|---|---|
| CZT HV Monitor | 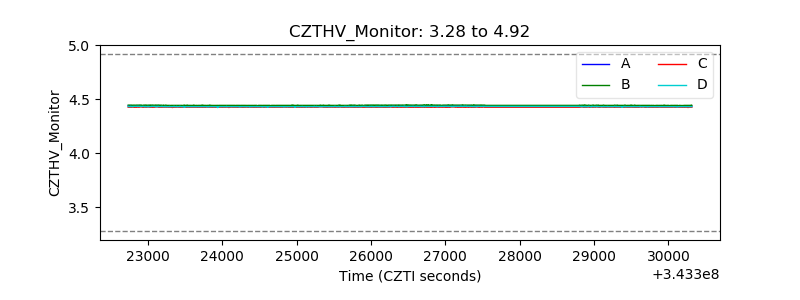 |
| D_VDD | 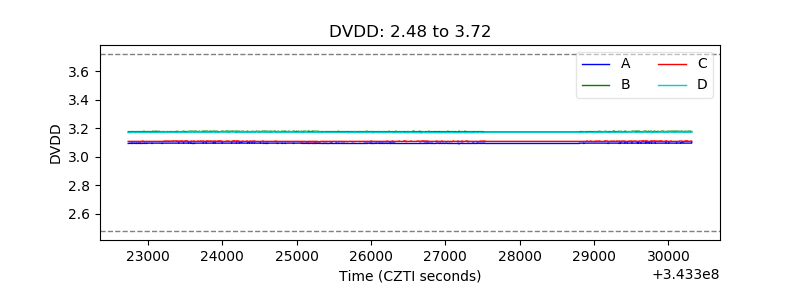 |
| Temperature 1 | 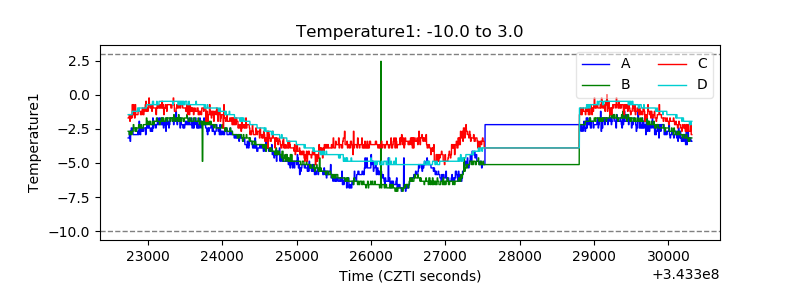 |
| Veto HV Monitor | 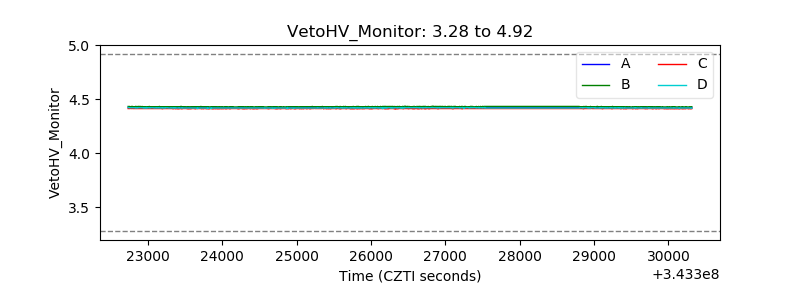 |
| Veto LLD | 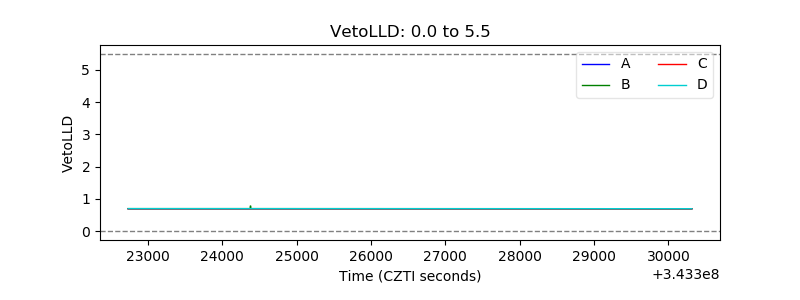 |
| Alpha Counter | 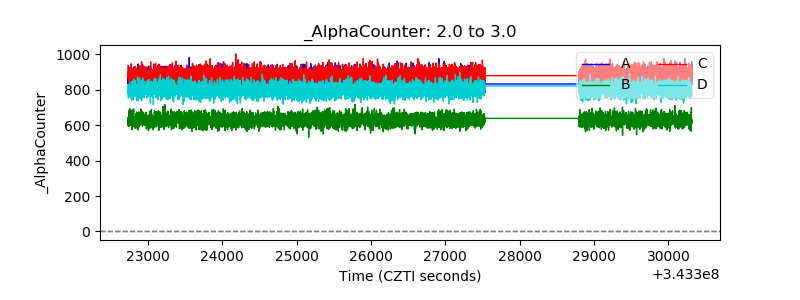 |
| _CPM_Rate | 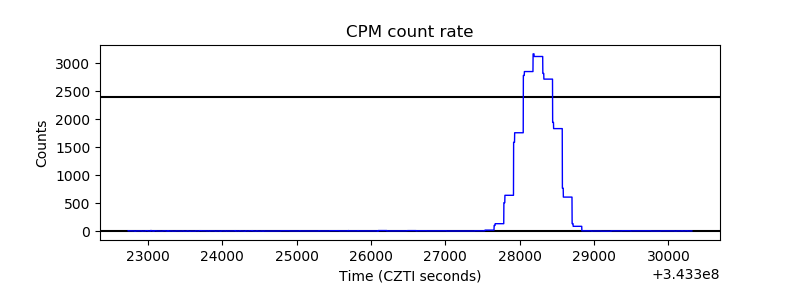 |
| CZT Counter | 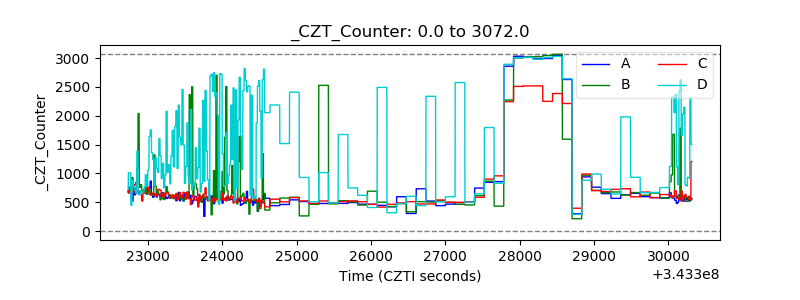 |
| +2.5 Volts monitor | 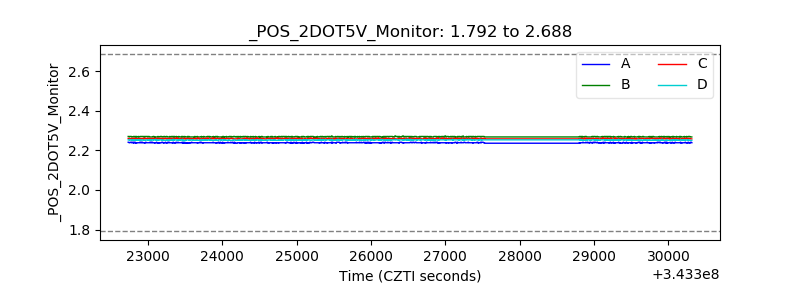 |
| +5 Volts monitor |  |
| _ROLL_ROT | 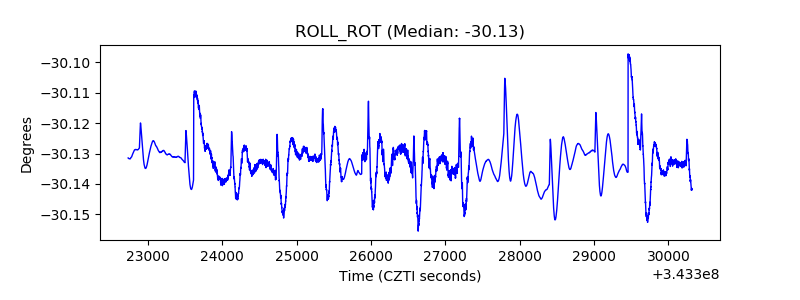 |
| _Roll_DEC | 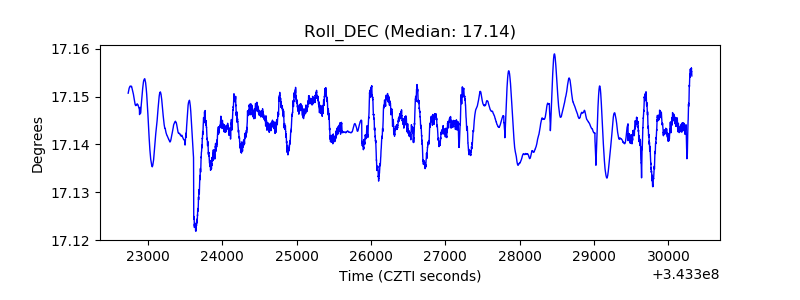 |
| _Roll_RA | 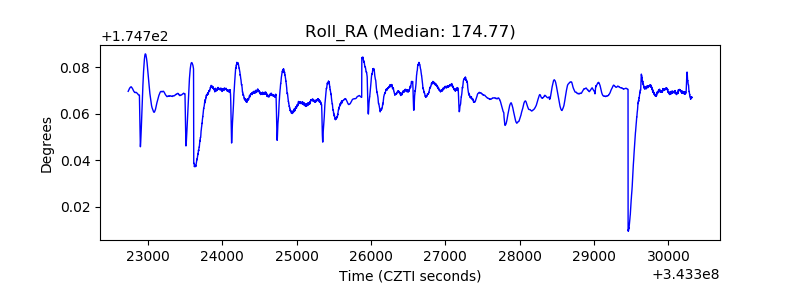 |
| Veto Counter | 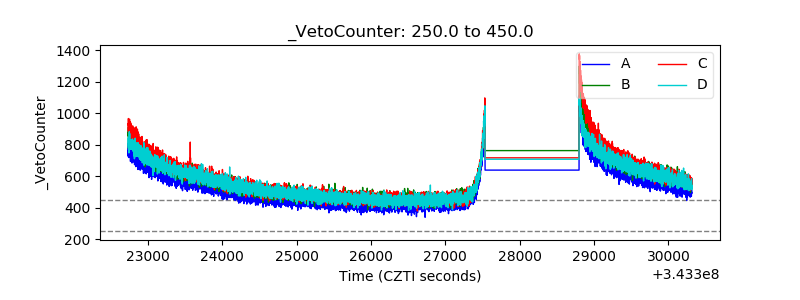 |