| Param | Original file | Final file |
|---|---|---|
| Filename | modeM0/AS1A10_016T01_9000004016_27792cztM0_level2.evt | modeM0/AS1A10_016T01_9000004016_27792cztM0_level2_quad_clean.evt |
| Size (bytes) | 619,680,960 | 69,428,160 |
| Size | 591.0 MB | 66.2 MB |
| Events in quadrant A | 3,520,225 | 431,418 |
| Events in quadrant B | 4,282,154 | 433,566 |
| Events in quadrant C | 3,781,634 | 420,640 |
| Events in quadrant D | 6,757,817 | 377,736 |
| Mode M9 | |||
|---|---|---|---|
| Quadrant | BADHDUFLAG | Total packets | Discarded packets |
| A | 0 | 17 | 0 |
| B | 0 | 18 | 0 |
| C | 0 | 18 | 0 |
| D | 0 | 18 | 0 |
| Mode M0 | |||
|---|---|---|---|
| Quadrant | BADHDUFLAG | Total packets | Discarded packets |
| A | 0 | 14581 | 0 |
| B | 0 | 16908 | 0 |
| C | 0 | 15493 | 0 |
| D | 0 | 24618 | 0 |
| Quadrant | Total seconds | Saturated seconds | Saturation percentage |
|---|---|---|---|
| A | 6282 | 55 | 0.875517% |
| B | 6282 | 365 | 5.810252% |
| C | 6282 | 160 | 2.546960% |
| D | 6281 | 1132 | 18.022608% |
Noise dominated data is calculated using 1-second bins in cleaned event files. If a bin has >2000 counts, and if more than 50% of those come from <1% of pixels, then it is considered to be noise-dominated and hence unusable.
| Quadrant | # 1 sec bins | Bins with >0 counts | Bins with >2000 counts | High rate bins dominated by noise | Noise dominated (total time) | Noise dominated (detector-on time) | Marked lightcurve |
|---|---|---|---|---|---|---|---|
| A | 7637 | 6283 | 1 | 1 | 0.01% | 0.02% | 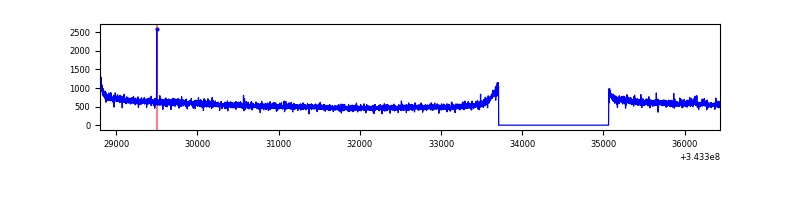 |
| B | 7637 | 6283 | 163 | 163 | 2.13% | 2.59% | 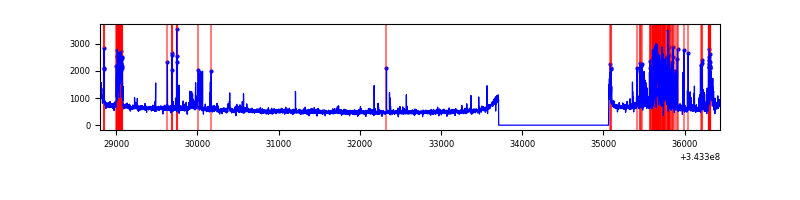 |
| C | 7637 | 6282 | 11 | 11 | 0.14% | 0.18% | 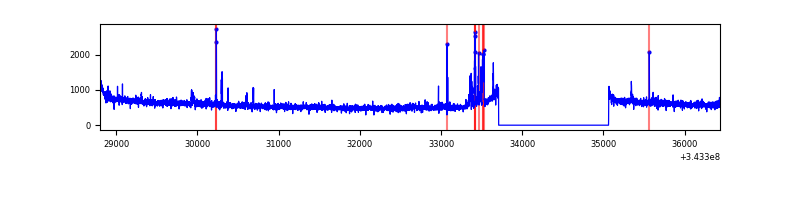 |
| D | 7635 | 6280 | 989 | 989 | 12.95% | 15.75% | 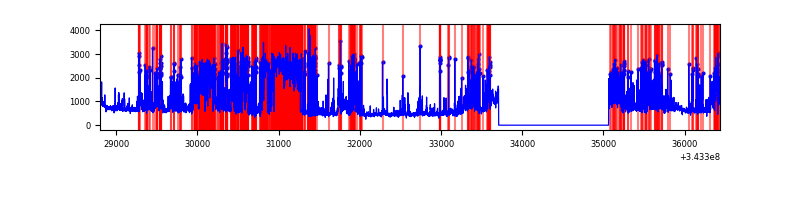 |
Top three noisy pixels from each quadrant. If the there are fewer than three noisy pixels in the level2.evt file, extra rows are filled as -1
| Pixel properties | Quadrant properties | ||||||
|---|---|---|---|---|---|---|---|
| Quadrant | DetID | PixID | Counts | Sigma | Mean | Median | Sigma |
| A | 13 | 254 | 11566 | 59.08 | 909 | 895 | 180.6 |
| A | 4 | 2 | 10428 | 52.78 | 909 | 895 | 180.6 |
| A | 3 | 137 | 7858 | 38.55 | 909 | 895 | 180.6 |
| B | 3 | 64 | 700474 | 4253.41 | 884 | 866 | 164.5 |
| B | 10 | 245 | 92000 | 554.07 | 884 | 866 | 164.5 |
| B | 15 | 32 | 26657 | 156.8 | 884 | 866 | 164.5 |
| C | 3 | 233 | 189983 | 931.33 | 883 | 892 | 203.0 |
| C | 14 | 238 | 144272 | 706.19 | 883 | 892 | 203.0 |
| C | 13 | 61 | 6075 | 25.53 | 883 | 892 | 203.0 |
| D | 1 | 52 | 3410305 | 17293.31 | 832 | 810 | 197.2 |
| D | 2 | 250 | 66180 | 331.56 | 832 | 810 | 197.2 |
| D | 13 | 172 | 57374 | 286.9 | 832 | 810 | 197.2 |
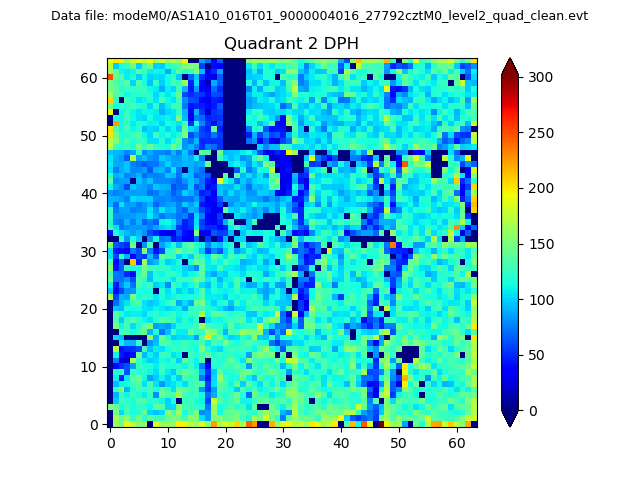
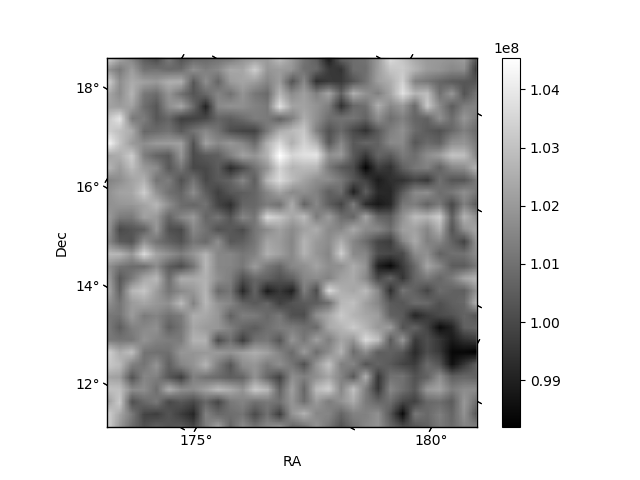
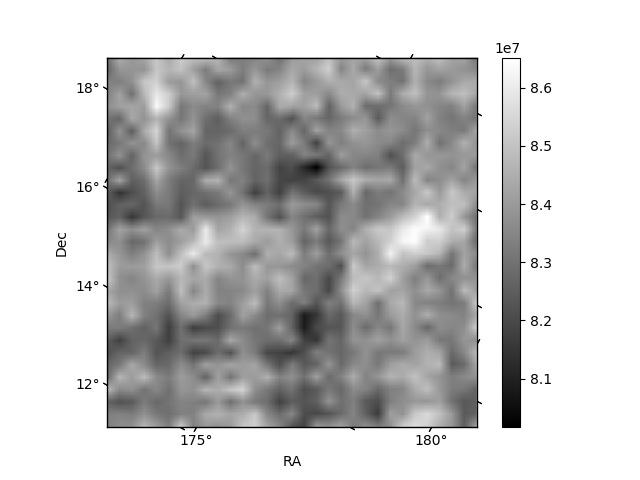
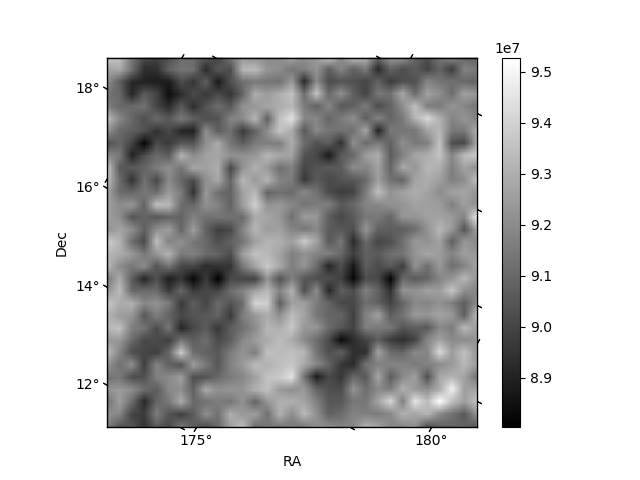
Histogram calculated using DETX and DETY for each event in the final _common_clean file
| Quadrant A | 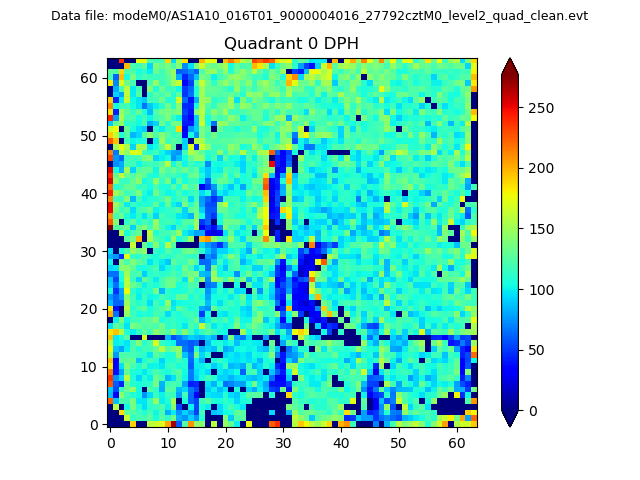 |
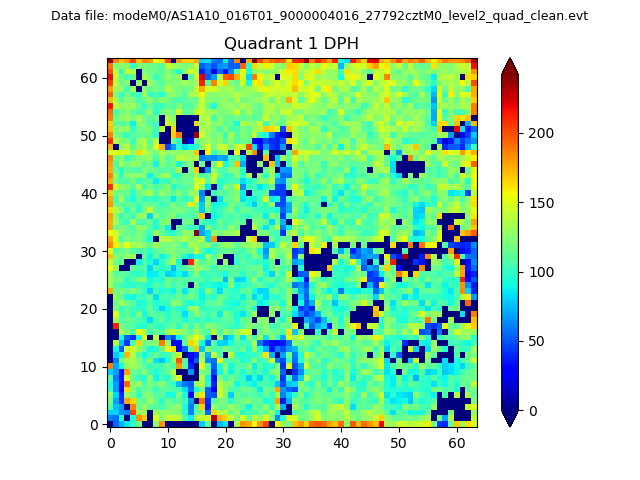 |
Quadrant B |
|---|---|---|---|
| Quadrant D | 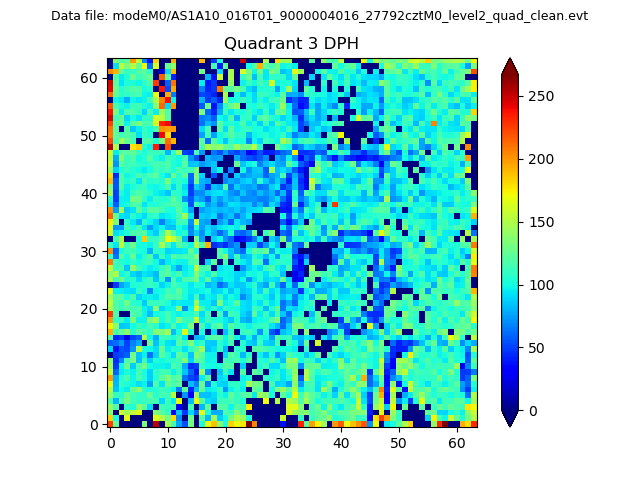 |
 |
Quadrant C |
| Plot type | Count rate plots | Images |
|---|---|---|
| Comparison with Poisson distribution Blue bars denote a histogram of data divided into 1 sec bins. Red curve is a Poisson curve with rate = median count rate of data. |
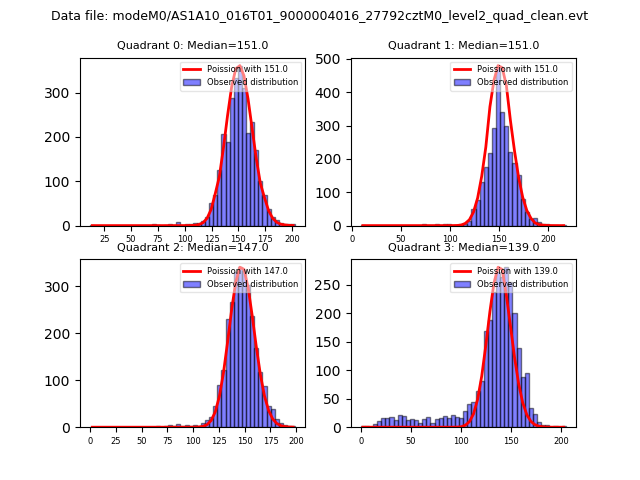 |
 |
| Quadrant-wise count rates Data is divided into 100 sec bins |
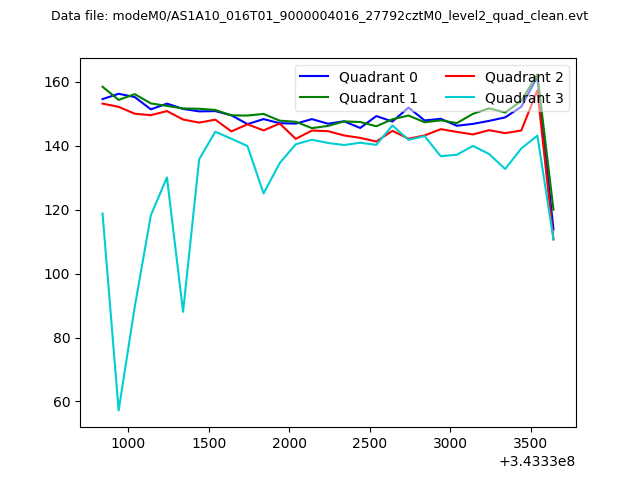 |
|
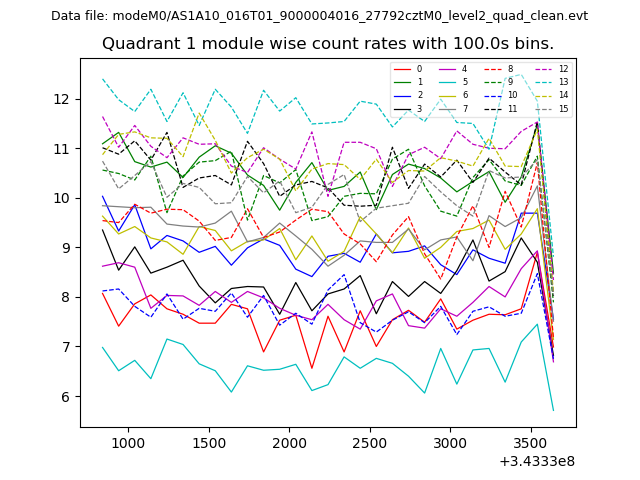
| Module-wise count rates for Quadrant A Data is divided into 100 sec bins |
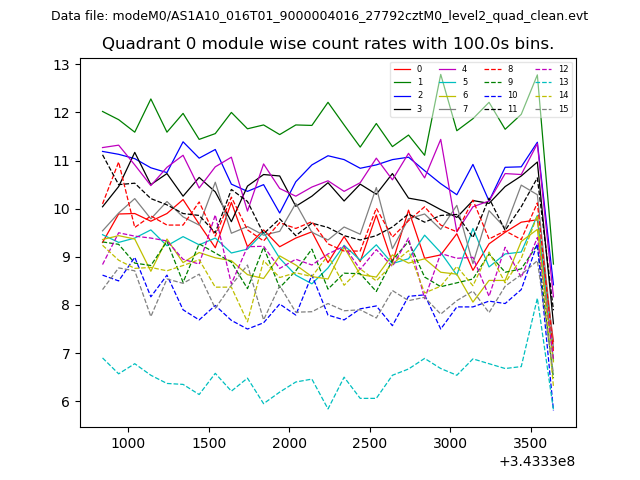 |
 |
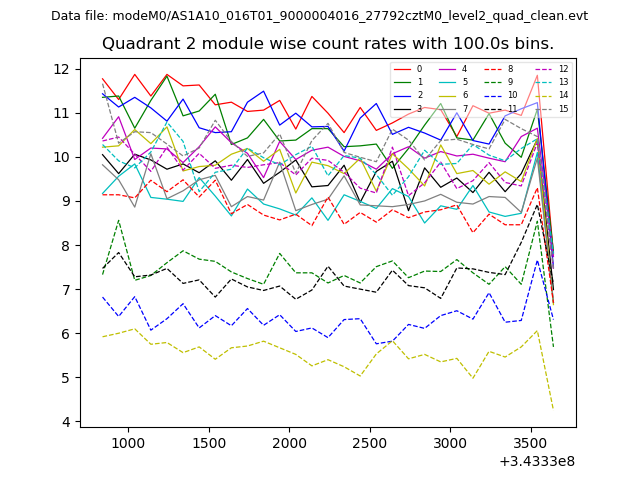
| Module-wise count rates for Quadrant B Data is divided into 100 sec bins |
 |
 |
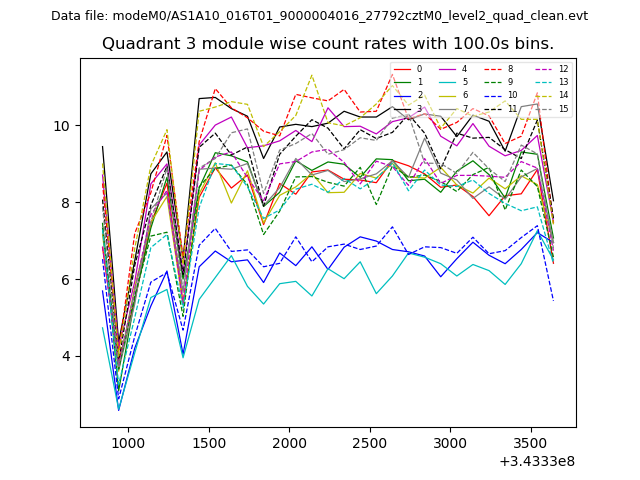
| Module-wise count rates for Quadrant C Data is divided into 100 sec bins |
 |
 |
| Module-wise count rates for Quadrant D Data is divided into 100 sec bins |
 |
 |
| Parameter | Plot |
|---|---|
| CZT HV Monitor | 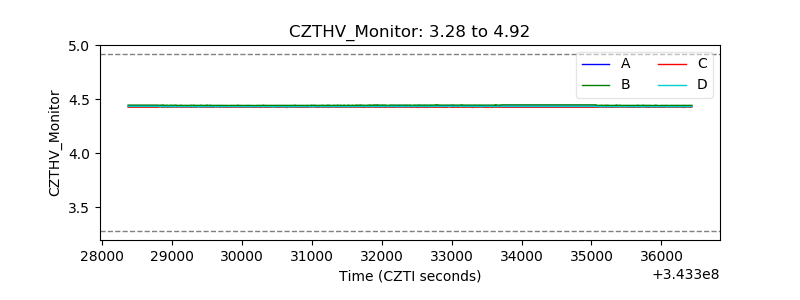 |
| D_VDD | 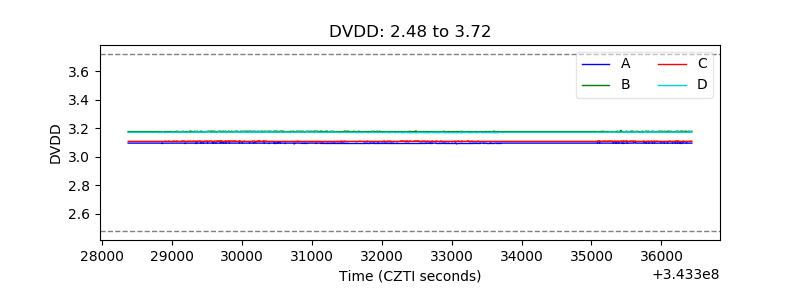 |
| Temperature 1 | 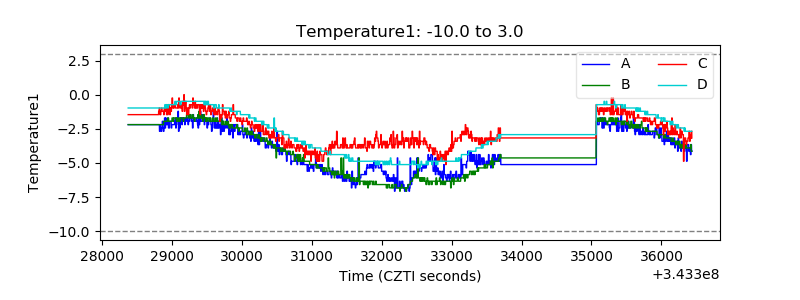 |
| Veto HV Monitor | 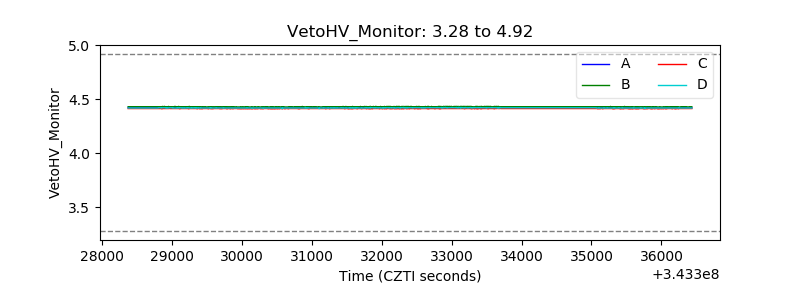 |
| Veto LLD | 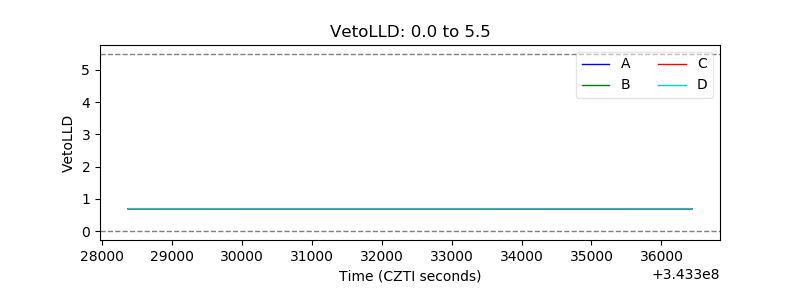 |
| Alpha Counter | 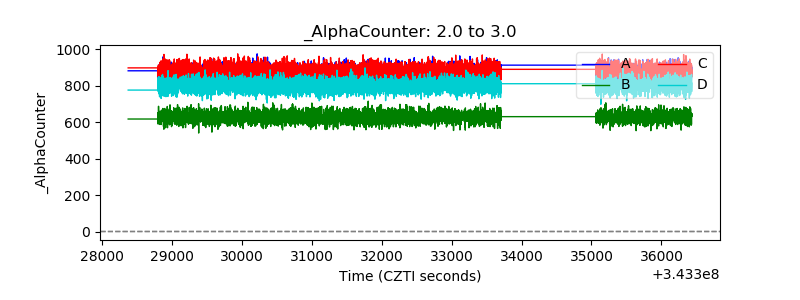 |
| _CPM_Rate | 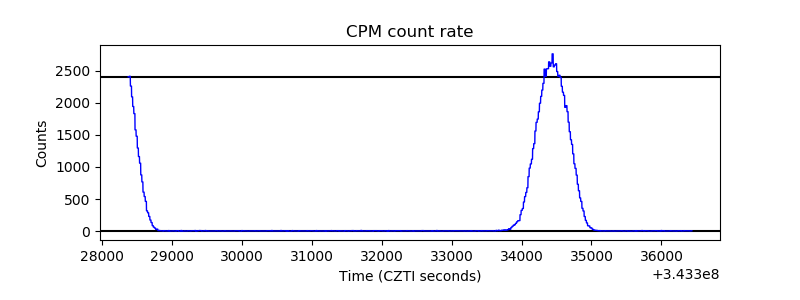 |
| CZT Counter | 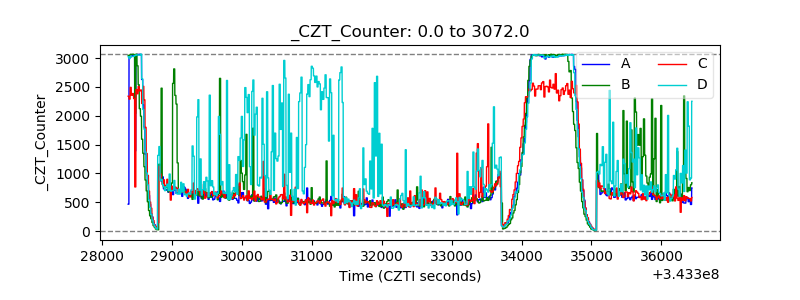 |
| +2.5 Volts monitor |  |
| +5 Volts monitor |  |
| _ROLL_ROT | 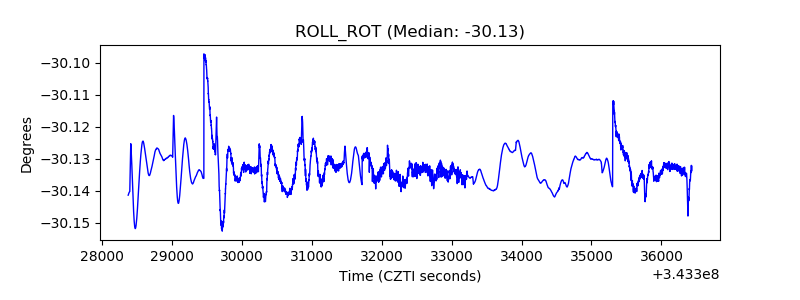 |
| _Roll_DEC | 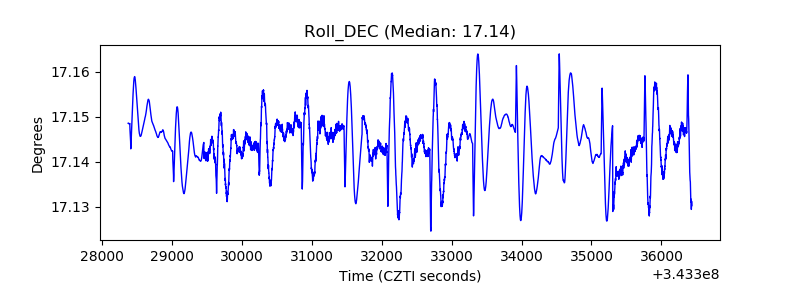 |
| _Roll_RA |  |
| Veto Counter | 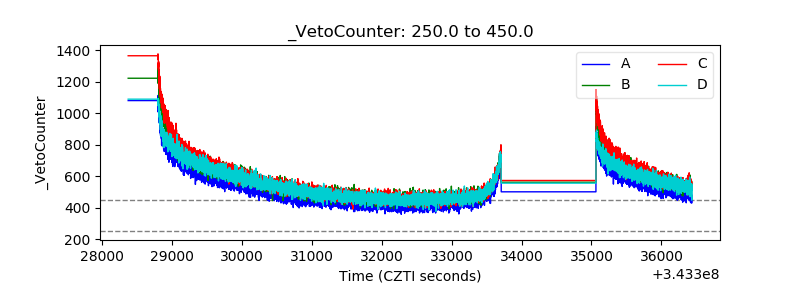 |