| Param | Original file | Final file |
|---|---|---|
| Filename | modeM0/AS1A10_016T01_9000004016_27793cztM0_level2.evt | modeM0/AS1A10_016T01_9000004016_27793cztM0_level2_quad_clean.evt |
| Size (bytes) | 590,186,880 | 77,705,280 |
| Size | 562.8 MB | 74.1 MB |
| Events in quadrant A | 3,187,915 | 500,517 |
| Events in quadrant B | 4,816,663 | 487,027 |
| Events in quadrant C | 3,316,719 | 490,635 |
| Events in quadrant D | 6,144,946 | 453,908 |
| Mode M9 | |||
|---|---|---|---|
| Quadrant | BADHDUFLAG | Total packets | Discarded packets |
| A | 0 | 13 | 0 |
| B | 0 | 13 | 0 |
| C | 0 | 13 | 0 |
| D | 0 | 13 | 0 |
| Mode M0 | |||
|---|---|---|---|
| Quadrant | BADHDUFLAG | Total packets | Discarded packets |
| A | 0 | 13197 | 0 |
| B | 0 | 18234 | 0 |
| C | 0 | 13680 | 0 |
| D | 0 | 22429 | 0 |
| Quadrant | Total seconds | Saturated seconds | Saturation percentage |
|---|---|---|---|
| A | 6021 | 56 | 0.930078% |
| B | 6022 | 584 | 9.697775% |
| C | 6022 | 107 | 1.776818% |
| D | 6022 | 906 | 15.044836% |
Noise dominated data is calculated using 1-second bins in cleaned event files. If a bin has >2000 counts, and if more than 50% of those come from <1% of pixels, then it is considered to be noise-dominated and hence unusable.
| Quadrant | # 1 sec bins | Bins with >0 counts | Bins with >2000 counts | High rate bins dominated by noise | Noise dominated (total time) | Noise dominated (detector-on time) | Marked lightcurve |
|---|---|---|---|---|---|---|---|
| A | 7291 | 6021 | 0 | 0 | 0.00% | 0.00% | 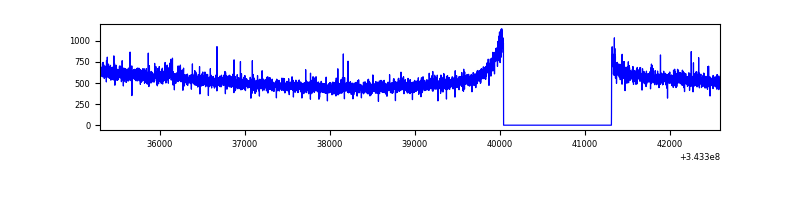 |
| B | 7292 | 6022 | 361 | 361 | 4.95% | 5.99% | 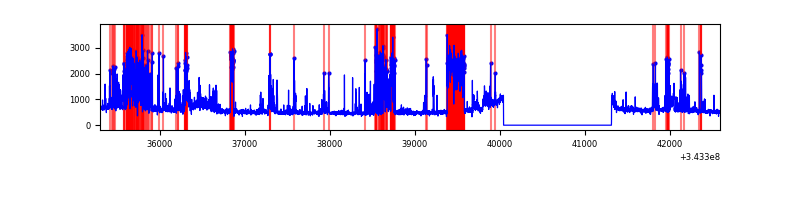 |
| C | 7292 | 6022 | 1 | 1 | 0.01% | 0.02% | 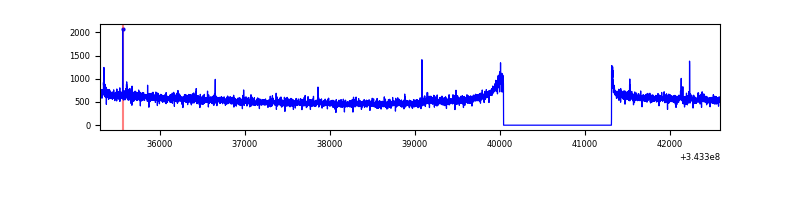 |
| D | 7292 | 6022 | 750 | 750 | 10.29% | 12.45% | 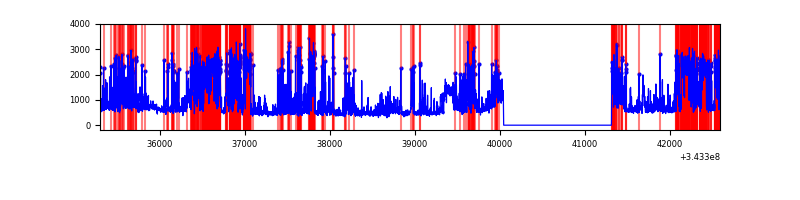 |
Top three noisy pixels from each quadrant. If the there are fewer than three noisy pixels in the level2.evt file, extra rows are filled as -1
| Pixel properties | Quadrant properties | ||||||
|---|---|---|---|---|---|---|---|
| Quadrant | DetID | PixID | Counts | Sigma | Mean | Median | Sigma |
| A | 4 | 2 | 13368 | 75.9 | 823 | 808 | 165.5 |
| A | 13 | 254 | 11204 | 62.82 | 823 | 808 | 165.5 |
| A | 3 | 137 | 7272 | 39.06 | 823 | 808 | 165.5 |
| B | 3 | 64 | 1502243 | 10093.5 | 793 | 777 | 148.8 |
| B | 10 | 245 | 96494 | 643.45 | 793 | 777 | 148.8 |
| B | 10 | 246 | 81199 | 540.63 | 793 | 777 | 148.8 |
| C | 14 | 238 | 130096 | 698.41 | 797 | 808 | 185.1 |
| C | 3 | 233 | 70361 | 375.72 | 797 | 808 | 185.1 |
| C | 4 | 175 | 5860 | 27.29 | 797 | 808 | 185.1 |
| D | 1 | 52 | 3153447 | 17465.58 | 756 | 737 | 180.5 |
| D | 2 | 250 | 79177 | 434.55 | 756 | 737 | 180.5 |
| D | 14 | 35 | 27175 | 146.46 | 756 | 737 | 180.5 |
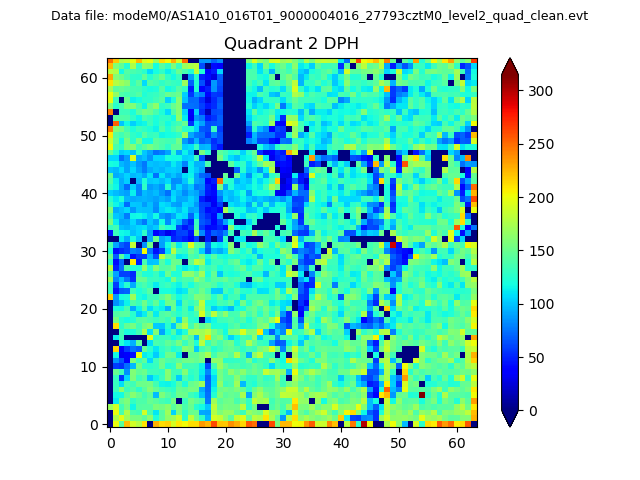
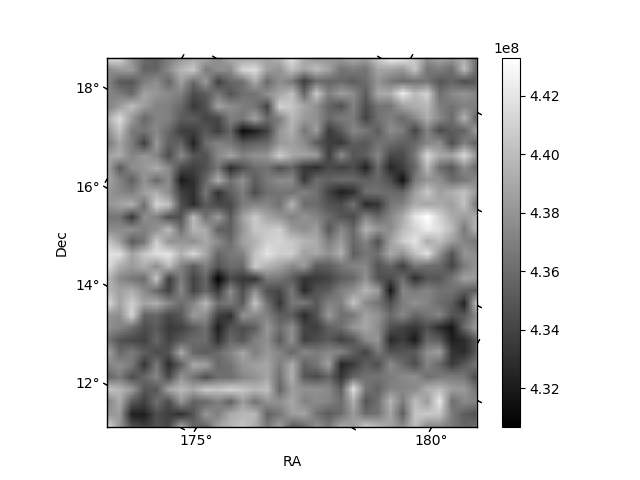
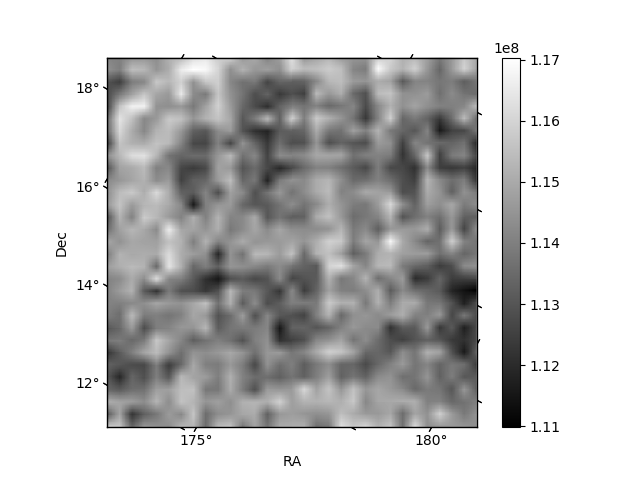
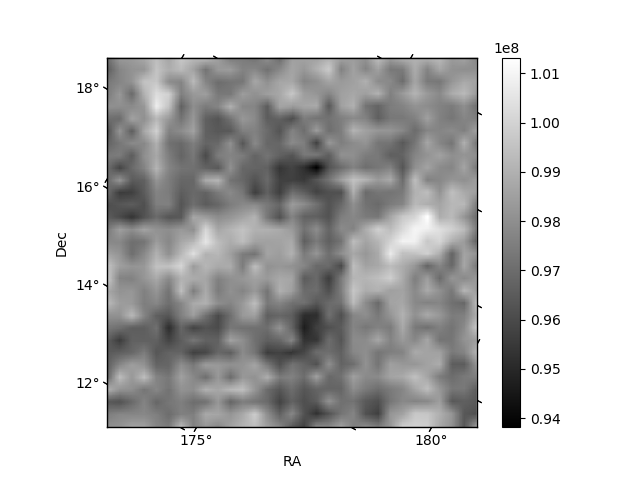
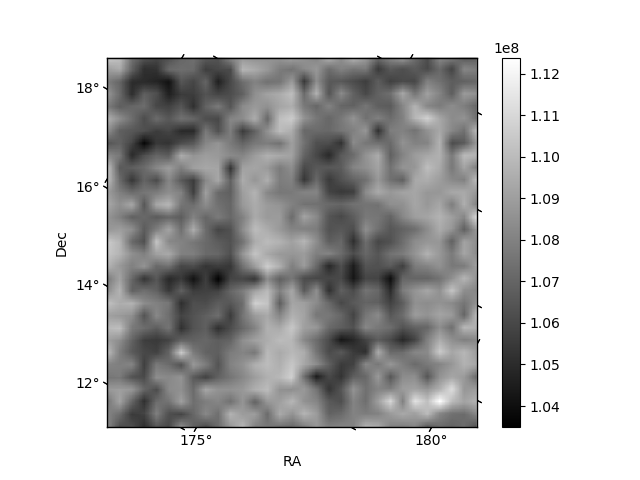
Histogram calculated using DETX and DETY for each event in the final _common_clean file
| Quadrant A | 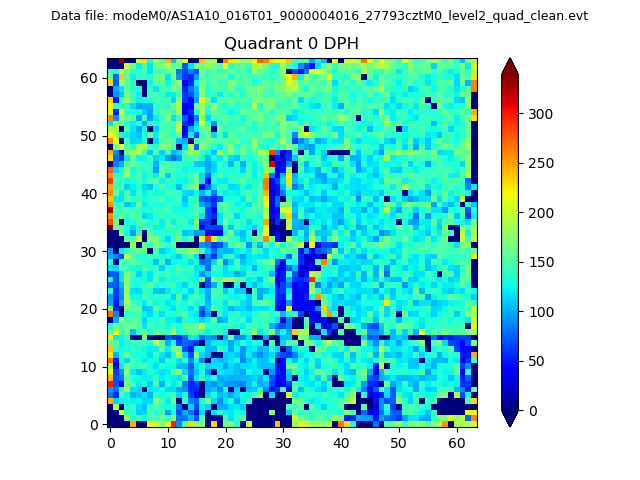 |
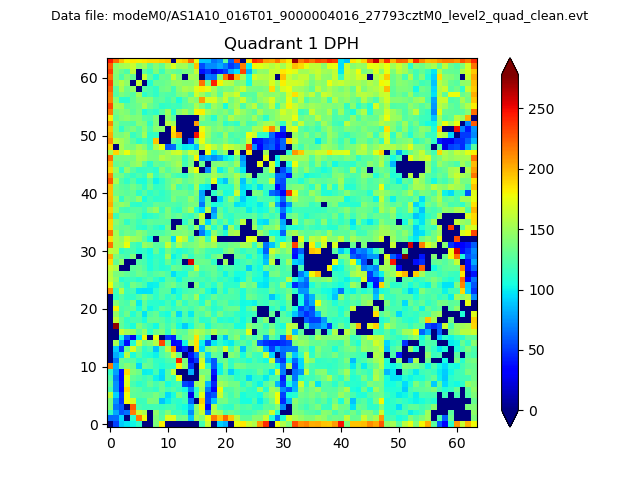 |
Quadrant B |
|---|---|---|---|
| Quadrant D | 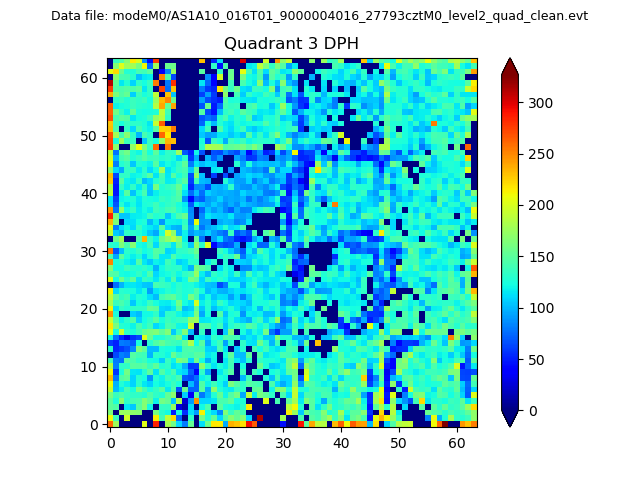 |
 |
Quadrant C |
| Plot type | Count rate plots | Images |
|---|---|---|
| Comparison with Poisson distribution Blue bars denote a histogram of data divided into 1 sec bins. Red curve is a Poisson curve with rate = median count rate of data. |
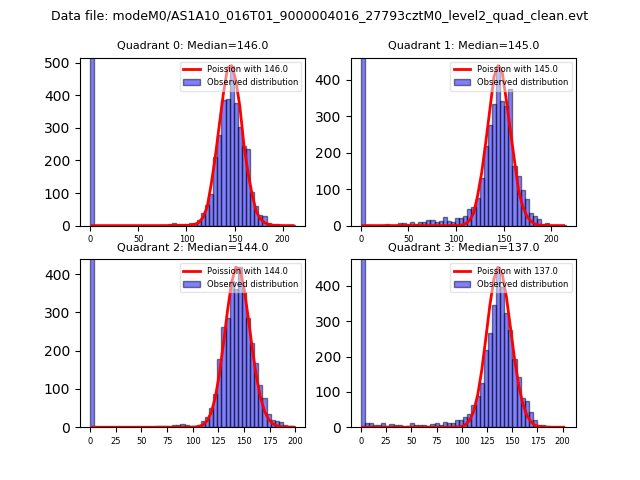 |
 |
| Quadrant-wise count rates Data is divided into 100 sec bins |
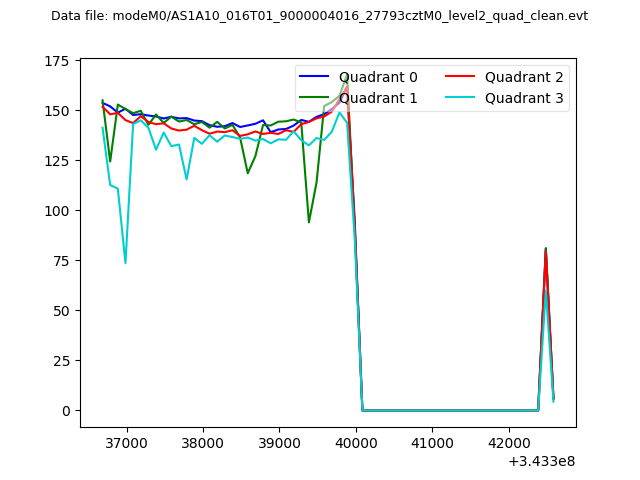 |
|
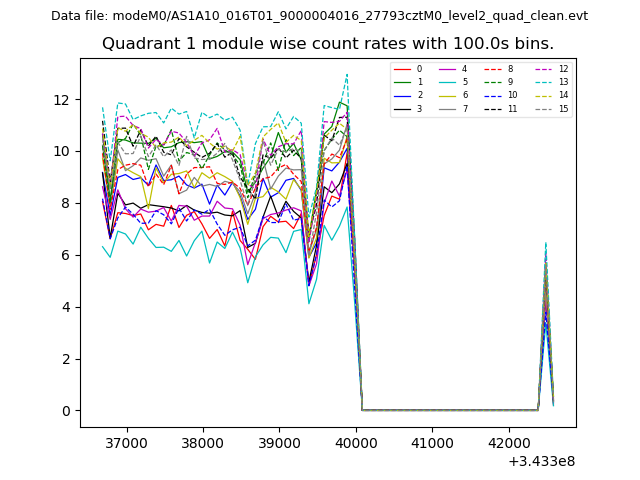
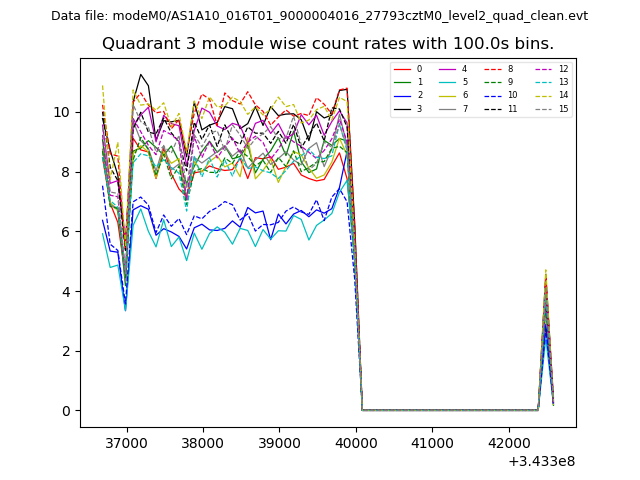
| Module-wise count rates for Quadrant A Data is divided into 100 sec bins |
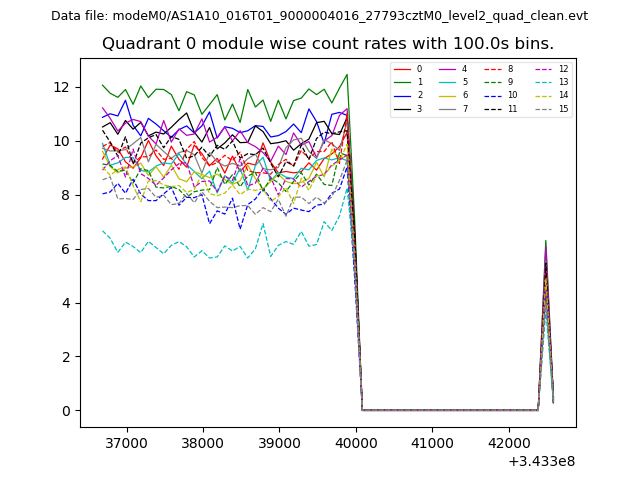 |
 |
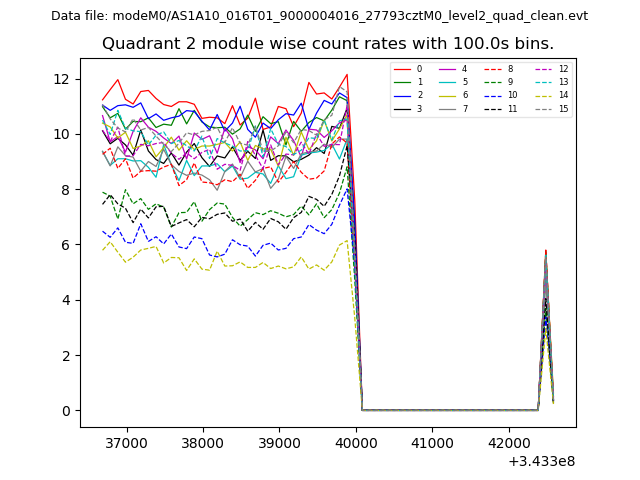
| Module-wise count rates for Quadrant B Data is divided into 100 sec bins |
 |
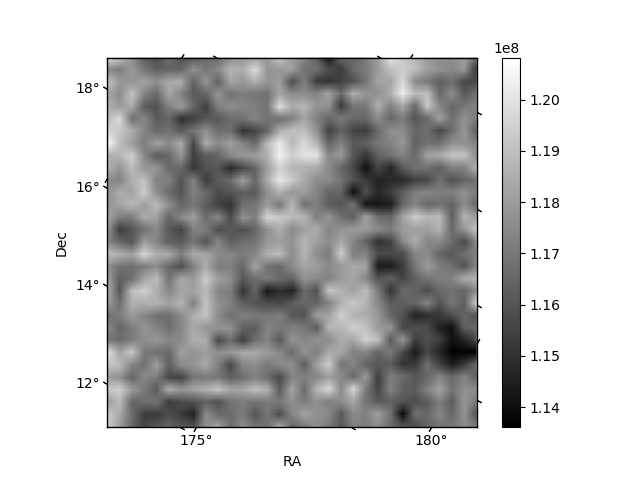 |
| Module-wise count rates for Quadrant C Data is divided into 100 sec bins |
 |
 |
| Module-wise count rates for Quadrant D Data is divided into 100 sec bins |
 |
 |
| Parameter | Plot |
|---|---|
| CZT HV Monitor | 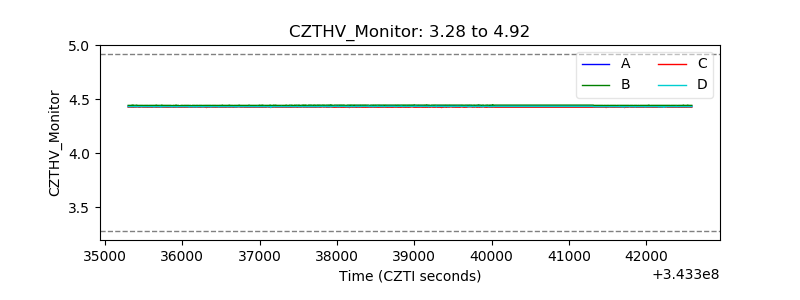 |
| D_VDD | 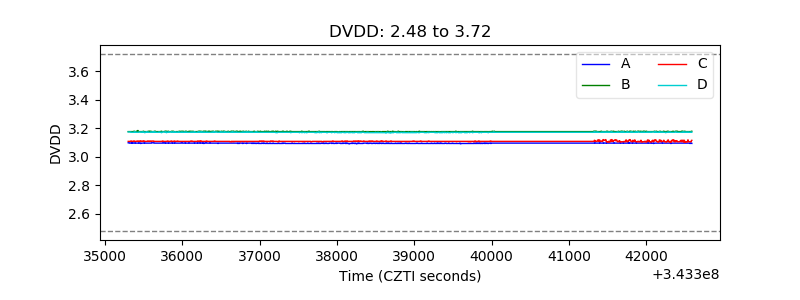 |
| Temperature 1 | 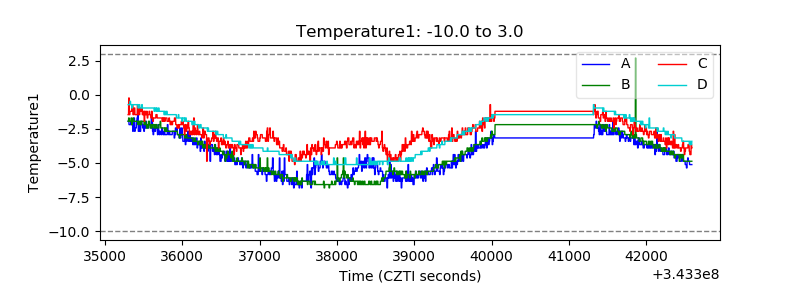 |
| Veto HV Monitor | 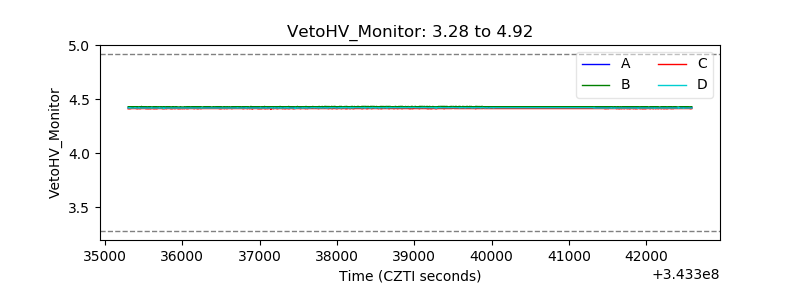 |
| Veto LLD | 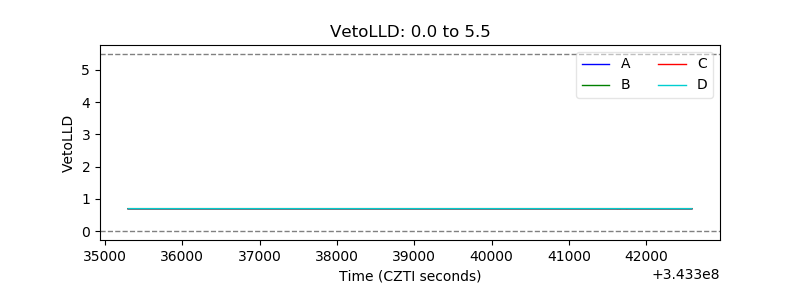 |
| Alpha Counter | 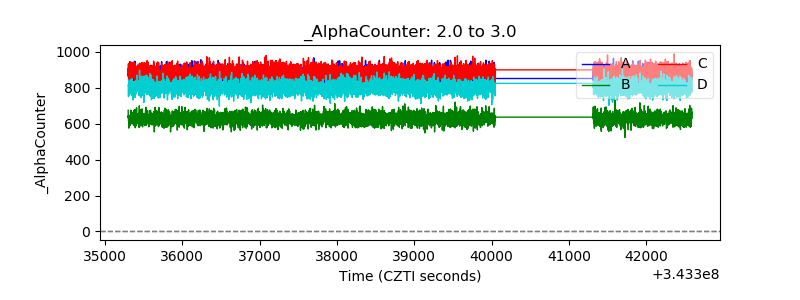 |
| _CPM_Rate | 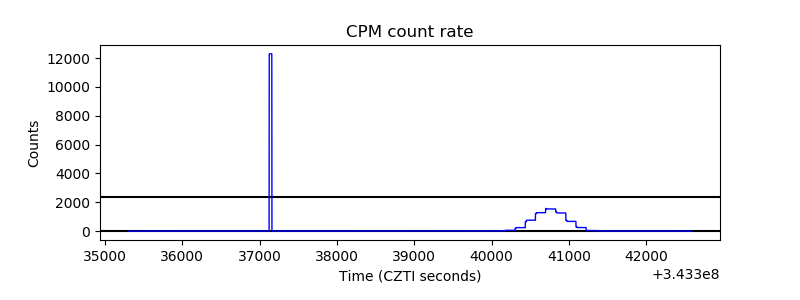 |
| CZT Counter |  |
| +2.5 Volts monitor |  |
| +5 Volts monitor |  |
| _ROLL_ROT | 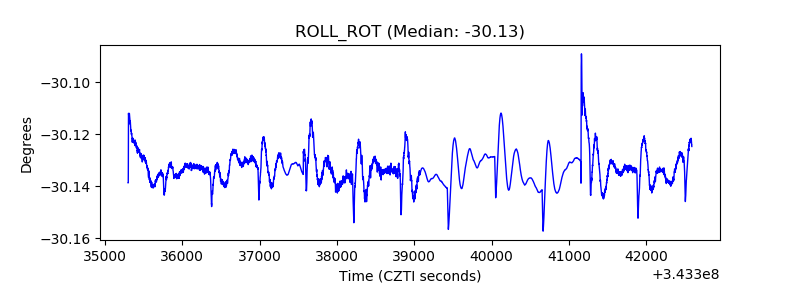 |
| _Roll_DEC | 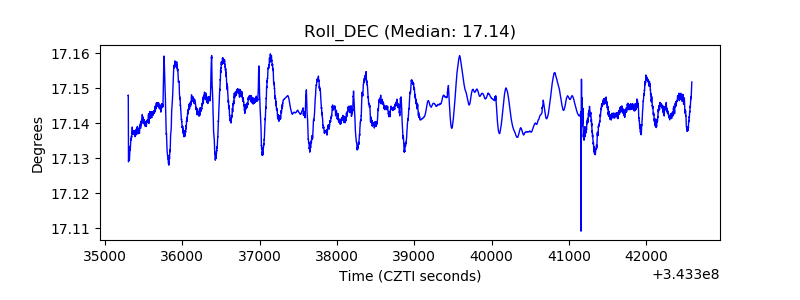 |
| _Roll_RA | 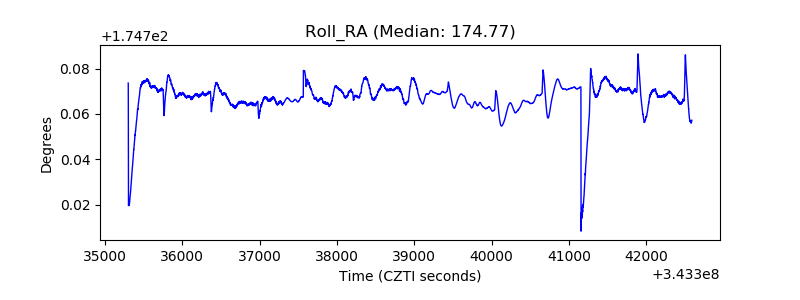 |
| Veto Counter | 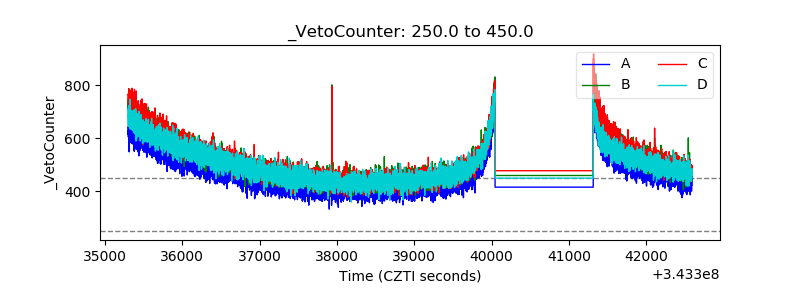 |