| Param | Original file | Final file |
|---|---|---|
| Filename | modeM0/AS1A10_016T01_9000004016_27794cztM0_level2.evt | modeM0/AS1A10_016T01_9000004016_27794cztM0_level2_quad_clean.evt |
| Size (bytes) | 580,452,480 | 86,852,160 |
| Size | 553.6 MB | 82.8 MB |
| Events in quadrant A | 3,291,152 | 562,883 |
| Events in quadrant B | 3,794,208 | 564,638 |
| Events in quadrant C | 3,444,094 | 546,898 |
| Events in quadrant D | 6,607,117 | 500,374 |
| Mode M9 | |||
|---|---|---|---|
| Quadrant | BADHDUFLAG | Total packets | Discarded packets |
| A | 0 | 16 | 0 |
| B | 0 | 17 | 0 |
| C | 0 | 17 | 0 |
| D | 0 | 17 | 0 |
| Mode M0 | |||
|---|---|---|---|
| Quadrant | BADHDUFLAG | Total packets | Discarded packets |
| A | 0 | 13789 | 0 |
| B | 0 | 15339 | 0 |
| C | 0 | 14233 | 0 |
| D | 0 | 24041 | 0 |
| Quadrant | Total seconds | Saturated seconds | Saturation percentage |
|---|---|---|---|
| A | 6527 | 73 | 1.118431% |
| B | 6527 | 182 | 2.788417% |
| C | 6527 | 110 | 1.685307% |
| D | 6526 | 1256 | 19.246093% |
Noise dominated data is calculated using 1-second bins in cleaned event files. If a bin has >2000 counts, and if more than 50% of those come from <1% of pixels, then it is considered to be noise-dominated and hence unusable.
| Quadrant | # 1 sec bins | Bins with >0 counts | Bins with >2000 counts | High rate bins dominated by noise | Noise dominated (total time) | Noise dominated (detector-on time) | Marked lightcurve |
|---|---|---|---|---|---|---|---|
| A | 7527 | 6527 | 0 | 0 | 0.00% | 0.00% | 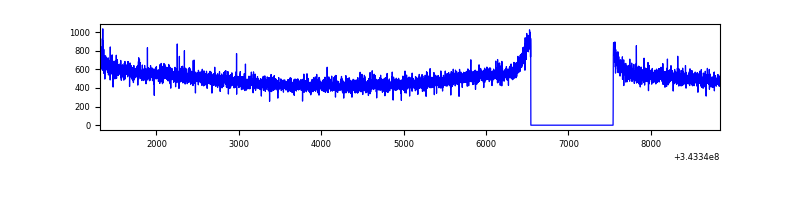 |
| B | 7527 | 6527 | 49 | 49 | 0.65% | 0.75% | 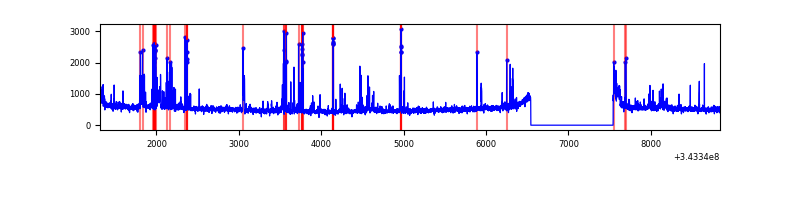 |
| C | 7527 | 6527 | 0 | 0 | 0.00% | 0.00% | 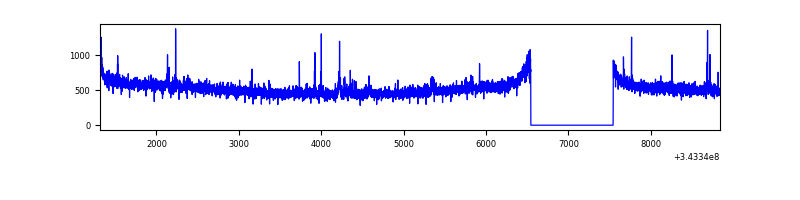 |
| D | 7525 | 6525 | 1025 | 1025 | 13.62% | 15.71% | 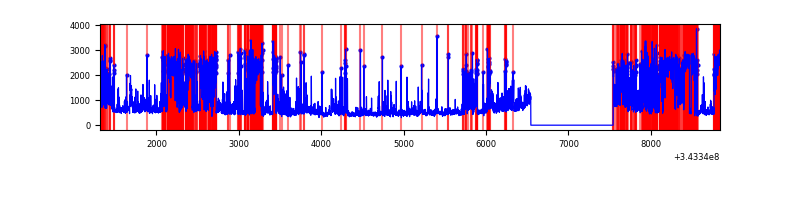 |
Top three noisy pixels from each quadrant. If the there are fewer than three noisy pixels in the level2.evt file, extra rows are filled as -1
| Pixel properties | Quadrant properties | ||||||
|---|---|---|---|---|---|---|---|
| Quadrant | DetID | PixID | Counts | Sigma | Mean | Median | Sigma |
| A | 13 | 254 | 11149 | 60.17 | 853 | 834 | 171.4 |
| A | 3 | 137 | 7876 | 41.08 | 853 | 834 | 171.4 |
| A | 0 | 226 | 7396 | 38.28 | 853 | 834 | 171.4 |
| B | 3 | 64 | 319456 | 1984.15 | 843 | 823 | 160.6 |
| B | 10 | 245 | 129888 | 803.7 | 843 | 823 | 160.6 |
| B | 12 | 111 | 19001 | 113.2 | 843 | 823 | 160.6 |
| C | 14 | 238 | 131042 | 678.6 | 824 | 832 | 191.9 |
| C | 3 | 233 | 76204 | 392.81 | 824 | 832 | 191.9 |
| C | 8 | 128 | 10330 | 49.5 | 824 | 832 | 191.9 |
| D | 1 | 52 | 3427211 | 18849.47 | 761 | 743 | 181.8 |
| D | 2 | 250 | 166462 | 911.64 | 761 | 743 | 181.8 |
| D | 13 | 104 | 96728 | 528.02 | 761 | 743 | 181.8 |
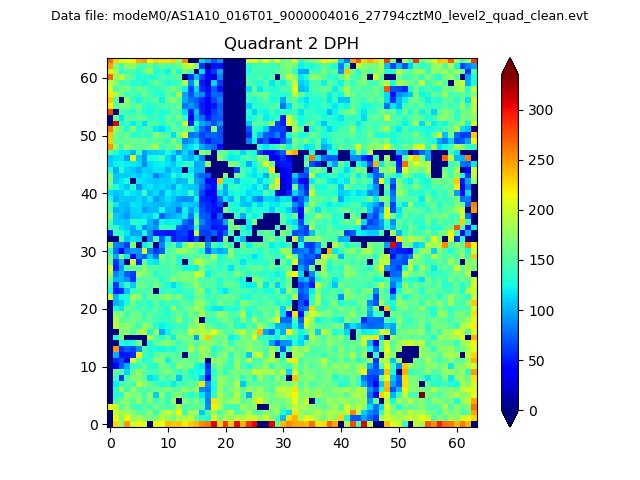
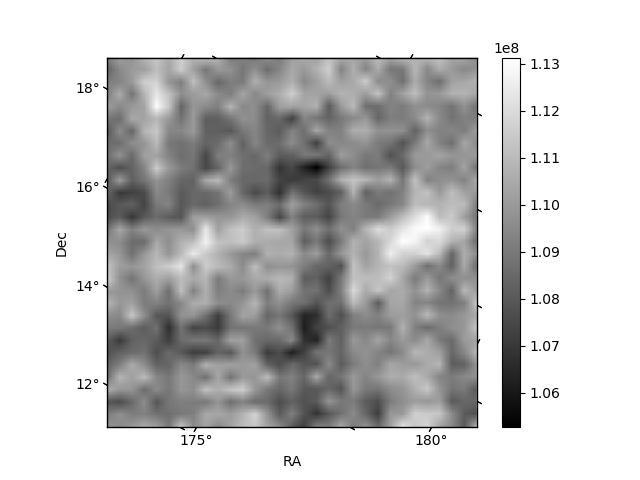
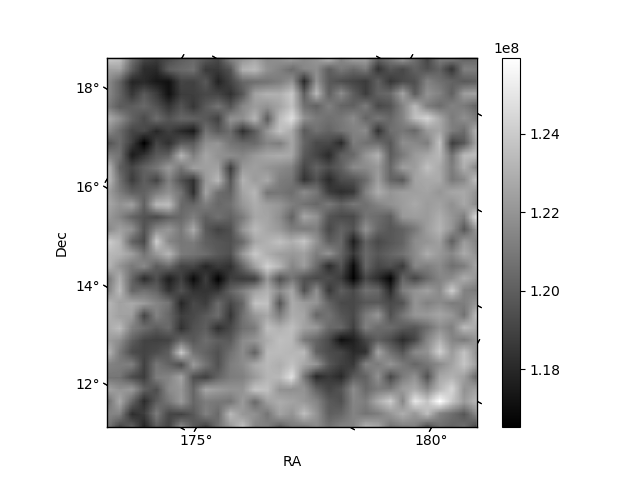
Histogram calculated using DETX and DETY for each event in the final _common_clean file
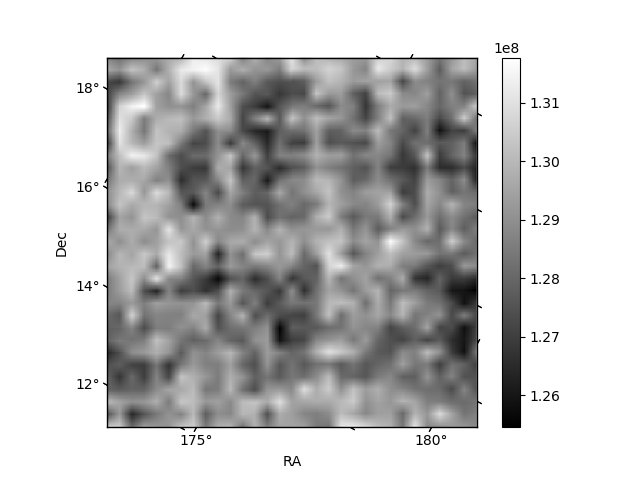
| Quadrant A |  |
 |
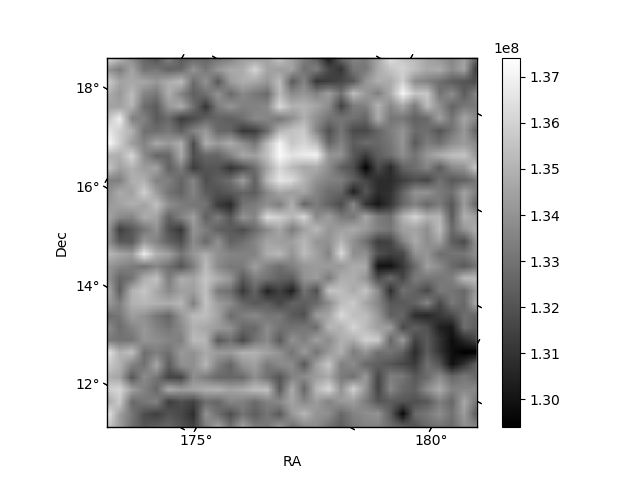
Quadrant B |
|---|---|---|---|
| Quadrant D | 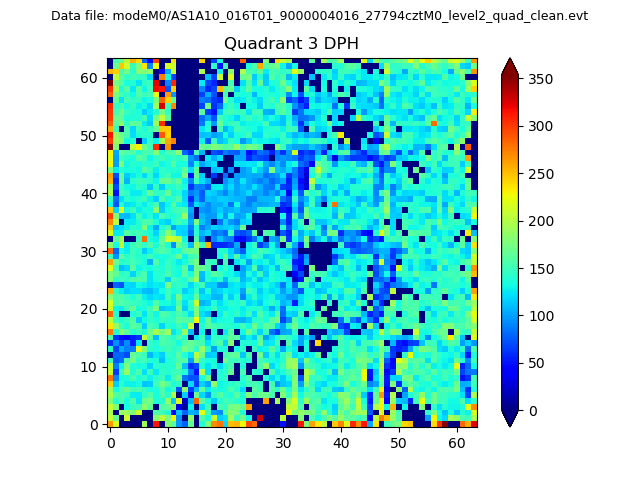 |
 |
Quadrant C |
| Plot type | Count rate plots | Images |
|---|---|---|
| Comparison with Poisson distribution Blue bars denote a histogram of data divided into 1 sec bins. Red curve is a Poisson curve with rate = median count rate of data. |
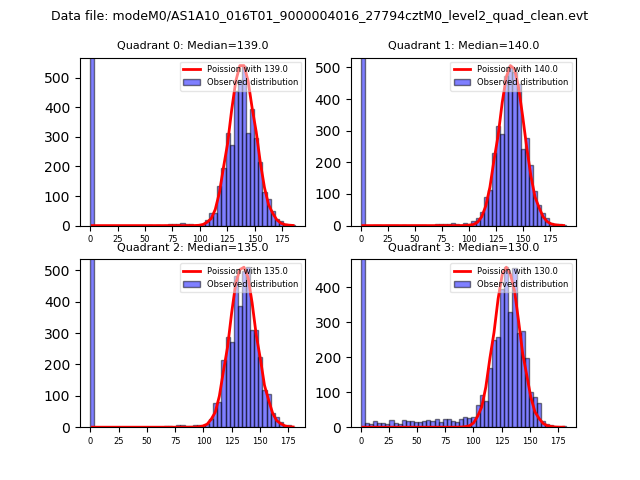 |
 |
| Quadrant-wise count rates Data is divided into 100 sec bins |
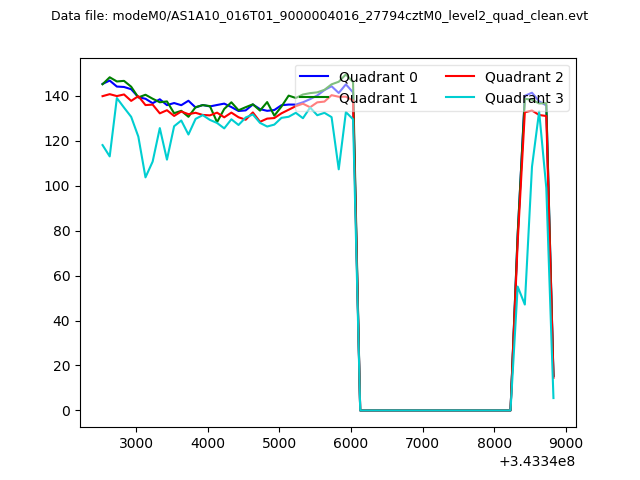 |
|
| Module-wise count rates for Quadrant A Data is divided into 100 sec bins |
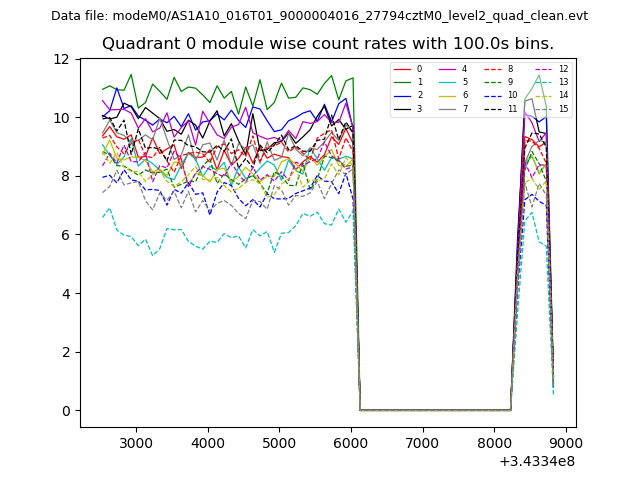 |
 |
| Module-wise count rates for Quadrant B Data is divided into 100 sec bins |
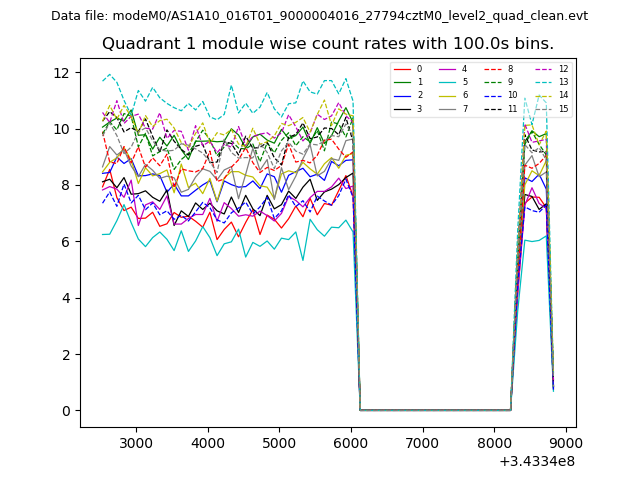 |
 |
| Module-wise count rates for Quadrant C Data is divided into 100 sec bins |
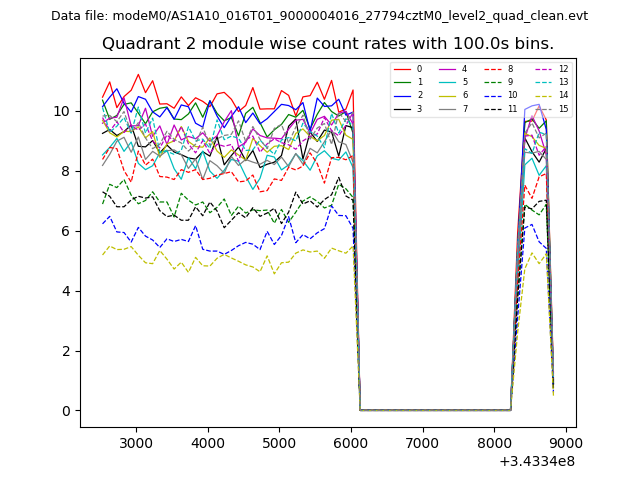 |
 |
| Module-wise count rates for Quadrant D Data is divided into 100 sec bins |
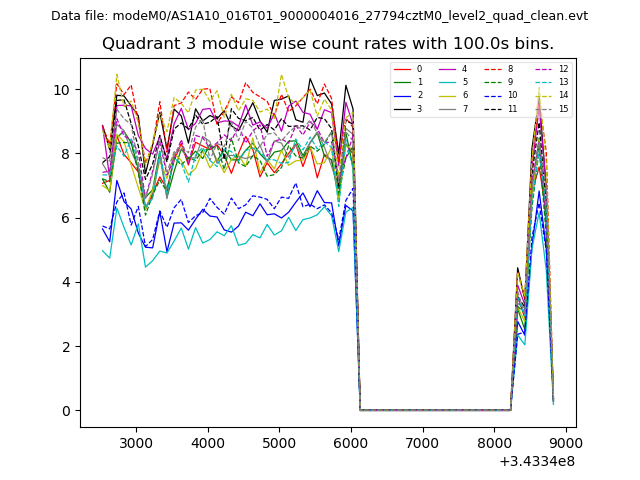 |
 |
| Parameter | Plot |
|---|---|
| CZT HV Monitor | 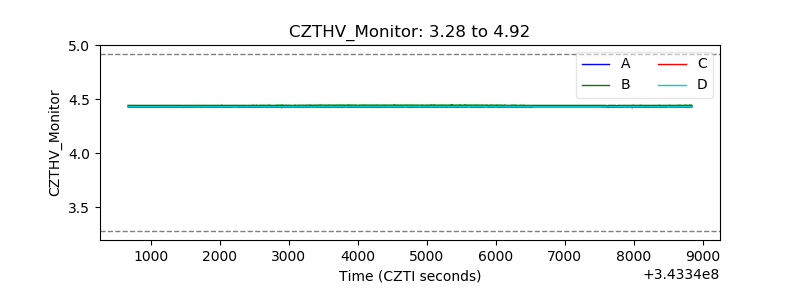 |
| D_VDD | 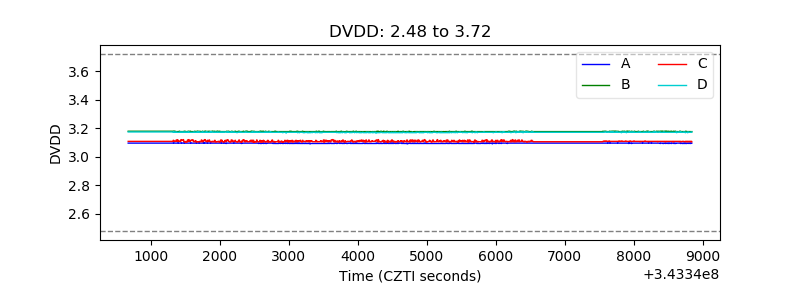 |
| Temperature 1 | 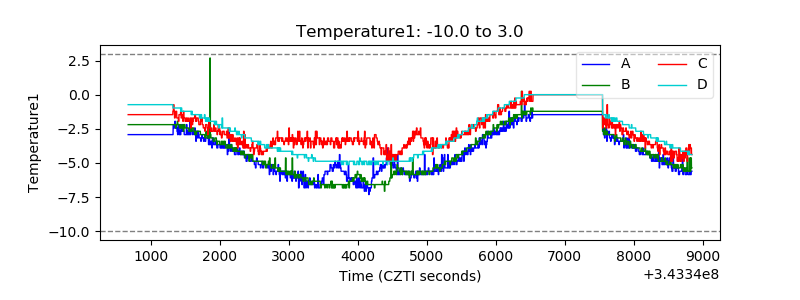 |
| Veto HV Monitor |  |
| Veto LLD | 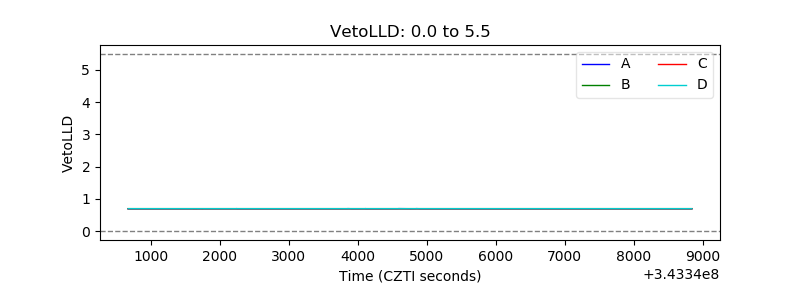 |
| Alpha Counter | 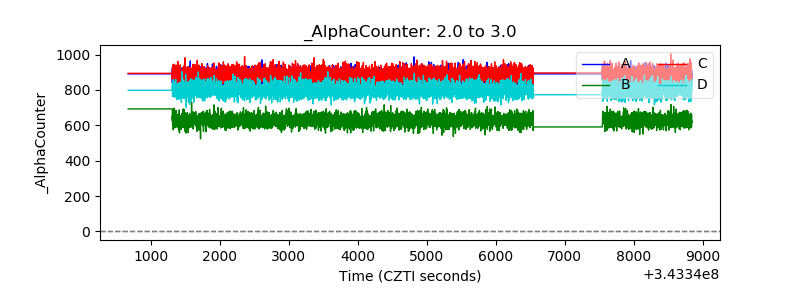 |
| _CPM_Rate | 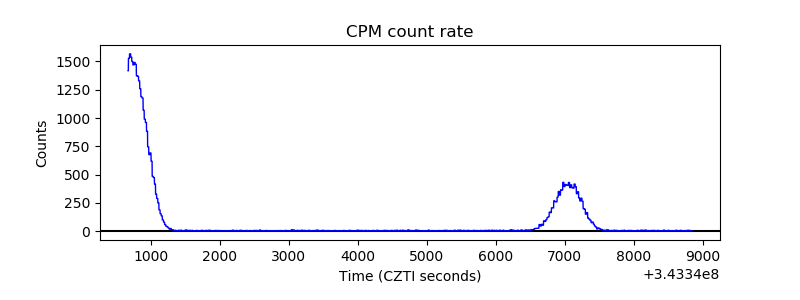 |
| CZT Counter | 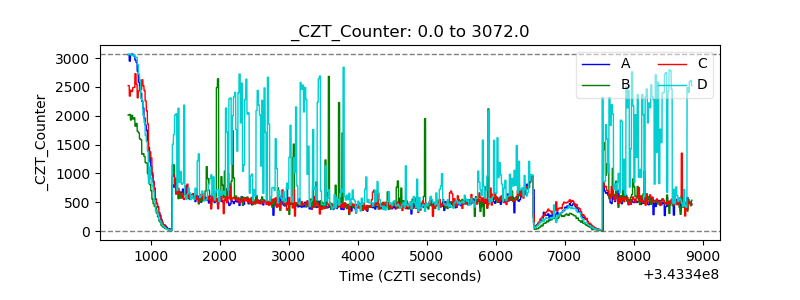 |
| +2.5 Volts monitor |  |
| +5 Volts monitor |  |
| _ROLL_ROT | 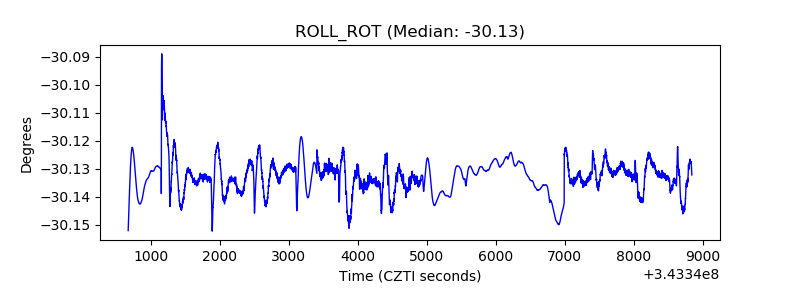 |
| _Roll_DEC | 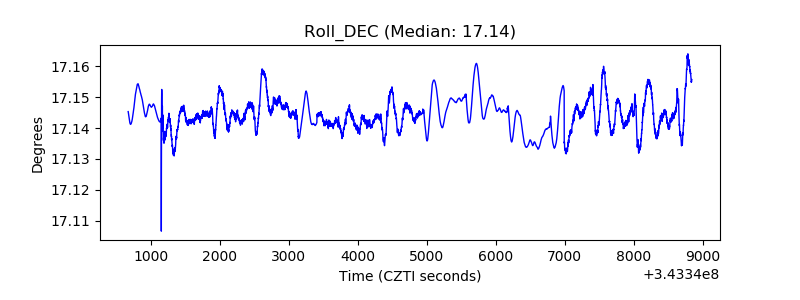 |
| _Roll_RA | 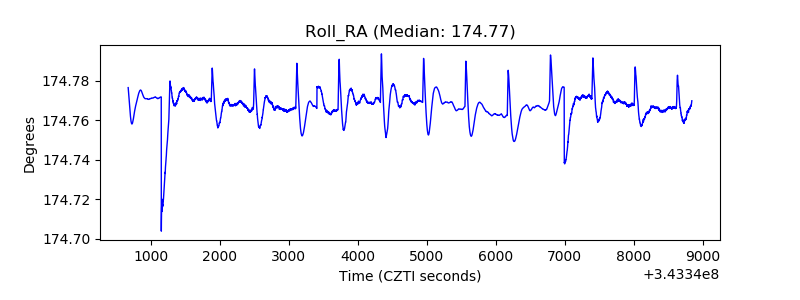 |
| Veto Counter | 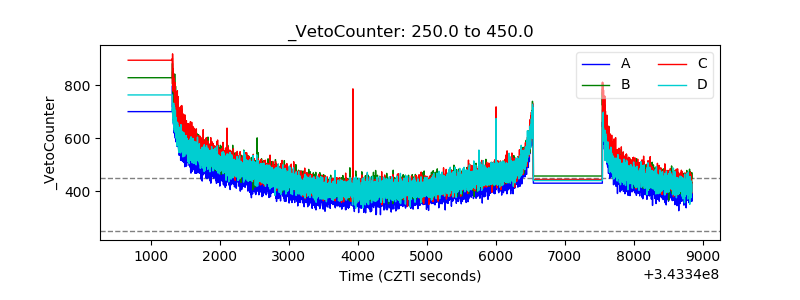 |