| Param | Original file | Final file |
|---|---|---|
| Filename | modeM0/AS1A10_016T01_9000004016_27795cztM0_level2.evt | modeM0/AS1A10_016T01_9000004016_27795cztM0_level2_quad_clean.evt |
| Size (bytes) | 694,808,640 | 93,384,000 |
| Size | 662.6 MB | 89.1 MB |
| Events in quadrant A | 3,685,658 | 608,005 |
| Events in quadrant B | 4,132,866 | 610,768 |
| Events in quadrant C | 3,768,300 | 591,370 |
| Events in quadrant D | 8,949,819 | 497,847 |
| Mode M9 | |||
|---|---|---|---|
| Quadrant | BADHDUFLAG | Total packets | Discarded packets |
| A | 0 | 16 | 0 |
| B | 0 | 16 | 0 |
| C | 0 | 16 | 0 |
| D | 0 | 16 | 0 |
| Mode M0 | |||
|---|---|---|---|
| Quadrant | BADHDUFLAG | Total packets | Discarded packets |
| A | 0 | 15716 | 0 |
| B | 0 | 17199 | 0 |
| C | 0 | 15905 | 0 |
| D | 0 | 31897 | 0 |
| Quadrant | Total seconds | Saturated seconds | Saturation percentage |
|---|---|---|---|
| A | 7469 | 105 | 1.405811% |
| B | 7469 | 236 | 3.159727% |
| C | 7470 | 174 | 2.329317% |
| D | 7470 | 2014 | 26.961178% |
Noise dominated data is calculated using 1-second bins in cleaned event files. If a bin has >2000 counts, and if more than 50% of those come from <1% of pixels, then it is considered to be noise-dominated and hence unusable.
| Quadrant | # 1 sec bins | Bins with >0 counts | Bins with >2000 counts | High rate bins dominated by noise | Noise dominated (total time) | Noise dominated (detector-on time) | Marked lightcurve |
|---|---|---|---|---|---|---|---|
| A | 9074 | 7470 | 0 | 0 | 0.00% | 0.00% | 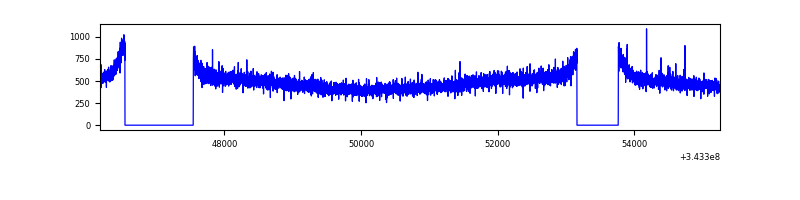 |
| B | 9074 | 7469 | 44 | 44 | 0.48% | 0.59% | 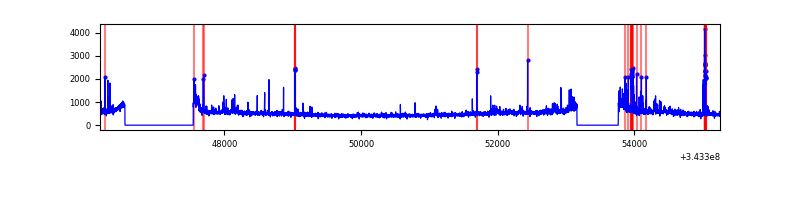 |
| C | 9075 | 7470 | 0 | 0 | 0.00% | 0.00% | 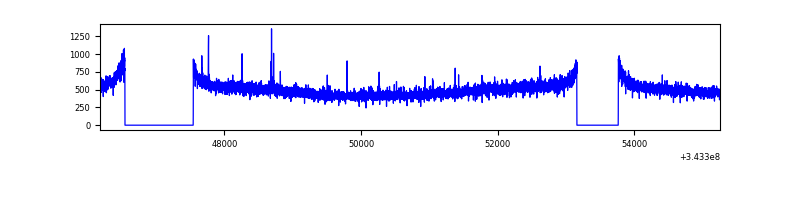 |
| D | 9075 | 7470 | 1662 | 1662 | 18.31% | 22.25% | 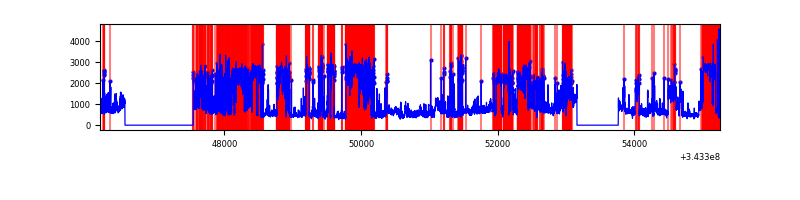 |
Top three noisy pixels from each quadrant. If the there are fewer than three noisy pixels in the level2.evt file, extra rows are filled as -1
| Pixel properties | Quadrant properties | ||||||
|---|---|---|---|---|---|---|---|
| Quadrant | DetID | PixID | Counts | Sigma | Mean | Median | Sigma |
| A | 13 | 254 | 12837 | 61.84 | 954 | 934 | 192.5 |
| A | 3 | 137 | 9200 | 42.94 | 954 | 934 | 192.5 |
| A | 0 | 226 | 8106 | 37.26 | 954 | 934 | 192.5 |
| B | 10 | 245 | 252540 | 1402.43 | 943 | 920 | 179.4 |
| B | 3 | 64 | 92760 | 511.88 | 943 | 920 | 179.4 |
| B | 4 | 52 | 33295 | 180.45 | 943 | 920 | 179.4 |
| C | 14 | 238 | 144723 | 657.89 | 921 | 926 | 218.6 |
| C | 3 | 233 | 28882 | 127.9 | 921 | 926 | 218.6 |
| C | 10 | 22 | 8527 | 34.78 | 921 | 926 | 218.6 |
| D | 1 | 52 | 5670184 | 29475.45 | 794 | 771 | 192.3 |
| D | 2 | 250 | 180849 | 936.23 | 794 | 771 | 192.3 |
| D | 13 | 104 | 47288 | 241.84 | 794 | 771 | 192.3 |
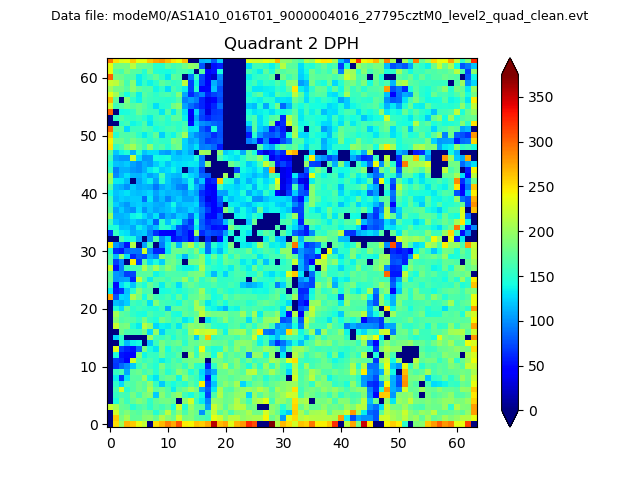
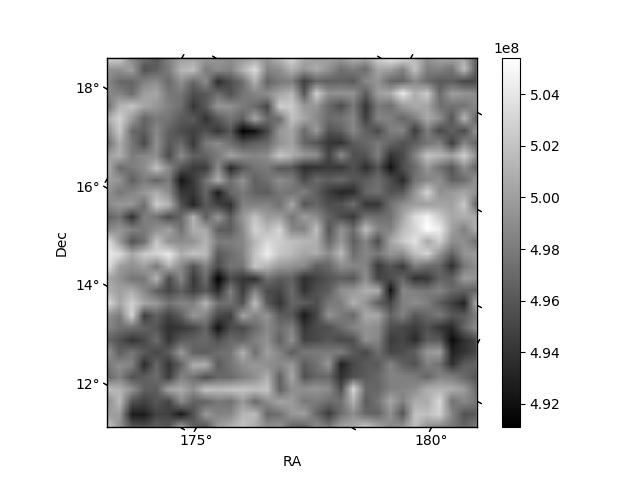
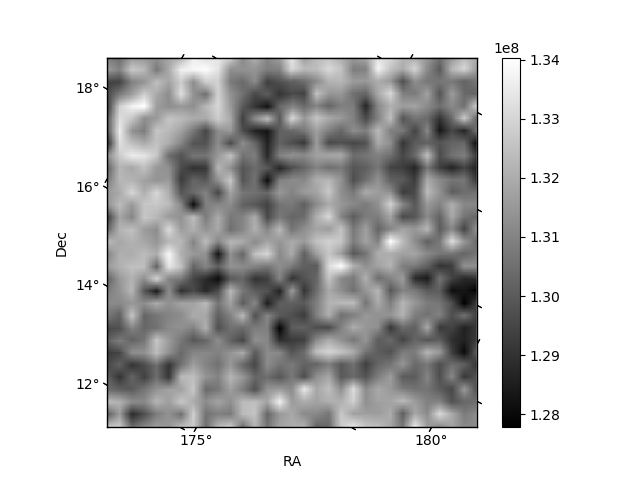
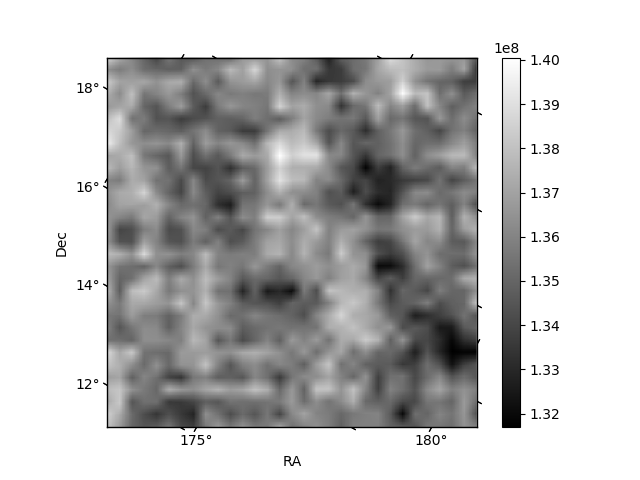
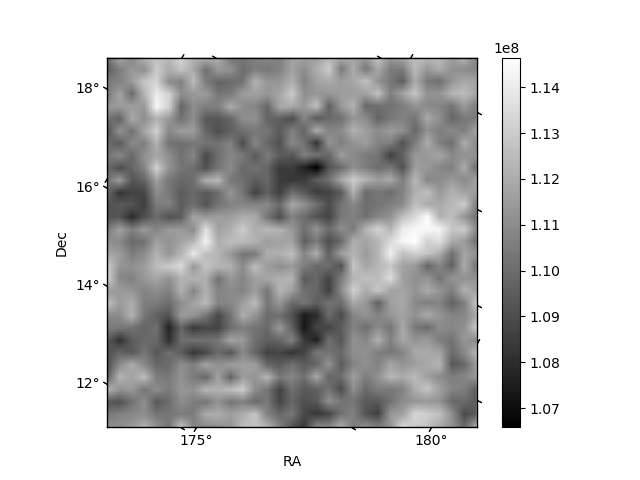
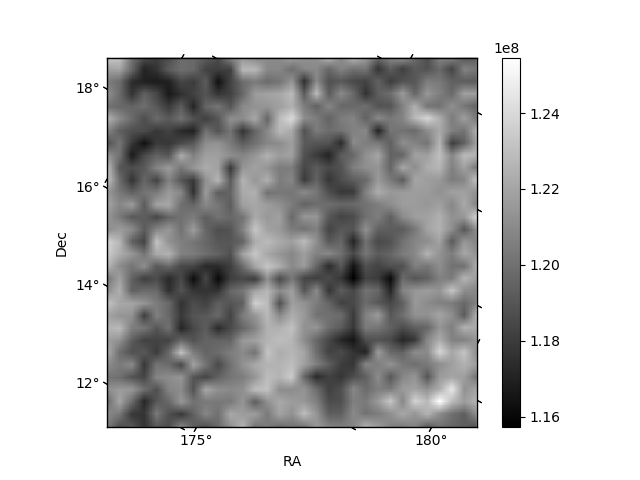
Histogram calculated using DETX and DETY for each event in the final _common_clean file
| Quadrant A | 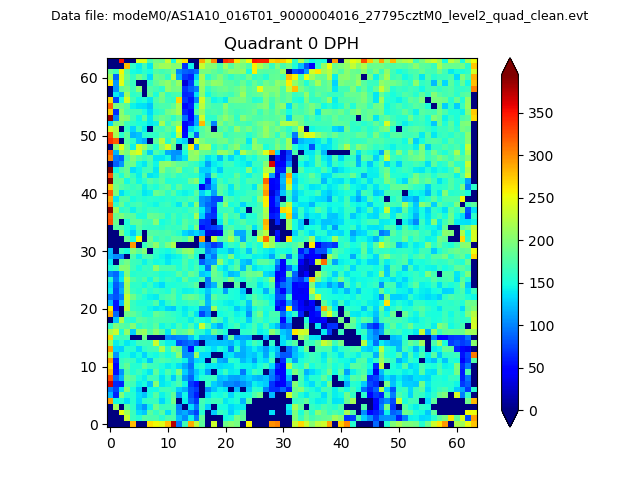 |
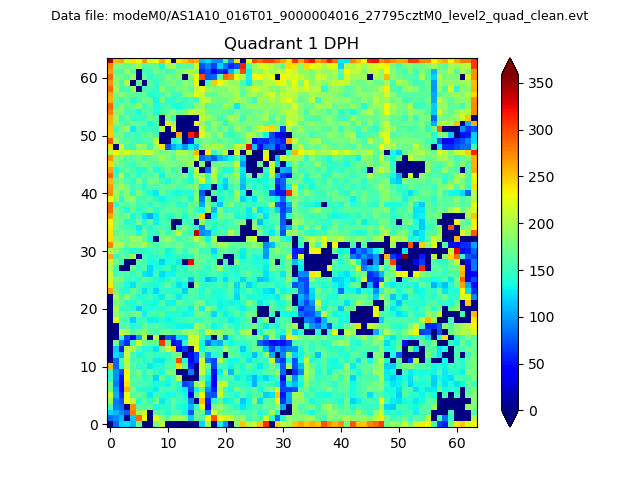 |
Quadrant B |
|---|---|---|---|
| Quadrant D | 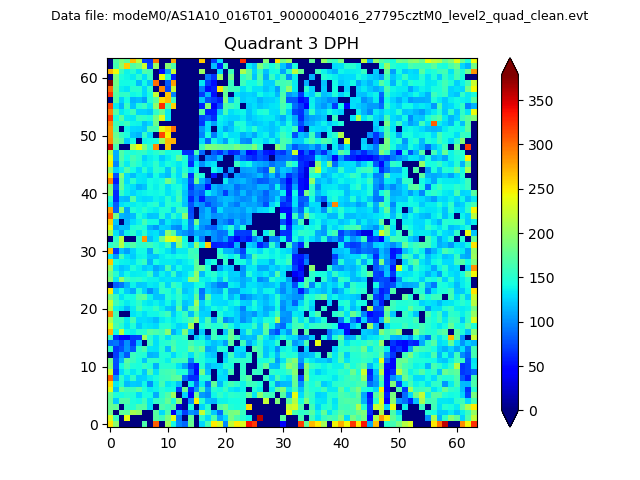 |
 |
Quadrant C |
| Plot type | Count rate plots | Images |
|---|---|---|
| Comparison with Poisson distribution Blue bars denote a histogram of data divided into 1 sec bins. Red curve is a Poisson curve with rate = median count rate of data. |
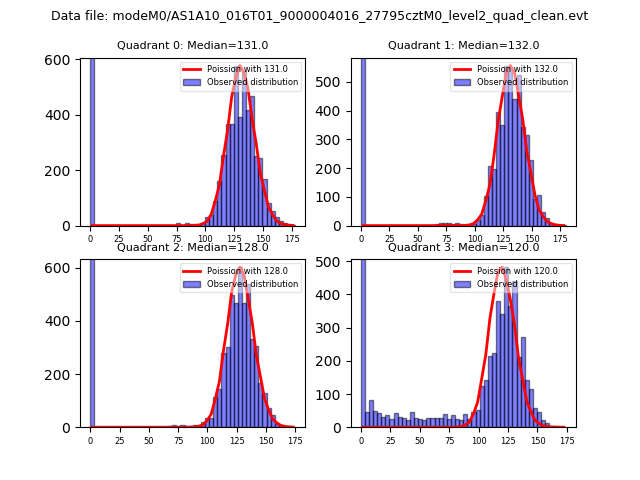 |
 |
| Quadrant-wise count rates Data is divided into 100 sec bins |
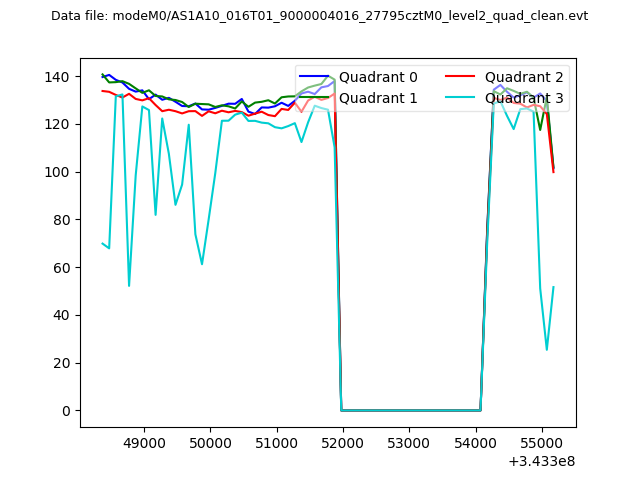 |
|
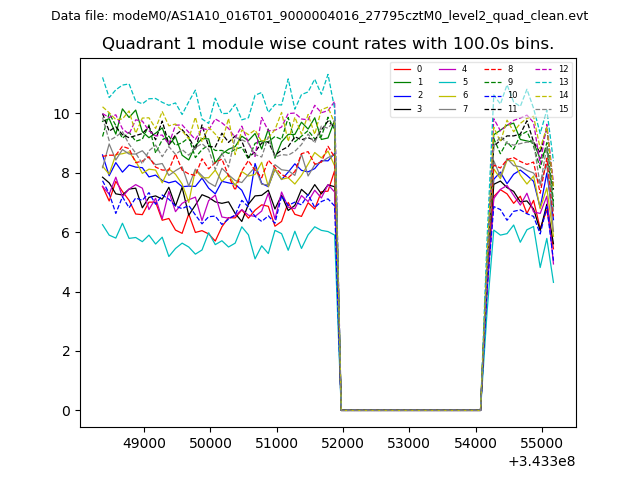
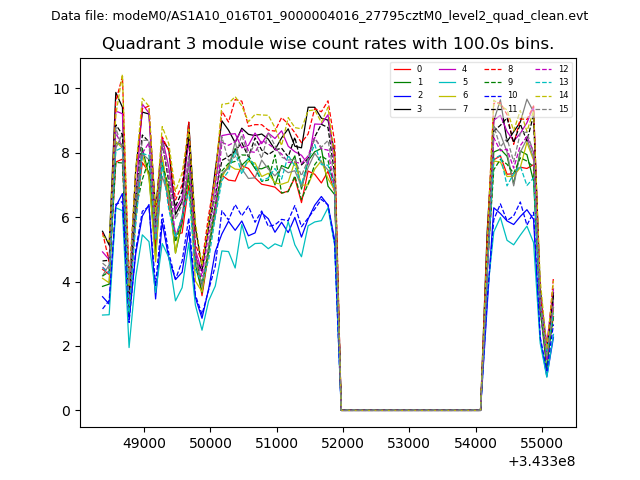
| Module-wise count rates for Quadrant A Data is divided into 100 sec bins |
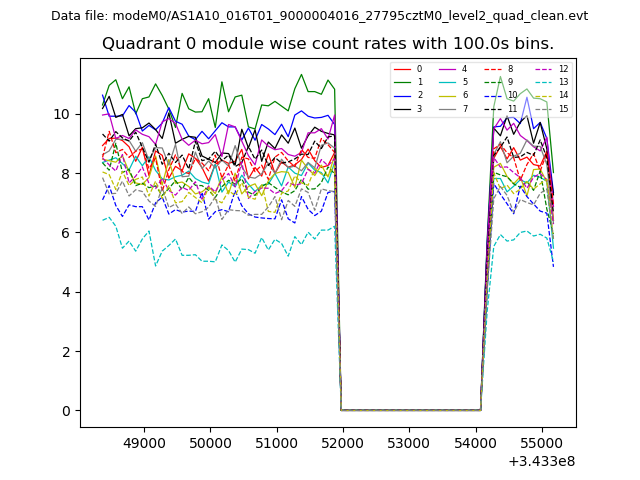 |
 |
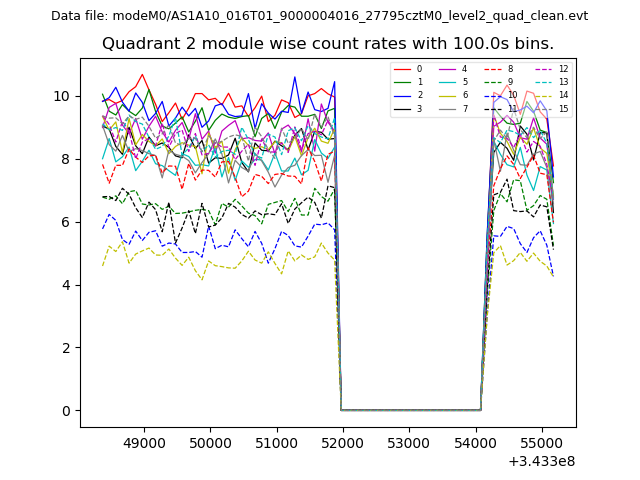
| Module-wise count rates for Quadrant B Data is divided into 100 sec bins |
 |
 |
| Module-wise count rates for Quadrant C Data is divided into 100 sec bins |
 |
 |
| Module-wise count rates for Quadrant D Data is divided into 100 sec bins |
 |
 |
| Parameter | Plot |
|---|---|
| CZT HV Monitor | 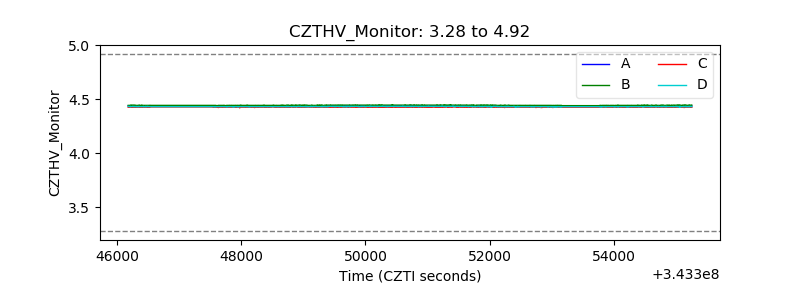 |
| D_VDD | 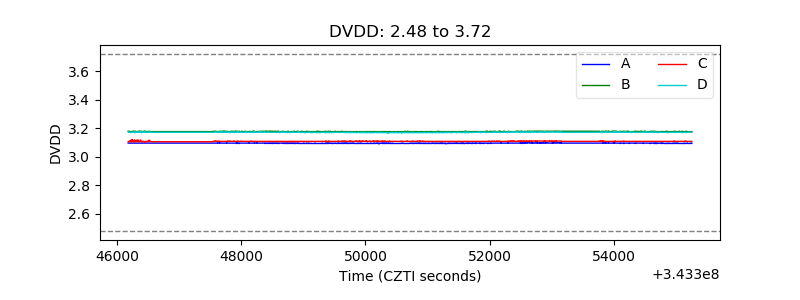 |
| Temperature 1 | 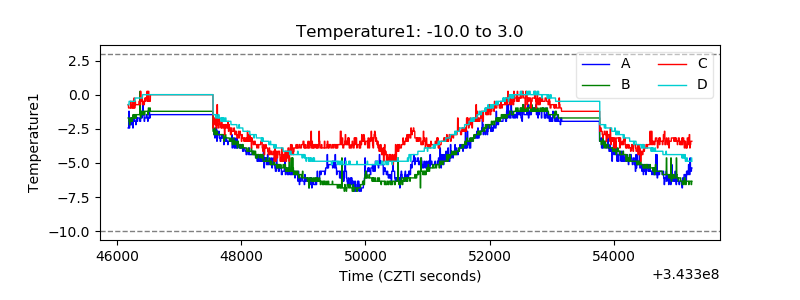 |
| Veto HV Monitor |  |
| Veto LLD | 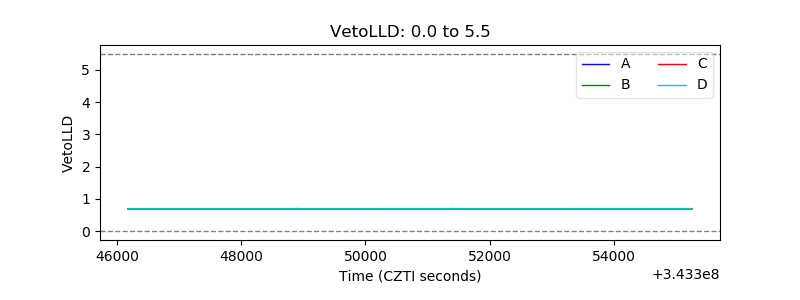 |
| Alpha Counter | 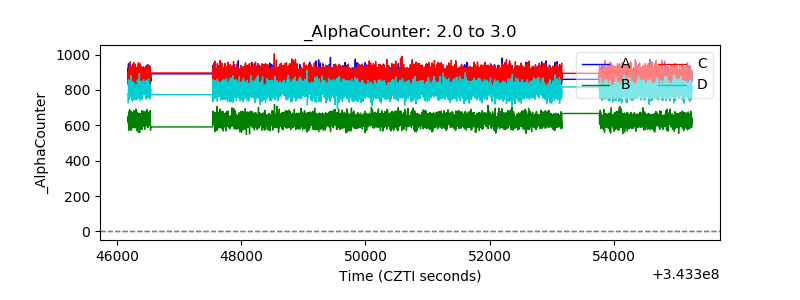 |
| _CPM_Rate | 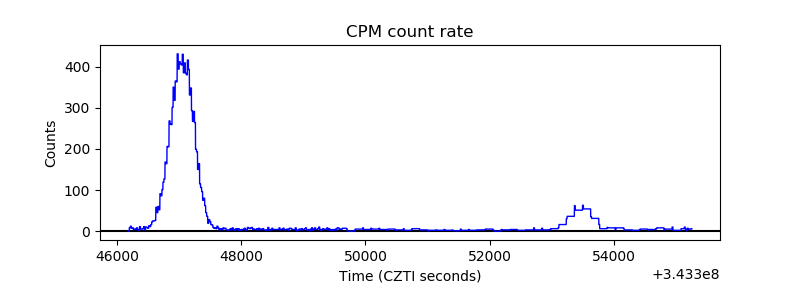 |
| CZT Counter | 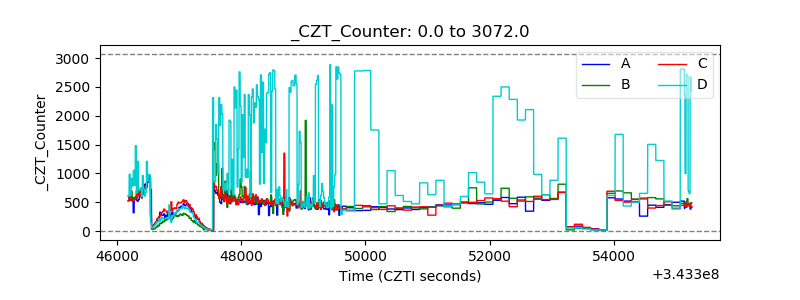 |
| +2.5 Volts monitor |  |
| +5 Volts monitor |  |
| _ROLL_ROT | 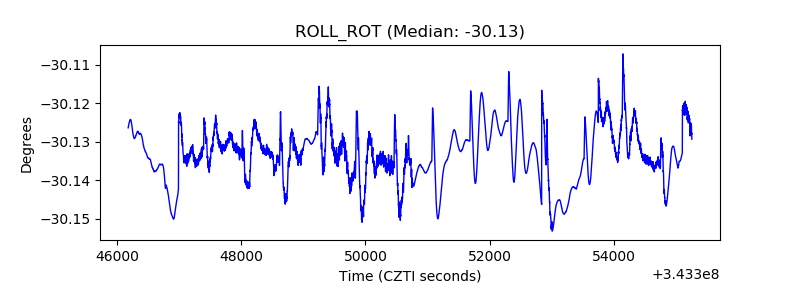 |
| _Roll_DEC | 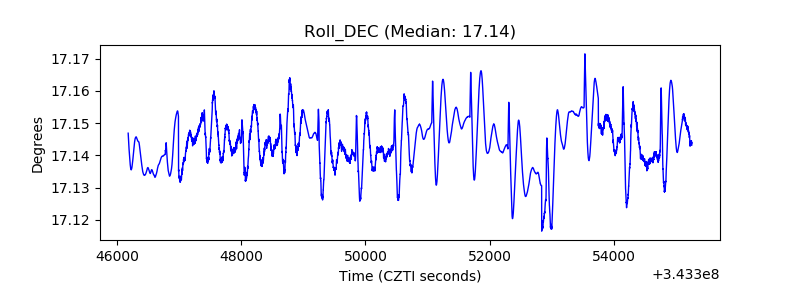 |
| _Roll_RA | 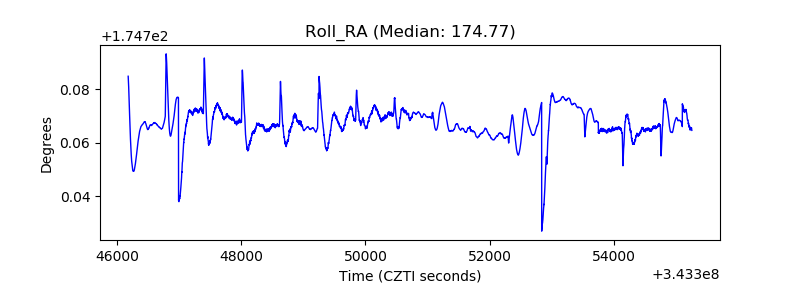 |
| Veto Counter | 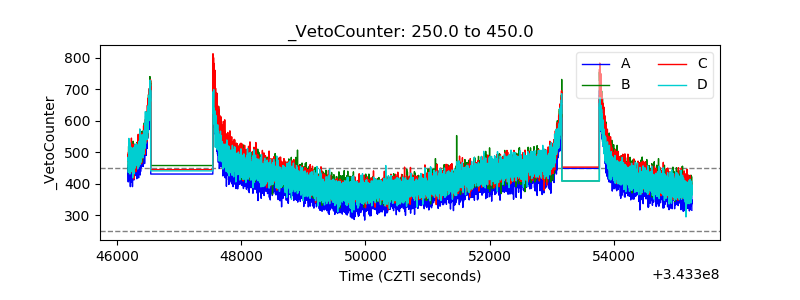 |