| Param | Original file | Final file |
|---|---|---|
| Filename | modeM0/AS1A10_016T01_9000004016_27796cztM0_level2.evt | modeM0/AS1A10_016T01_9000004016_27796cztM0_level2_quad_clean.evt |
| Size (bytes) | 651,844,800 | 100,684,800 |
| Size | 621.6 MB | 96.0 MB |
| Events in quadrant A | 3,737,450 | 655,009 |
| Events in quadrant B | 4,177,738 | 657,997 |
| Events in quadrant C | 3,986,028 | 635,996 |
| Events in quadrant D | 7,317,433 | 563,302 |
| Mode M9 | |||
|---|---|---|---|
| Quadrant | BADHDUFLAG | Total packets | Discarded packets |
| A | 0 | 10 | 0 |
| B | 0 | 10 | 0 |
| C | 0 | 10 | 0 |
| D | 0 | 10 | 0 |
| Mode M0 | |||
|---|---|---|---|
| Quadrant | BADHDUFLAG | Total packets | Discarded packets |
| A | 0 | 16184 | 0 |
| B | 0 | 17557 | 0 |
| C | 0 | 16963 | 0 |
| D | 0 | 27127 | 0 |
| Quadrant | Total seconds | Saturated seconds | Saturation percentage |
|---|---|---|---|
| A | 7714 | 64 | 0.829660% |
| B | 7714 | 212 | 2.748250% |
| C | 7715 | 185 | 2.397926% |
| D | 7715 | 1105 | 14.322748% |
Noise dominated data is calculated using 1-second bins in cleaned event files. If a bin has >2000 counts, and if more than 50% of those come from <1% of pixels, then it is considered to be noise-dominated and hence unusable.
| Quadrant | # 1 sec bins | Bins with >0 counts | Bins with >2000 counts | High rate bins dominated by noise | Noise dominated (total time) | Noise dominated (detector-on time) | Marked lightcurve |
|---|---|---|---|---|---|---|---|
| A | 8654 | 7716 | 0 | 0 | 0.00% | 0.00% | 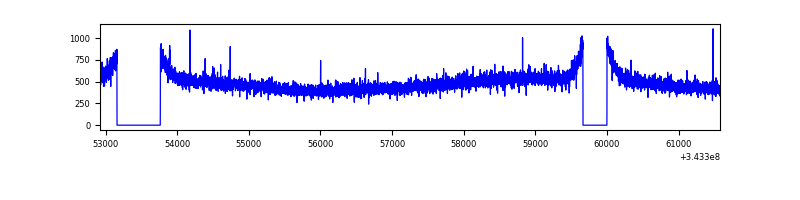 |
| B | 8654 | 7714 | 41 | 41 | 0.47% | 0.53% | 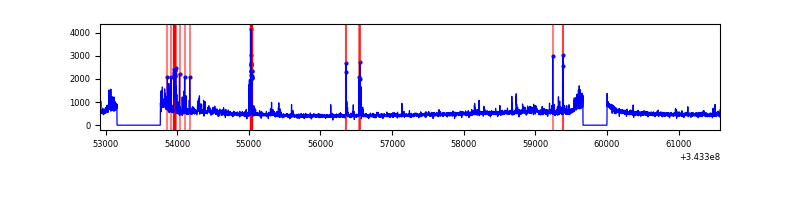 |
| C | 8655 | 7716 | 2 | 2 | 0.02% | 0.03% | 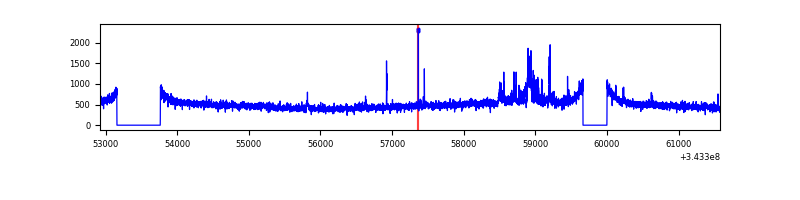 |
| D | 8655 | 7715 | 953 | 953 | 11.01% | 12.35% | 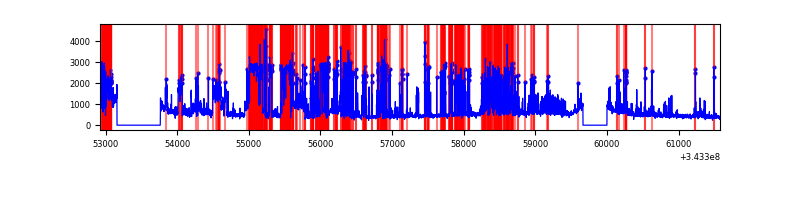 |
Top three noisy pixels from each quadrant. If the there are fewer than three noisy pixels in the level2.evt file, extra rows are filled as -1
| Pixel properties | Quadrant properties | ||||||
|---|---|---|---|---|---|---|---|
| Quadrant | DetID | PixID | Counts | Sigma | Mean | Median | Sigma |
| A | 13 | 254 | 13140 | 61.7 | 967 | 946 | 197.6 |
| A | 3 | 137 | 9502 | 43.29 | 967 | 946 | 197.6 |
| A | 0 | 226 | 8199 | 36.7 | 967 | 946 | 197.6 |
| B | 3 | 64 | 136069 | 737.22 | 959 | 935 | 183.3 |
| B | 10 | 245 | 131982 | 714.92 | 959 | 935 | 183.3 |
| B | 4 | 52 | 67148 | 361.22 | 959 | 935 | 183.3 |
| C | 3 | 233 | 203392 | 927.37 | 929 | 937 | 218.3 |
| C | 14 | 238 | 148192 | 674.52 | 929 | 937 | 218.3 |
| C | 15 | 208 | 8541 | 34.83 | 929 | 937 | 218.3 |
| D | 1 | 52 | 3795006 | 18005.1 | 868 | 842 | 210.7 |
| D | 2 | 250 | 143015 | 674.68 | 868 | 842 | 210.7 |
| D | 14 | 35 | 34909 | 161.66 | 868 | 842 | 210.7 |
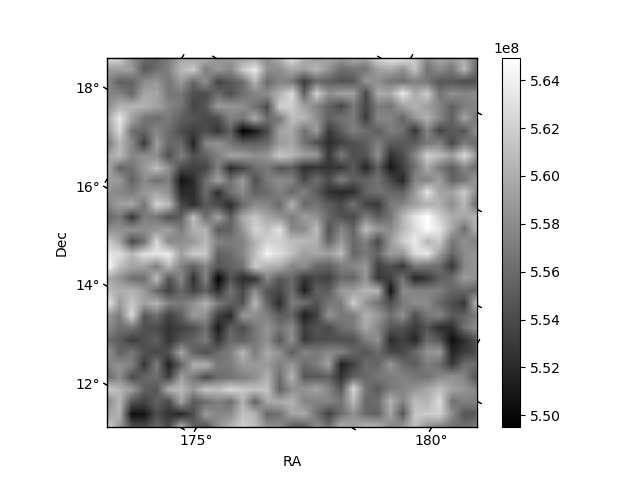
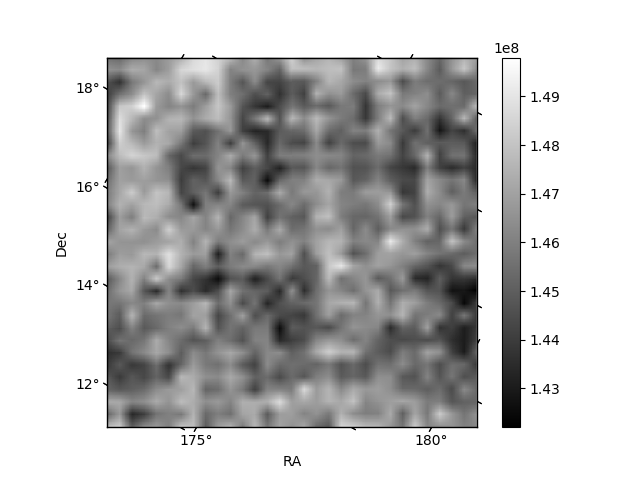
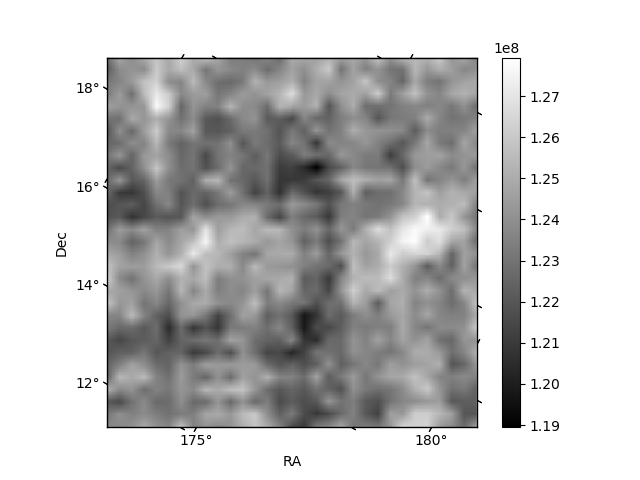
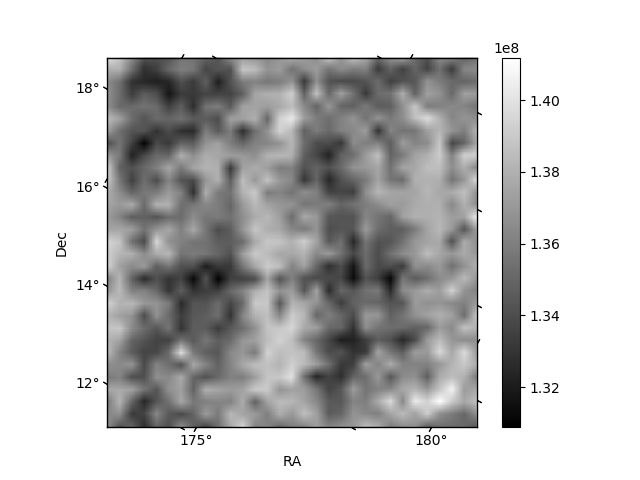
Histogram calculated using DETX and DETY for each event in the final _common_clean file
| Quadrant A | 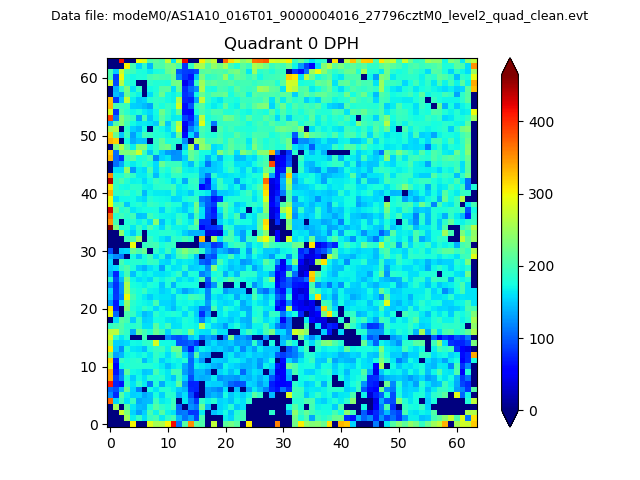 |
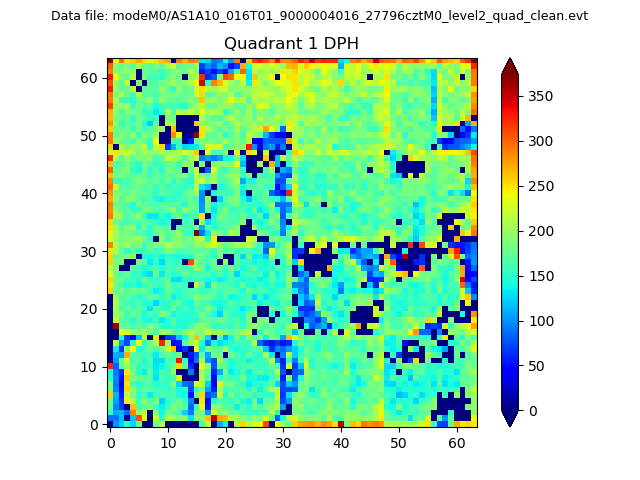 |
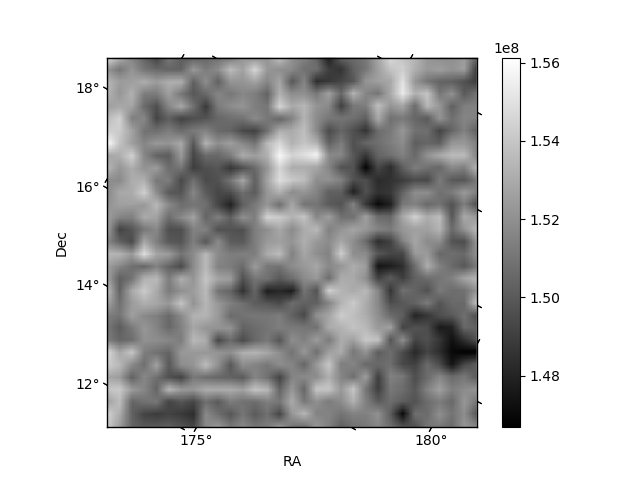
Quadrant B |
|---|---|---|---|
| Quadrant D | 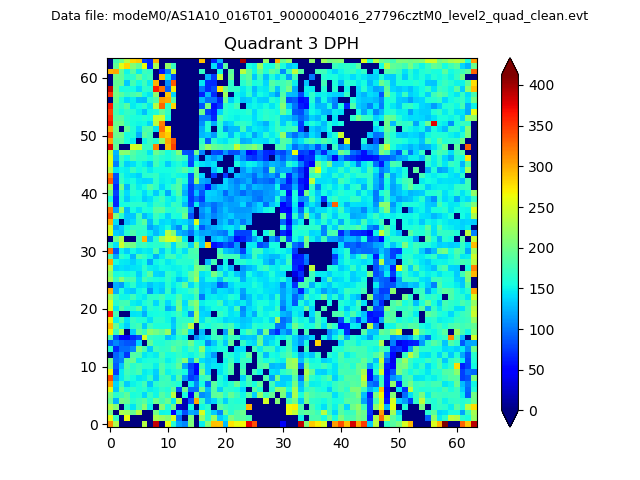 |
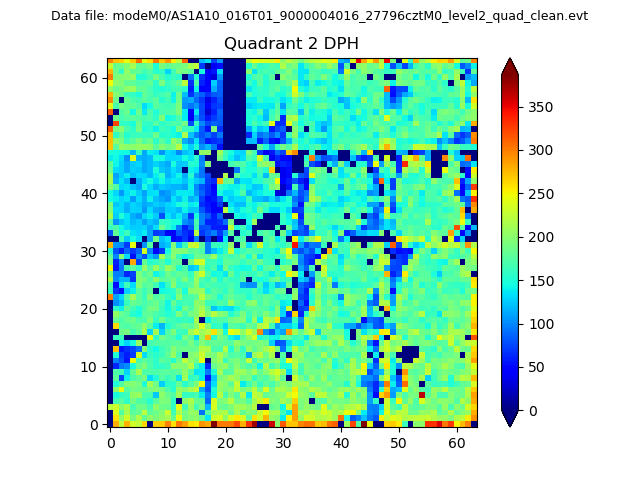 |
Quadrant C |
| Plot type | Count rate plots | Images |
|---|---|---|
| Comparison with Poisson distribution Blue bars denote a histogram of data divided into 1 sec bins. Red curve is a Poisson curve with rate = median count rate of data. |
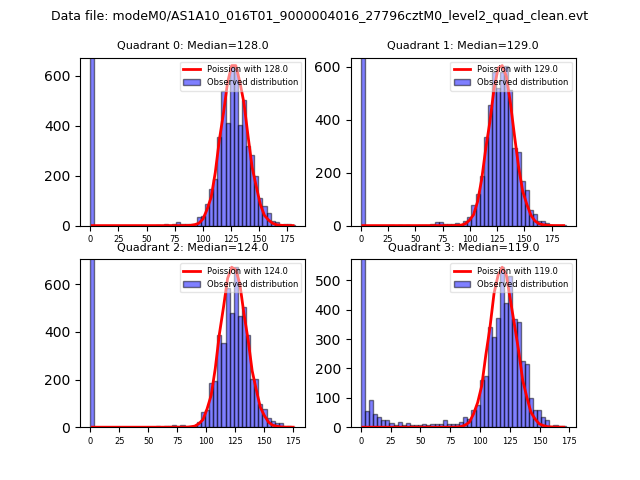 |
 |
| Quadrant-wise count rates Data is divided into 100 sec bins |
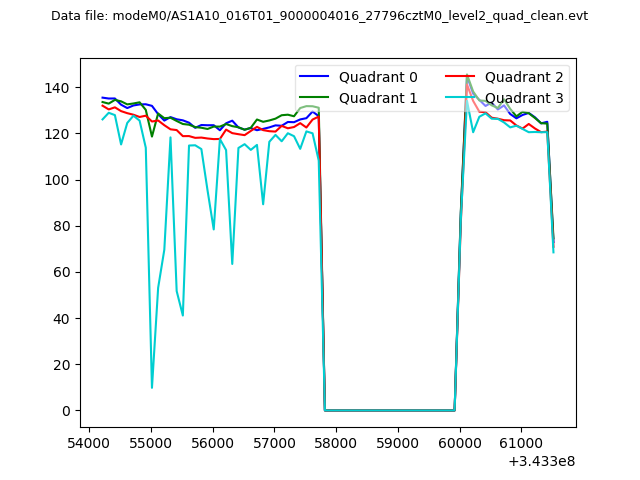 |
|
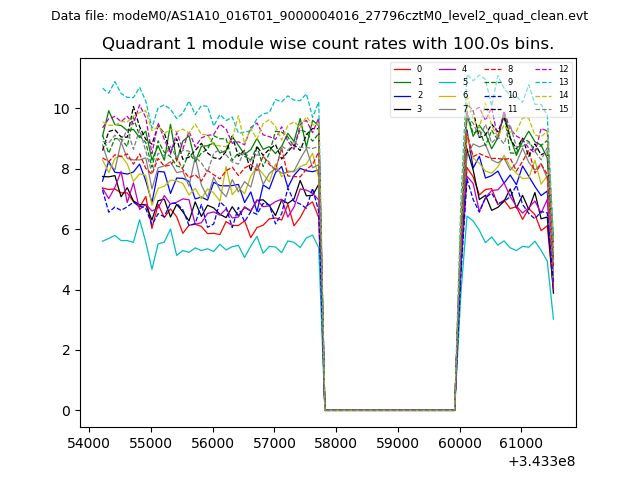
| Module-wise count rates for Quadrant A Data is divided into 100 sec bins |
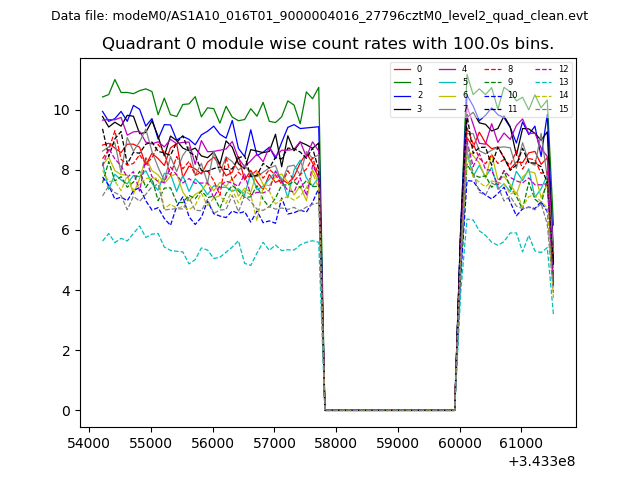 |
 |
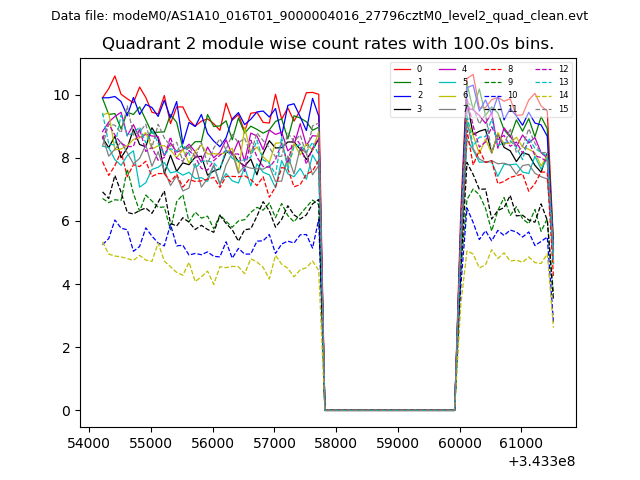
| Module-wise count rates for Quadrant B Data is divided into 100 sec bins |
 |
 |
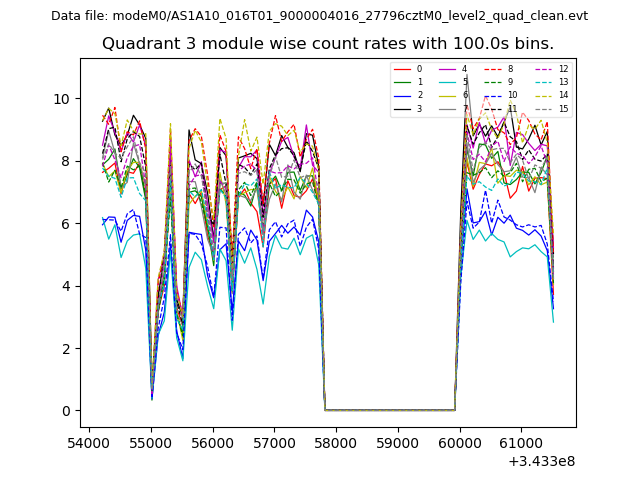
| Module-wise count rates for Quadrant C Data is divided into 100 sec bins |
 |
 |
| Module-wise count rates for Quadrant D Data is divided into 100 sec bins |
 |
 |
| Parameter | Plot |
|---|---|
| CZT HV Monitor | 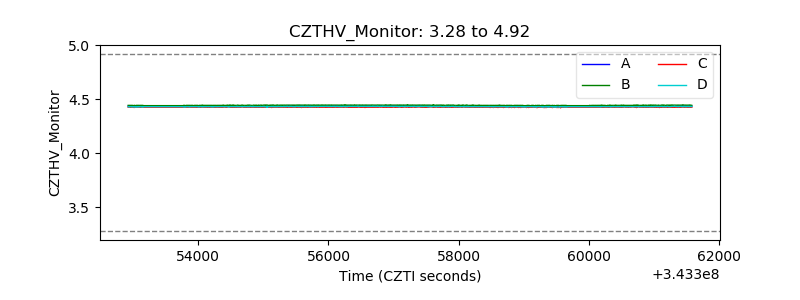 |
| D_VDD | 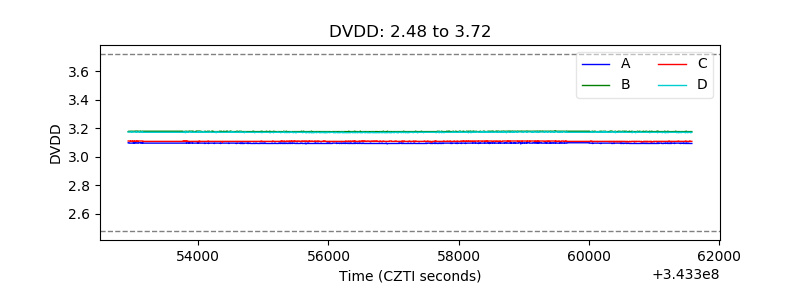 |
| Temperature 1 | 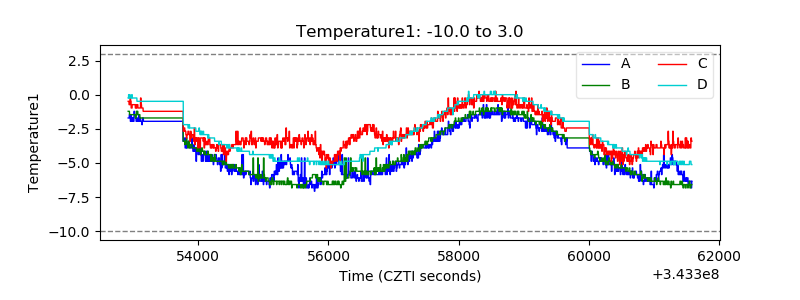 |
| Veto HV Monitor | 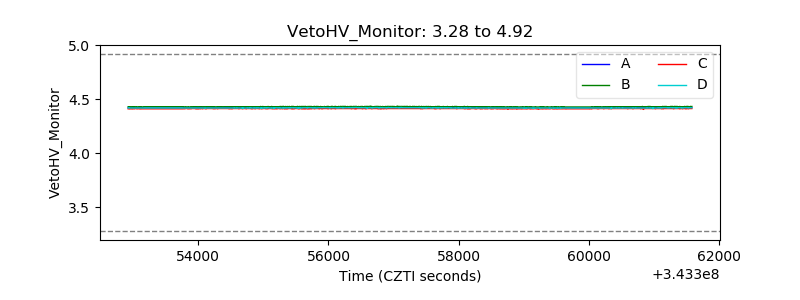 |
| Veto LLD | 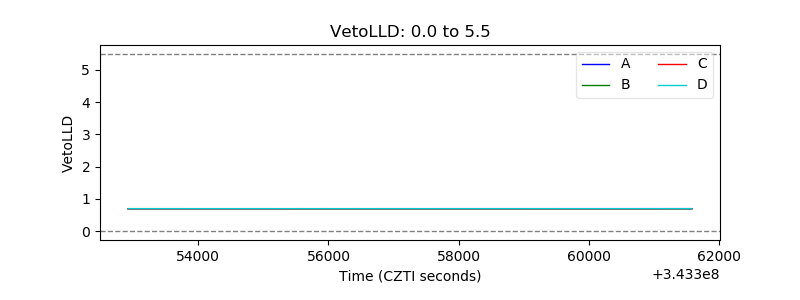 |
| Alpha Counter | 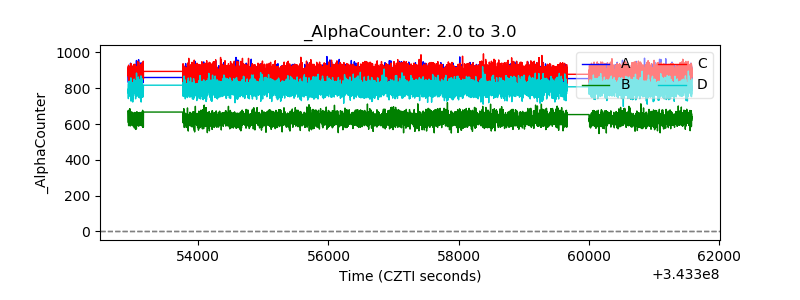 |
| _CPM_Rate | 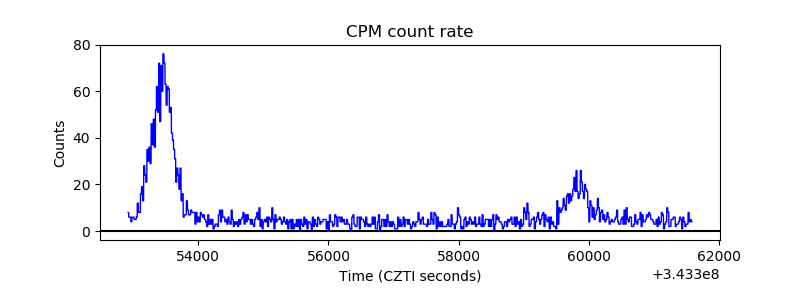 |
| CZT Counter | 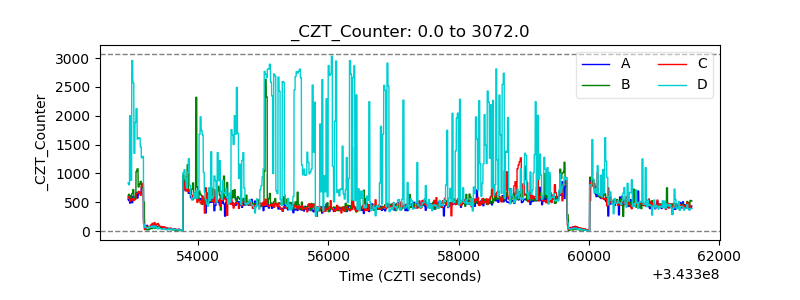 |
| +2.5 Volts monitor |  |
| +5 Volts monitor |  |
| _ROLL_ROT | 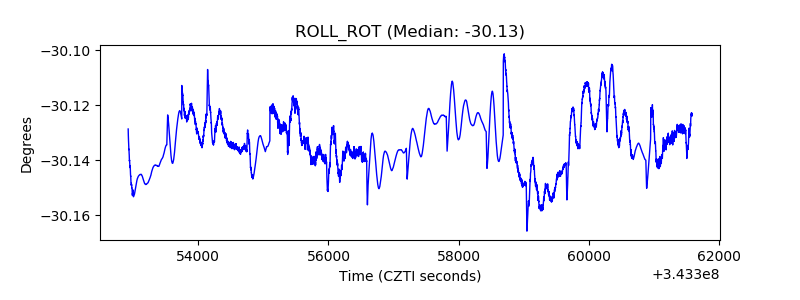 |
| _Roll_DEC |  |
| _Roll_RA | 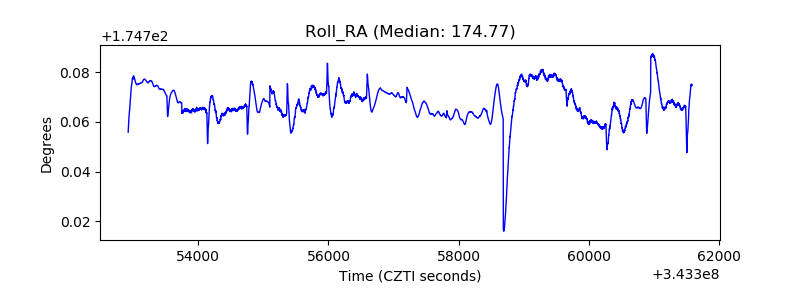 |
| Veto Counter | 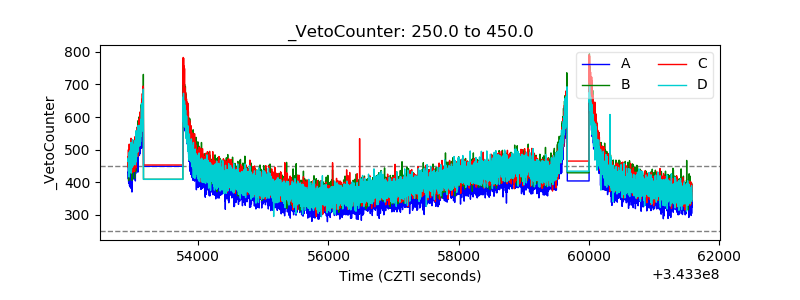 |