| Param | Original file | Final file |
|---|---|---|
| Filename | modeM0/AS1A10_016T01_9000004016_27800cztM0_level2.evt | modeM0/AS1A10_016T01_9000004016_27800cztM0_level2_quad_clean.evt |
| Size (bytes) | 1,950,137,280 | 311,575,680 |
| Size | 1.8 GB | 297.1 MB |
| Events in quadrant A | 11,661,112 | 1,976,595 |
| Events in quadrant B | 13,662,550 | 1,996,219 |
| Events in quadrant C | 11,979,987 | 1,923,395 |
| Events in quadrant D | 20,091,424 | 1,843,111 |
| Mode M9 | |||
|---|---|---|---|
| Quadrant | BADHDUFLAG | Total packets | Discarded packets |
| A | 0 | 24 | 0 |
| B | 0 | 24 | 0 |
| C | 0 | 24 | 0 |
| D | 0 | 24 | 0 |
| Mode M0 | |||
|---|---|---|---|
| Quadrant | BADHDUFLAG | Total packets | Discarded packets |
| A | 0 | 50852 | 0 |
| B | 0 | 56858 | 0 |
| C | 0 | 51399 | 0 |
| D | 0 | 77201 | 0 |
| Quadrant | Total seconds | Saturated seconds | Saturation percentage |
|---|---|---|---|
| A | 24668 | 226 | 0.916167% |
| B | 24669 | 635 | 2.574081% |
| C | 24669 | 429 | 1.739025% |
| D | 24668 | 3066 | 12.429058% |
Noise dominated data is calculated using 1-second bins in cleaned event files. If a bin has >2000 counts, and if more than 50% of those come from <1% of pixels, then it is considered to be noise-dominated and hence unusable.
| Quadrant | # 1 sec bins | Bins with >0 counts | Bins with >2000 counts | High rate bins dominated by noise | Noise dominated (total time) | Noise dominated (detector-on time) | Marked lightcurve |
|---|---|---|---|---|---|---|---|
| A | 27093 | 24671 | 0 | 0 | 0.00% | 0.00% | 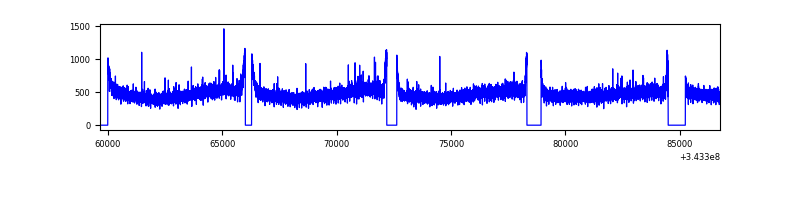 |
| B | 27094 | 24669 | 204 | 204 | 0.75% | 0.83% | 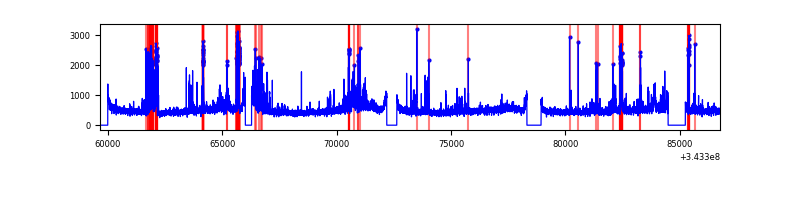 |
| C | 27094 | 24670 | 1 | 1 | 0.00% | 0.00% | 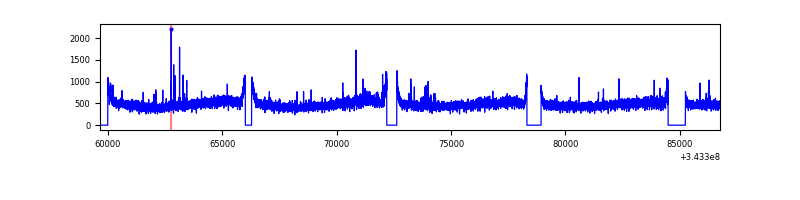 |
| D | 27093 | 24668 | 2692 | 2692 | 9.94% | 10.91% | 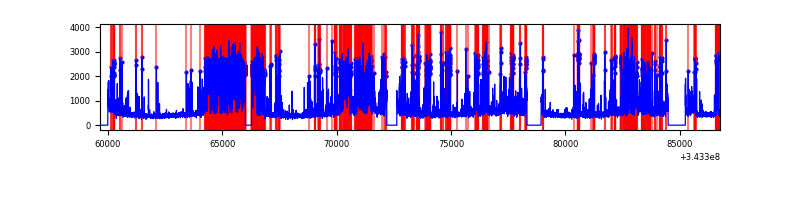 |
Top three noisy pixels from each quadrant. If the there are fewer than three noisy pixels in the level2.evt file, extra rows are filled as -1
| Pixel properties | Quadrant properties | ||||||
|---|---|---|---|---|---|---|---|
| Quadrant | DetID | PixID | Counts | Sigma | Mean | Median | Sigma |
| A | 13 | 254 | 42389 | 64.96 | 3017 | 2955 | 607.0 |
| A | 3 | 137 | 29468 | 43.68 | 3017 | 2955 | 607.0 |
| A | 0 | 226 | 25686 | 37.45 | 3017 | 2955 | 607.0 |
| B | 10 | 245 | 646076 | 1130.47 | 2983 | 2905 | 568.9 |
| B | 10 | 246 | 636517 | 1113.67 | 2983 | 2905 | 568.9 |
| B | 3 | 64 | 465996 | 813.95 | 2983 | 2905 | 568.9 |
| C | 14 | 238 | 461141 | 674.5 | 2889 | 2903 | 679.4 |
| C | 3 | 233 | 215568 | 313.03 | 2889 | 2903 | 679.4 |
| C | 4 | 175 | 33653 | 45.26 | 2889 | 2903 | 679.4 |
| D | 1 | 52 | 4830957 | 7277.47 | 2757 | 2683 | 663.5 |
| D | 11 | 248 | 3612675 | 5441.2 | 2757 | 2683 | 663.5 |
| D | 2 | 250 | 853274 | 1282.06 | 2757 | 2683 | 663.5 |
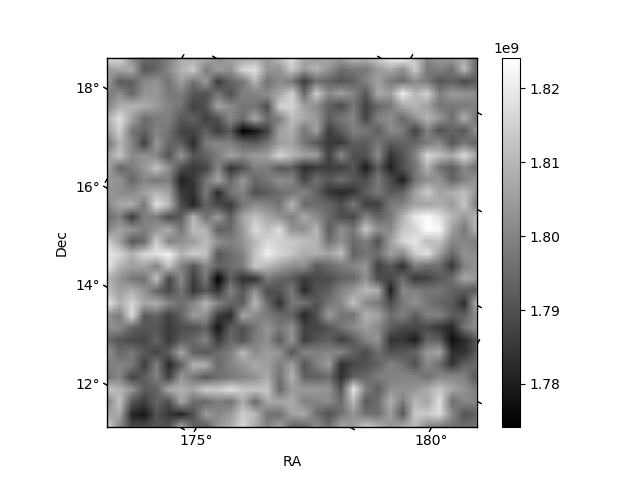
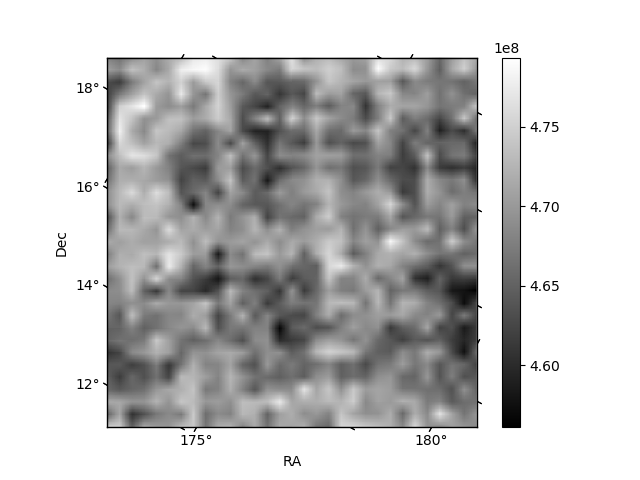
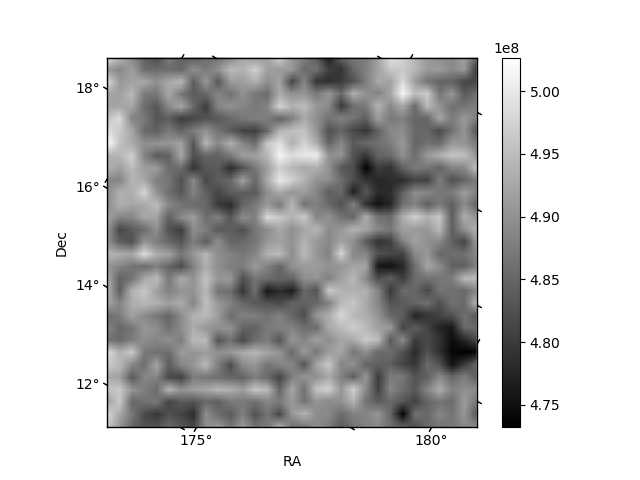
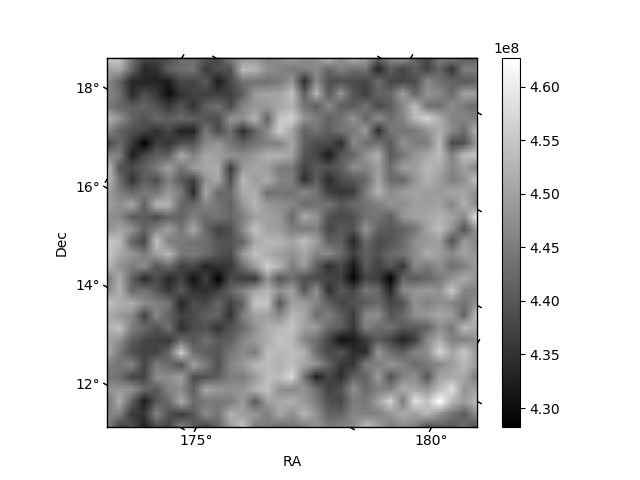
Histogram calculated using DETX and DETY for each event in the final _common_clean file
| Quadrant A | 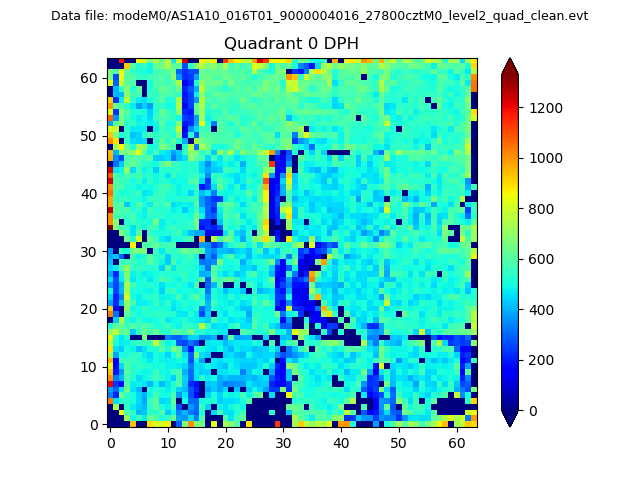 |
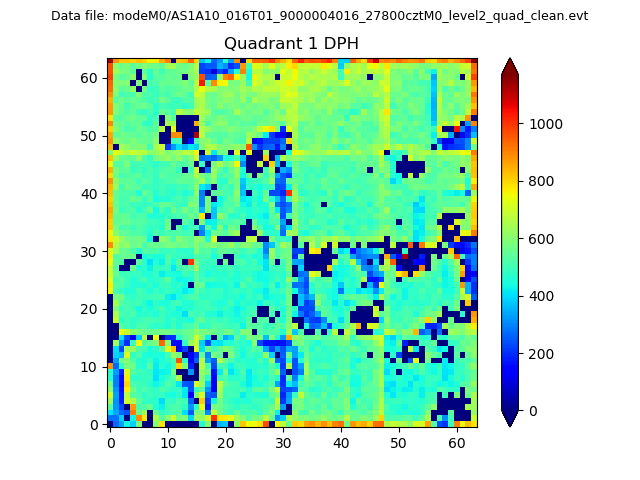 |
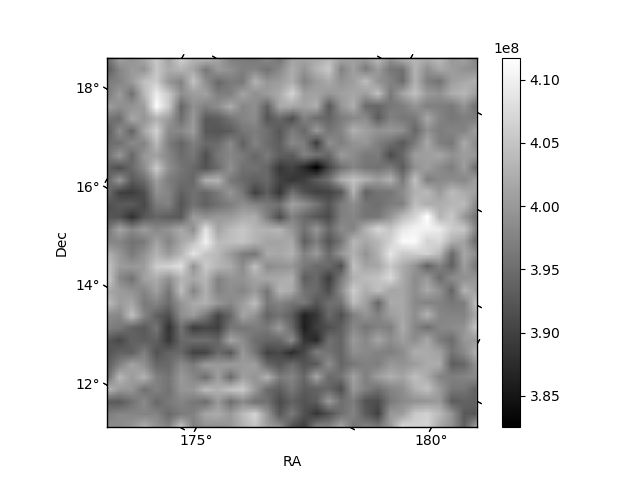
Quadrant B |
|---|---|---|---|
| Quadrant D | 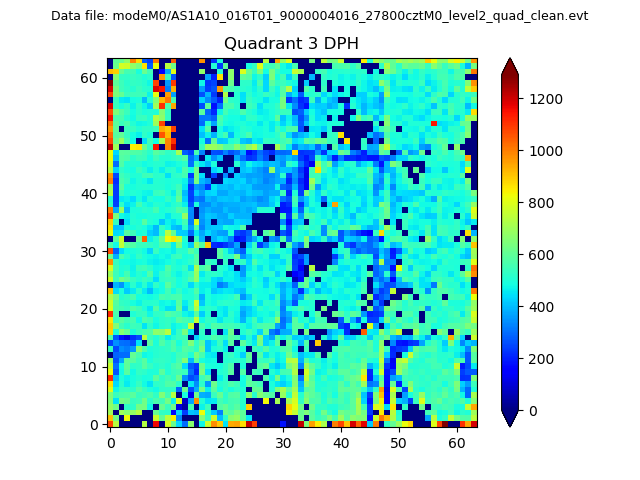 |
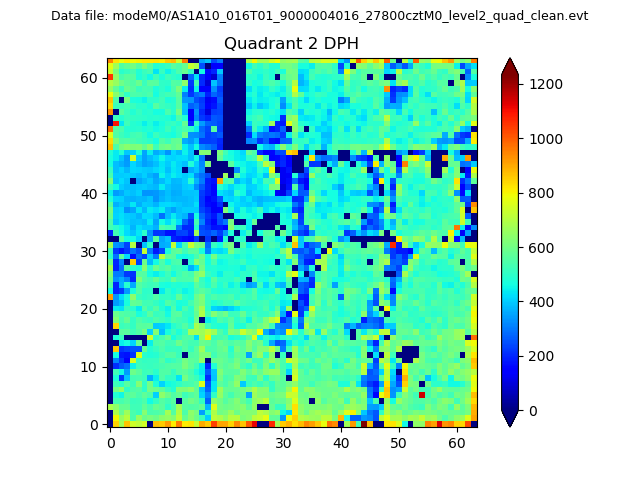 |
Quadrant C |
| Plot type | Count rate plots | Images |
|---|---|---|
| Comparison with Poisson distribution Blue bars denote a histogram of data divided into 1 sec bins. Red curve is a Poisson curve with rate = median count rate of data. |
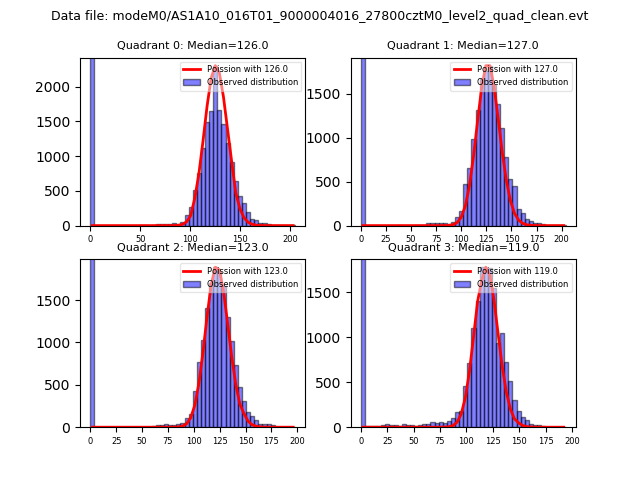 |
 |
| Quadrant-wise count rates Data is divided into 100 sec bins |
 |
|
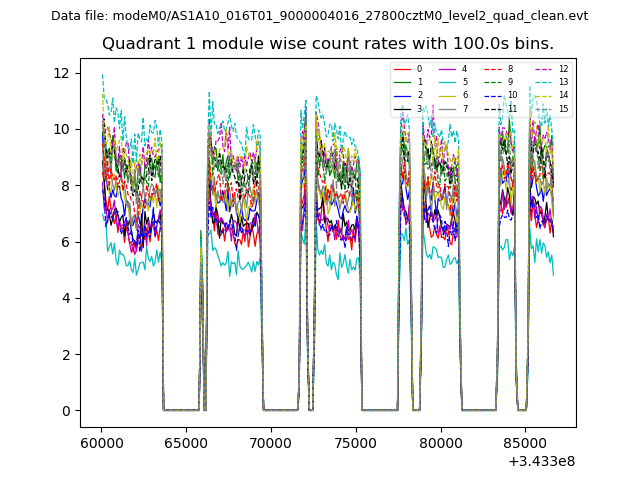
| Module-wise count rates for Quadrant A Data is divided into 100 sec bins |
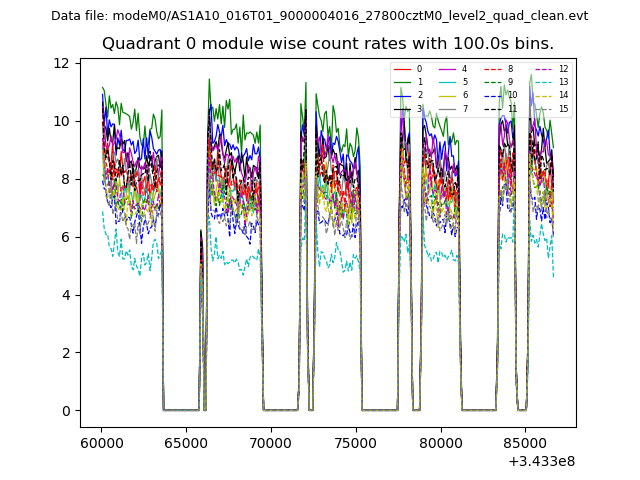 |
 |
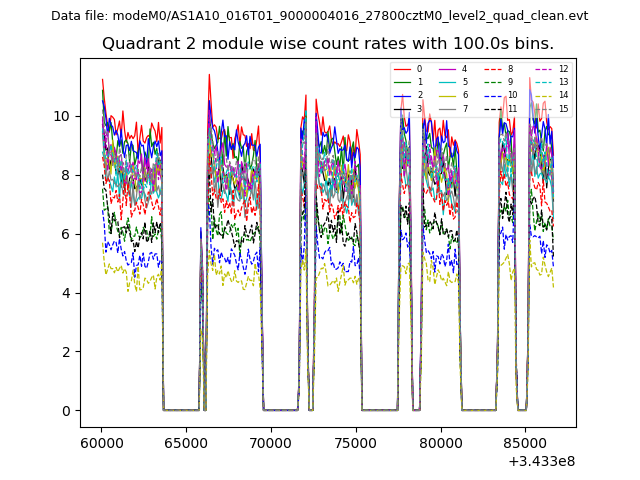
| Module-wise count rates for Quadrant B Data is divided into 100 sec bins |
 |
 |
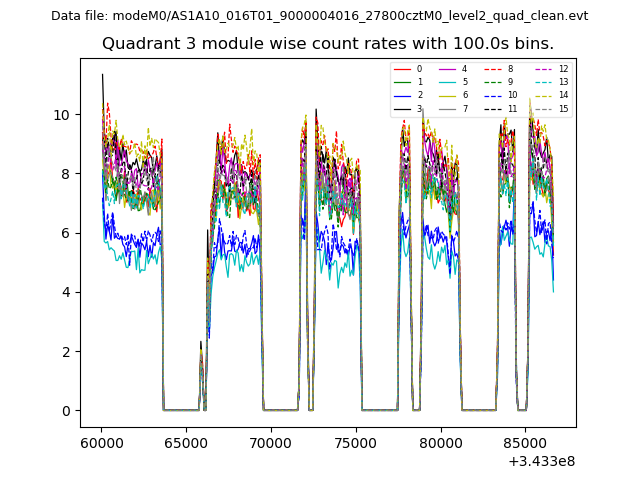
| Module-wise count rates for Quadrant C Data is divided into 100 sec bins |
 |
 |
| Module-wise count rates for Quadrant D Data is divided into 100 sec bins |
 |
 |
| Parameter | Plot |
|---|---|
| CZT HV Monitor | 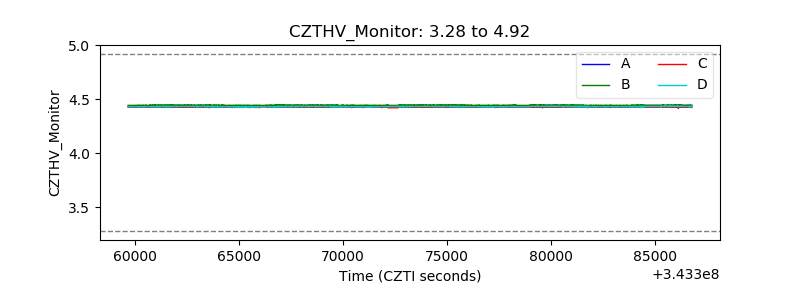 |
| D_VDD | 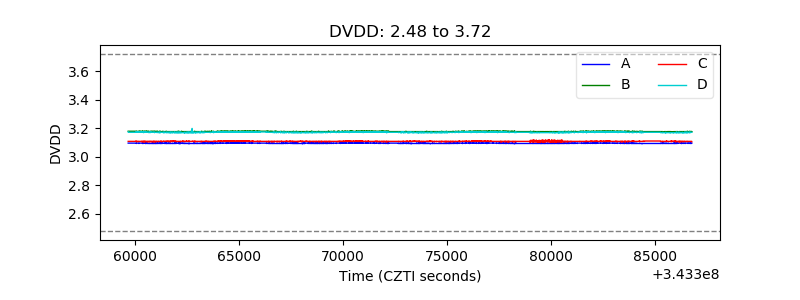 |
| Temperature 1 | 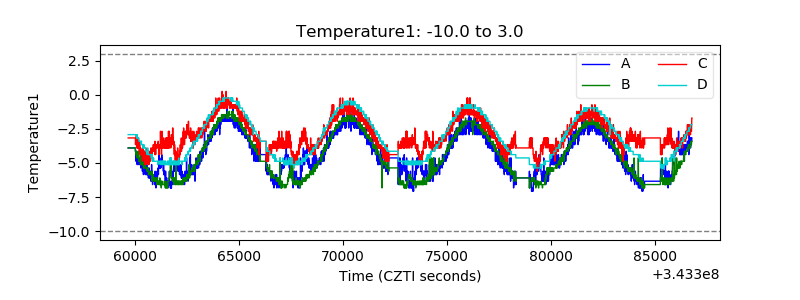 |
| Veto HV Monitor | 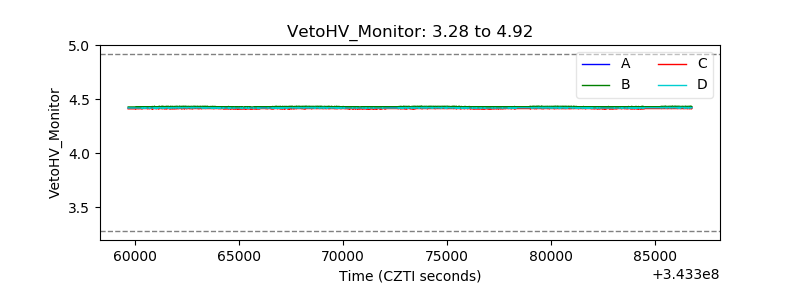 |
| Veto LLD | 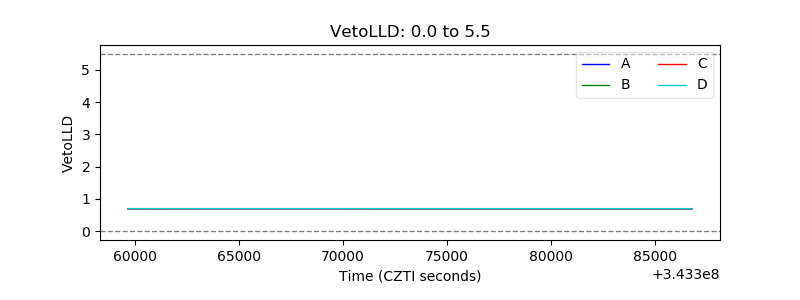 |
| Alpha Counter | 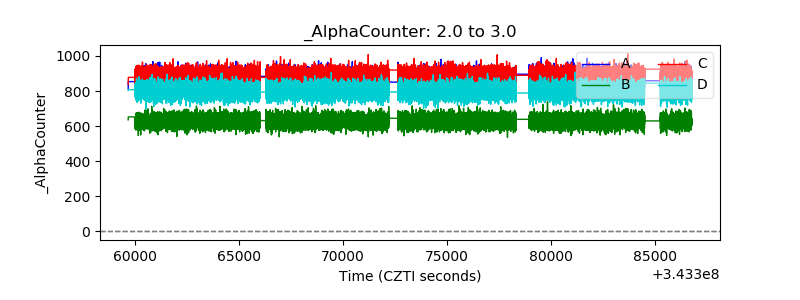 |
| _CPM_Rate | 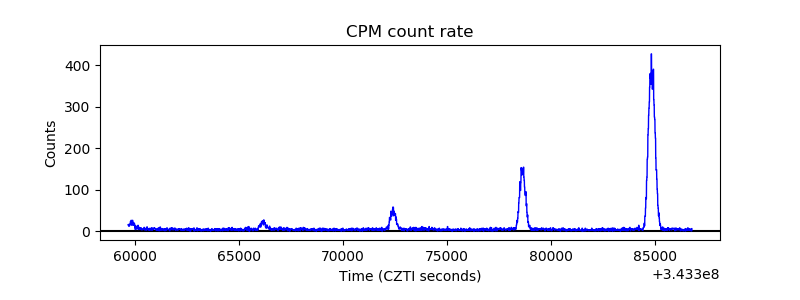 |
| CZT Counter |  |
| +2.5 Volts monitor |  |
| +5 Volts monitor |  |
| _ROLL_ROT | 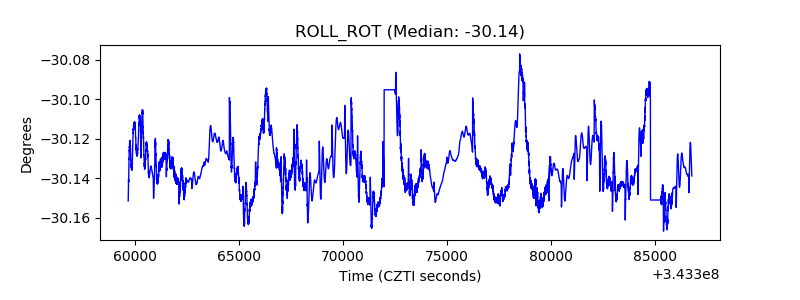 |
| _Roll_DEC | 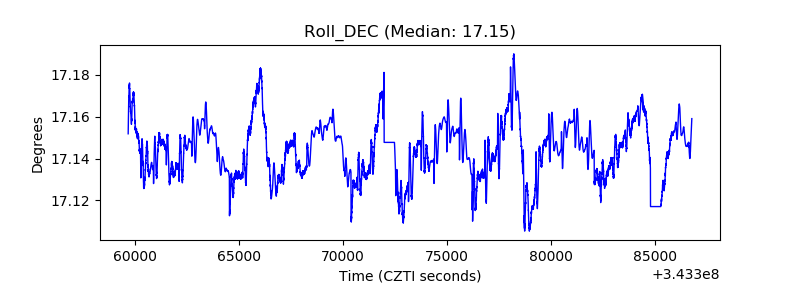 |
| _Roll_RA | 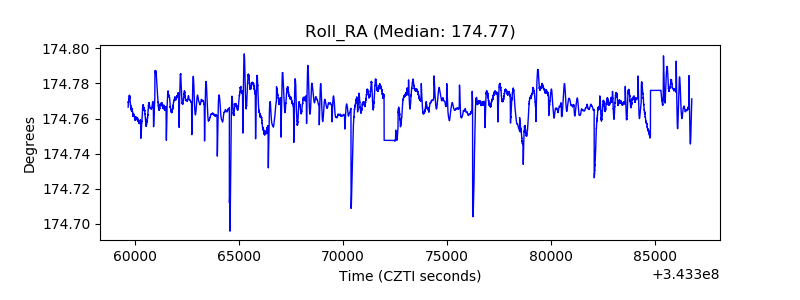 |
| Veto Counter | 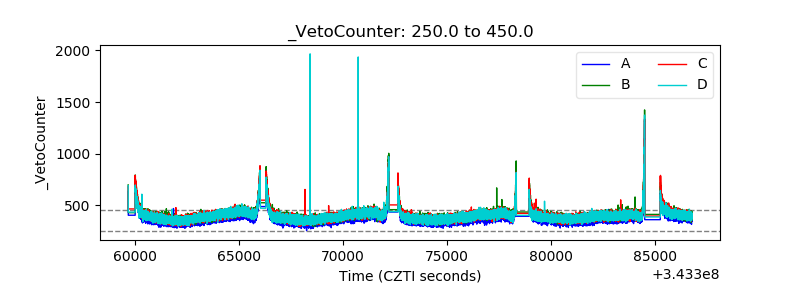 |