| Param | Original file | Final file |
|---|---|---|
| Filename | modeM0/AS1A10_016T01_9000004016_27801cztM0_level2.evt | modeM0/AS1A10_016T01_9000004016_27801cztM0_level2_quad_clean.evt |
| Size (bytes) | 441,754,560 | 77,906,880 |
| Size | 421.3 MB | 74.3 MB |
| Events in quadrant A | 2,830,887 | 493,402 |
| Events in quadrant B | 3,212,377 | 501,668 |
| Events in quadrant C | 2,867,544 | 482,737 |
| Events in quadrant D | 4,060,238 | 462,347 |
| Mode M9 | |||
|---|---|---|---|
| Quadrant | BADHDUFLAG | Total packets | Discarded packets |
| A | 0 | 9 | 0 |
| B | 0 | 9 | 0 |
| C | 0 | 9 | 0 |
| D | 0 | 9 | 0 |
| Mode M0 | |||
|---|---|---|---|
| Quadrant | BADHDUFLAG | Total packets | Discarded packets |
| A | 0 | 12128 | 0 |
| B | 0 | 13189 | 0 |
| C | 0 | 12146 | 0 |
| D | 0 | 16107 | 0 |
| Quadrant | Total seconds | Saturated seconds | Saturation percentage |
|---|---|---|---|
| A | 5977 | 27 | 0.451732% |
| B | 5975 | 55 | 0.920502% |
| C | 5972 | 58 | 0.971199% |
| D | 5946 | 179 | 3.010427% |
Noise dominated data is calculated using 1-second bins in cleaned event files. If a bin has >2000 counts, and if more than 50% of those come from <1% of pixels, then it is considered to be noise-dominated and hence unusable.
| Quadrant | # 1 sec bins | Bins with >0 counts | Bins with >2000 counts | High rate bins dominated by noise | Noise dominated (total time) | Noise dominated (detector-on time) | Marked lightcurve |
|---|---|---|---|---|---|---|---|
| A | 7439 | 6054 | 0 | 0 | 0.00% | 0.00% | 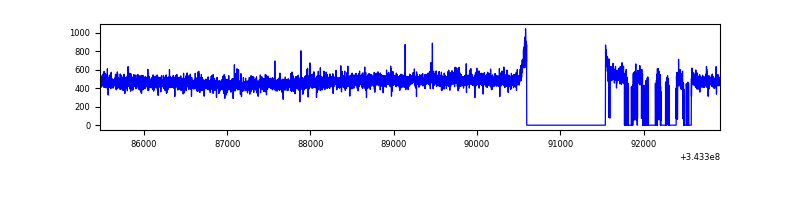 |
| B | 7440 | 6038 | 10 | 10 | 0.13% | 0.17% | 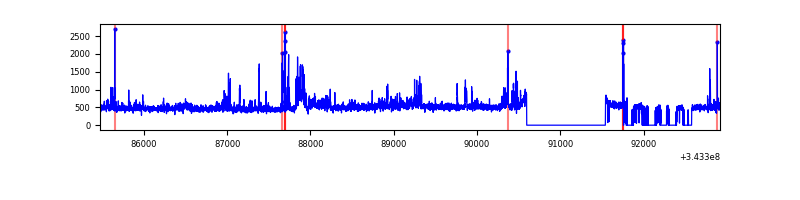 |
| C | 7439 | 6048 | 0 | 0 | 0.00% | 0.00% | 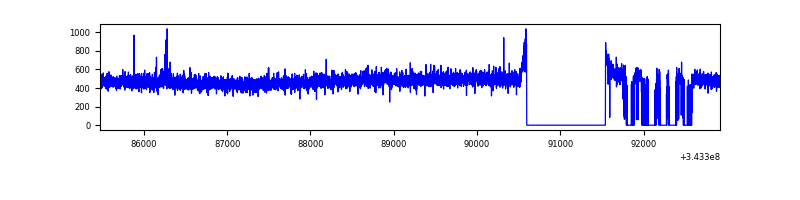 |
| D | 7439 | 6019 | 128 | 128 | 1.72% | 2.13% | 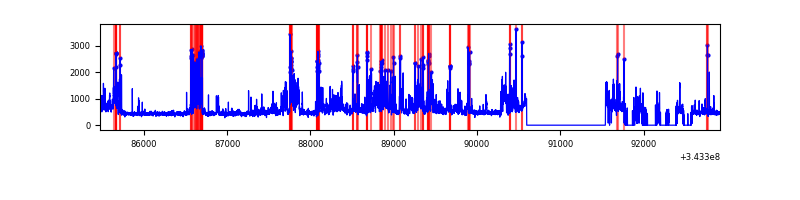 |
Top three noisy pixels from each quadrant. If the there are fewer than three noisy pixels in the level2.evt file, extra rows are filled as -1
| Pixel properties | Quadrant properties | ||||||
|---|---|---|---|---|---|---|---|
| Quadrant | DetID | PixID | Counts | Sigma | Mean | Median | Sigma |
| A | 13 | 254 | 10103 | 63.51 | 733 | 717 | 147.8 |
| A | 3 | 137 | 6871 | 41.64 | 733 | 717 | 147.8 |
| A | 0 | 226 | 6330 | 37.98 | 733 | 717 | 147.8 |
| B | 3 | 64 | 181507 | 1308.16 | 723 | 705 | 138.2 |
| B | 10 | 245 | 83386 | 598.23 | 723 | 705 | 138.2 |
| B | 10 | 246 | 49976 | 356.49 | 723 | 705 | 138.2 |
| C | 14 | 238 | 113291 | 685.05 | 700 | 703 | 164.4 |
| C | 3 | 233 | 14110 | 81.58 | 700 | 703 | 164.4 |
| C | 4 | 175 | 11120 | 63.38 | 700 | 703 | 164.4 |
| D | 1 | 52 | 1227038 | 7267.66 | 699 | 679 | 168.7 |
| D | 2 | 250 | 125002 | 736.76 | 699 | 679 | 168.7 |
| D | 7 | 69 | 45741 | 267.05 | 699 | 679 | 168.7 |
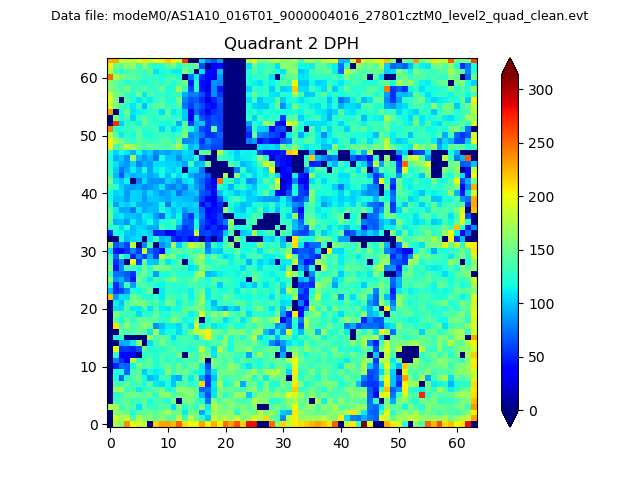
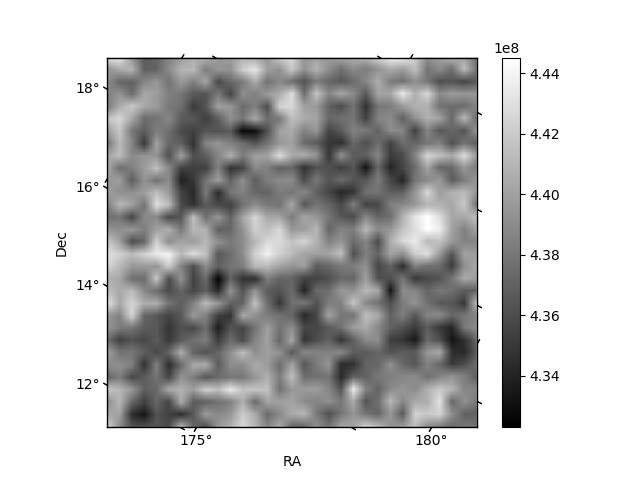
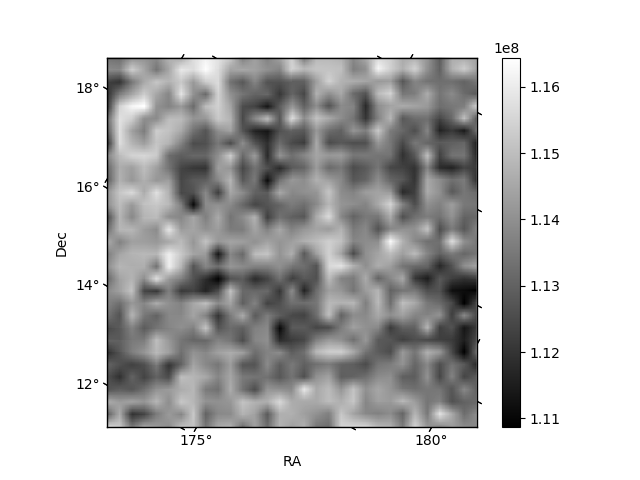
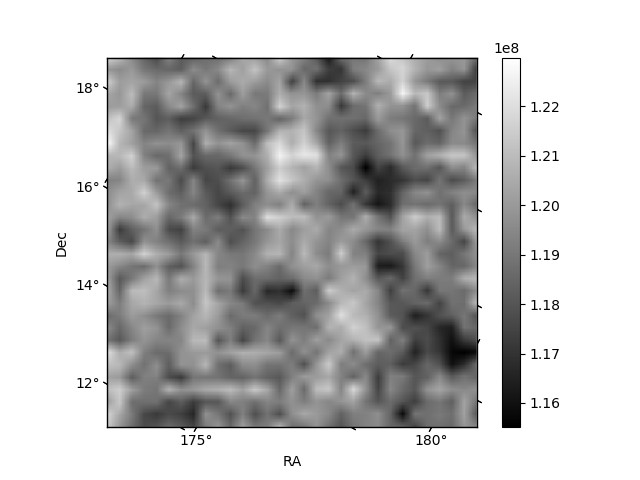
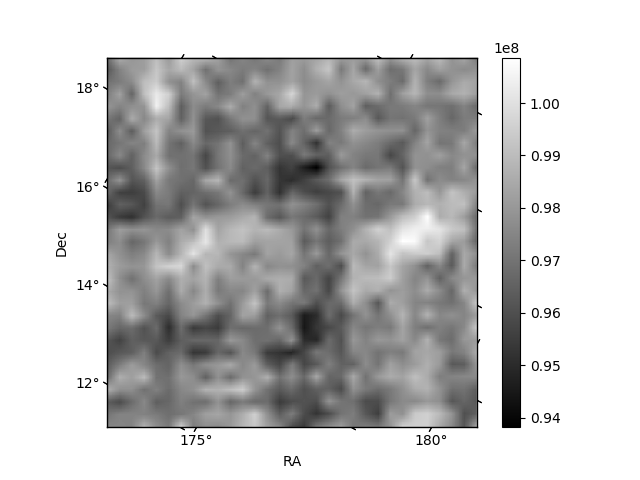
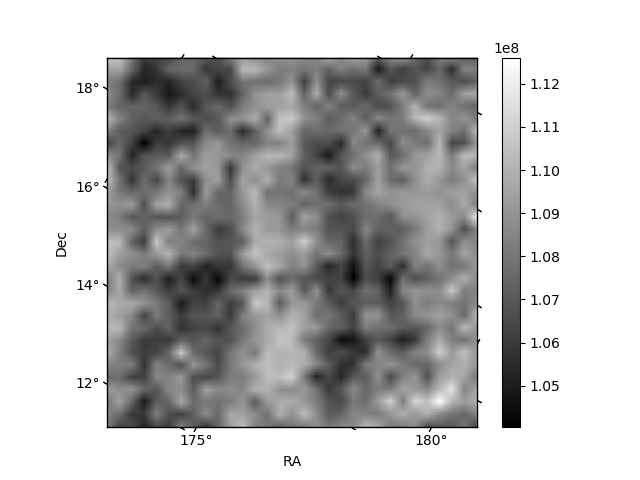
Histogram calculated using DETX and DETY for each event in the final _common_clean file
| Quadrant A | 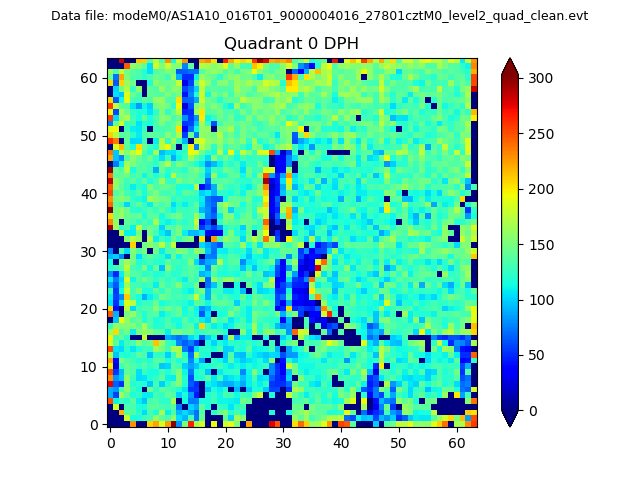 |
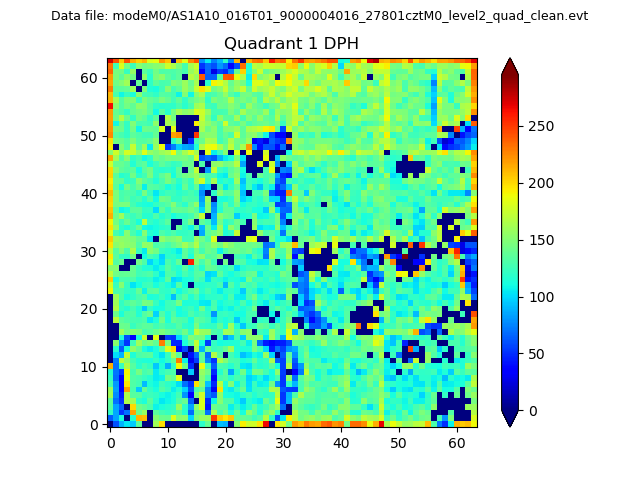 |
Quadrant B |
|---|---|---|---|
| Quadrant D | 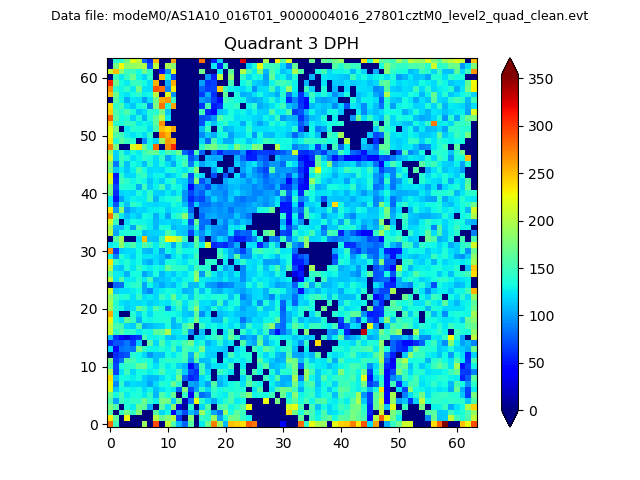 |
 |
Quadrant C |
| Plot type | Count rate plots | Images |
|---|---|---|
| Comparison with Poisson distribution Blue bars denote a histogram of data divided into 1 sec bins. Red curve is a Poisson curve with rate = median count rate of data. |
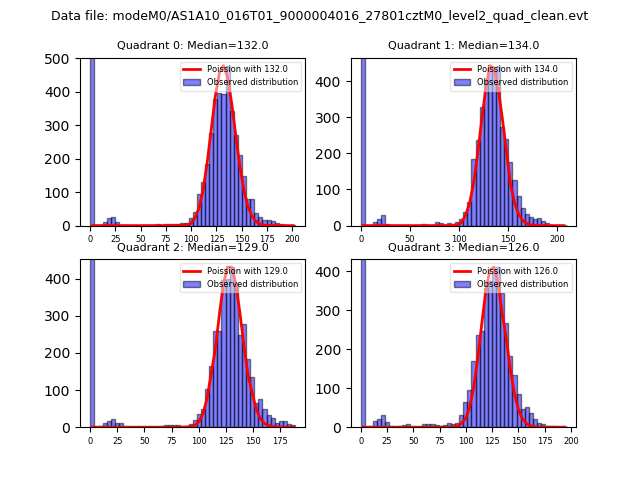 |
 |
| Quadrant-wise count rates Data is divided into 100 sec bins |
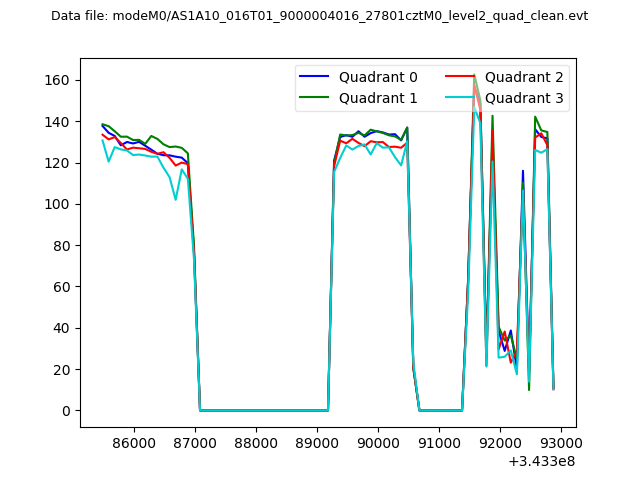 |
|
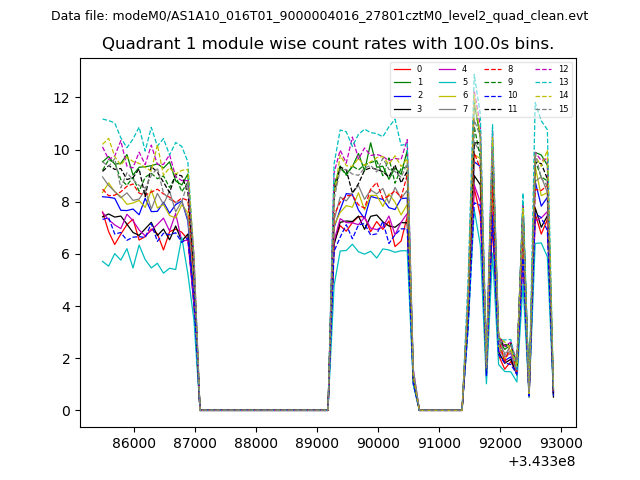
| Module-wise count rates for Quadrant A Data is divided into 100 sec bins |
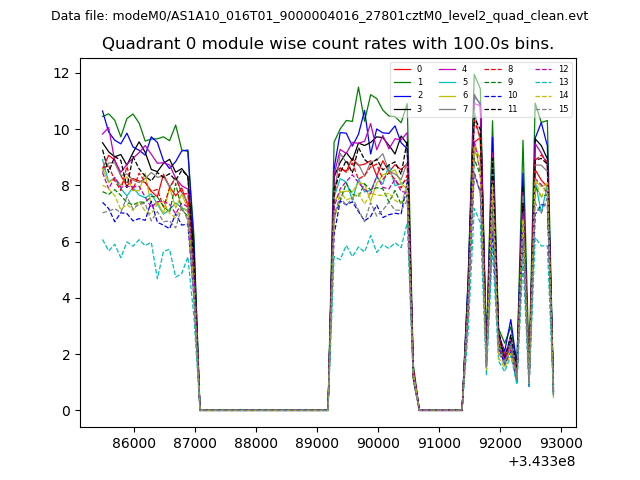 |
 |
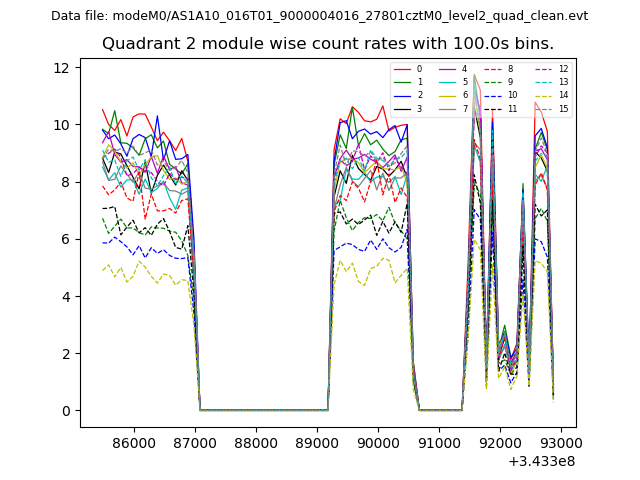
| Module-wise count rates for Quadrant B Data is divided into 100 sec bins |
 |
 |
| Module-wise count rates for Quadrant C Data is divided into 100 sec bins |
 |
 |
| Module-wise count rates for Quadrant D Data is divided into 100 sec bins |
 |
 |
| Parameter | Plot |
|---|---|
| CZT HV Monitor | 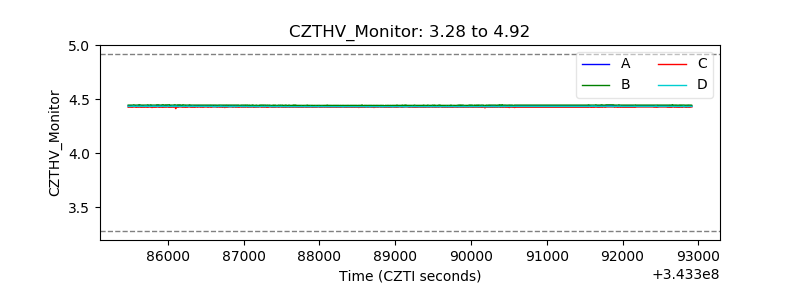 |
| D_VDD |  |
| Temperature 1 | 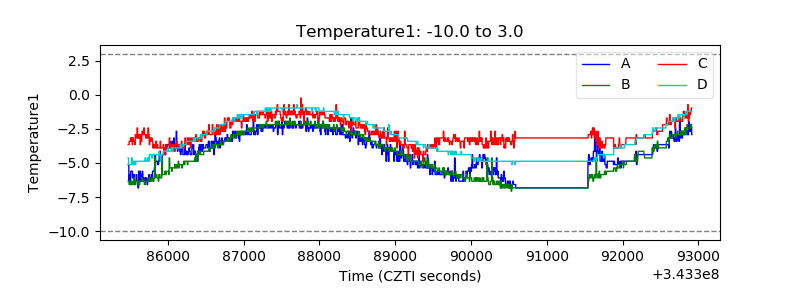 |
| Veto HV Monitor | 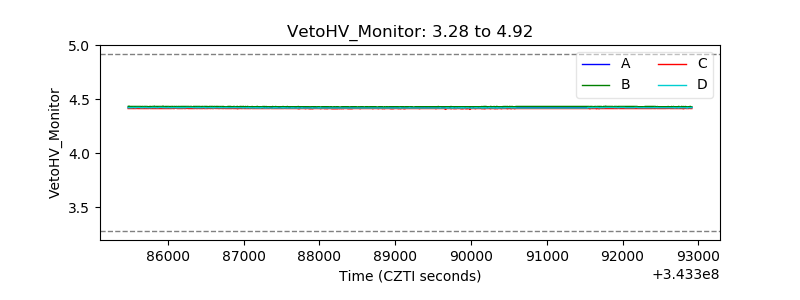 |
| Veto LLD |  |
| Alpha Counter | 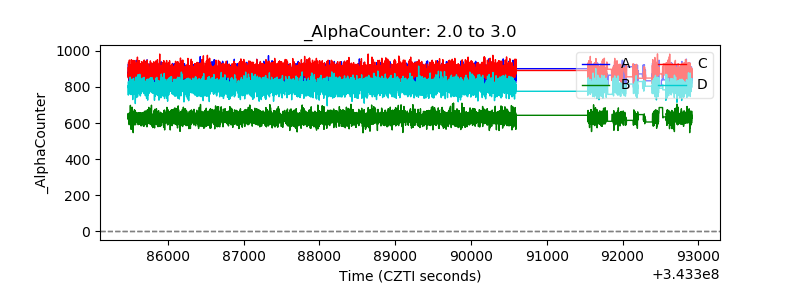 |
| _CPM_Rate | 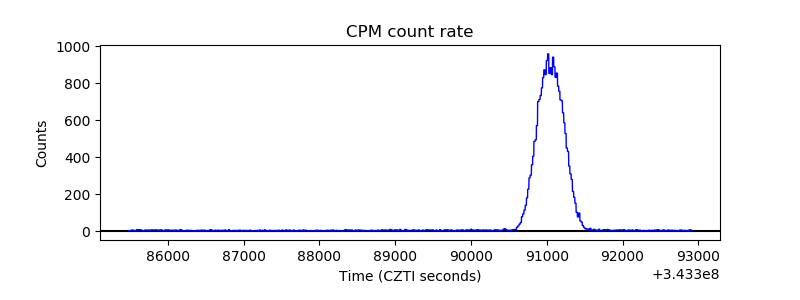 |
| CZT Counter | 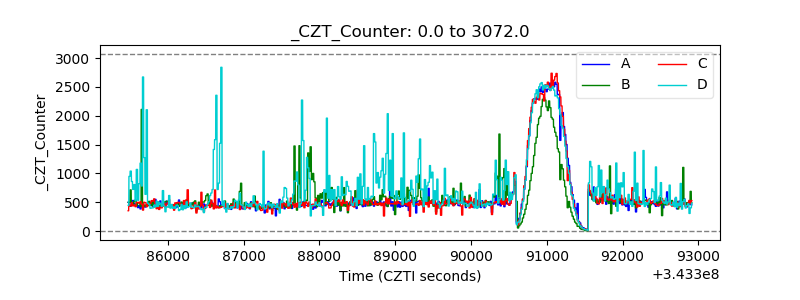 |
| +2.5 Volts monitor |  |
| +5 Volts monitor |  |
| _ROLL_ROT | 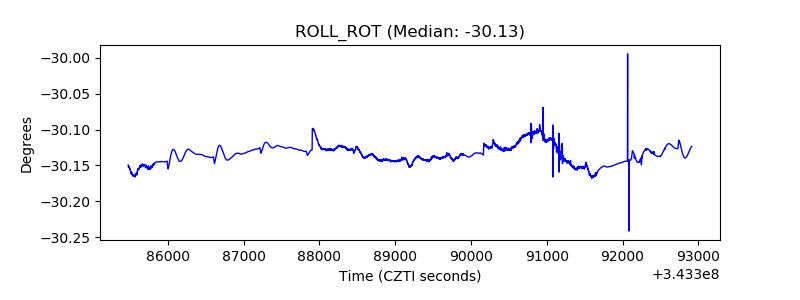 |
| _Roll_DEC | 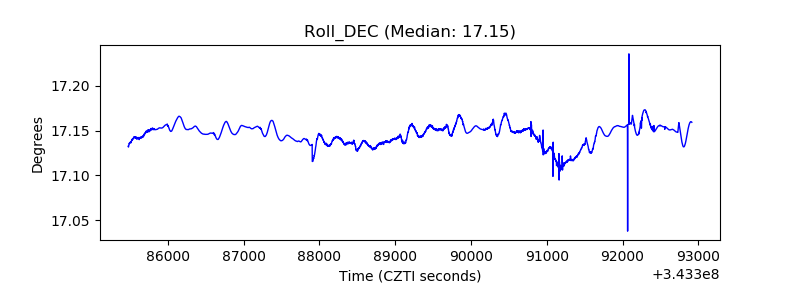 |
| _Roll_RA | 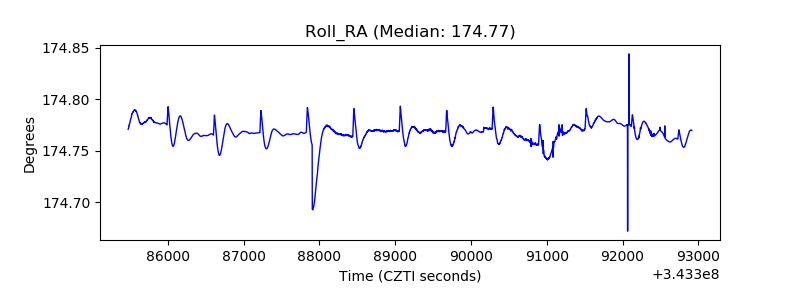 |
| Veto Counter | 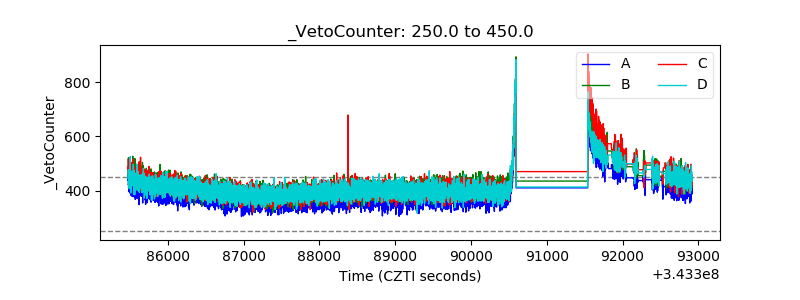 |