| Param | Original file | Final file |
|---|---|---|
| Filename | modeM0/AS1A10_016T01_9000004016_27803cztM0_level2.evt | modeM0/AS1A10_016T01_9000004016_27803cztM0_level2_quad_clean.evt |
| Size (bytes) | 415,457,280 | 73,987,200 |
| Size | 396.2 MB | 70.6 MB |
| Events in quadrant A | 2,853,455 | 466,441 |
| Events in quadrant B | 2,932,279 | 472,219 |
| Events in quadrant C | 2,990,344 | 454,928 |
| Events in quadrant D | 3,413,962 | 443,683 |
| Mode M9 | |||
|---|---|---|---|
| Quadrant | BADHDUFLAG | Total packets | Discarded packets |
| A | 0 | 11 | 0 |
| B | 0 | 11 | 0 |
| C | 0 | 11 | 0 |
| D | 0 | 11 | 0 |
| Mode M0 | |||
|---|---|---|---|
| Quadrant | BADHDUFLAG | Total packets | Discarded packets |
| A | 0 | 12003 | 0 |
| B | 0 | 12183 | 0 |
| C | 0 | 12261 | 0 |
| D | 0 | 13865 | 0 |
| Quadrant | Total seconds | Saturated seconds | Saturation percentage |
|---|---|---|---|
| A | 5771 | 45 | 0.779761% |
| B | 5771 | 47 | 0.814417% |
| C | 5771 | 58 | 1.005025% |
| D | 5771 | 106 | 1.836770% |
Noise dominated data is calculated using 1-second bins in cleaned event files. If a bin has >2000 counts, and if more than 50% of those come from <1% of pixels, then it is considered to be noise-dominated and hence unusable.
| Quadrant | # 1 sec bins | Bins with >0 counts | Bins with >2000 counts | High rate bins dominated by noise | Noise dominated (total time) | Noise dominated (detector-on time) | Marked lightcurve |
|---|---|---|---|---|---|---|---|
| A | 6861 | 5771 | 0 | 0 | 0.00% | 0.00% | 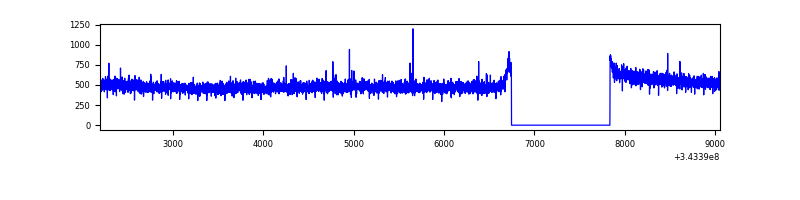 |
| B | 6861 | 5771 | 1 | 1 | 0.01% | 0.02% | 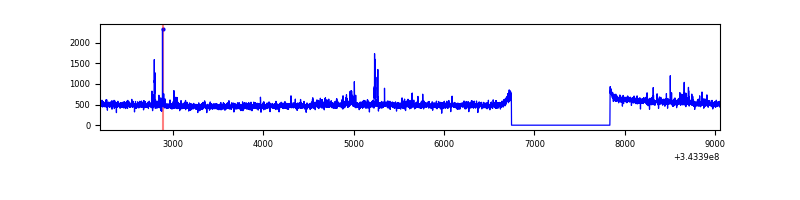 |
| C | 6861 | 5771 | 3 | 3 | 0.04% | 0.05% | 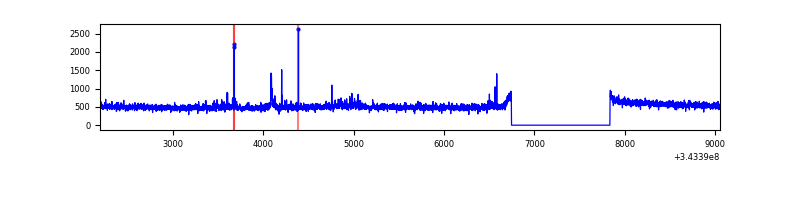 |
| D | 6861 | 5771 | 72 | 72 | 1.05% | 1.25% | 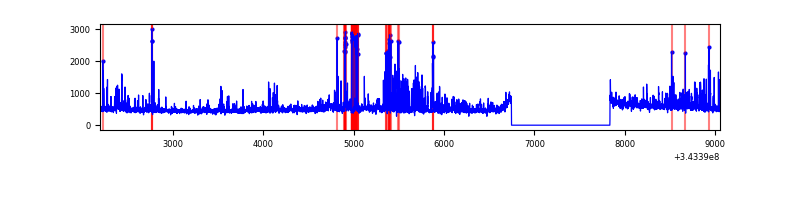 |
Top three noisy pixels from each quadrant. If the there are fewer than three noisy pixels in the level2.evt file, extra rows are filled as -1
| Pixel properties | Quadrant properties | ||||||
|---|---|---|---|---|---|---|---|
| Quadrant | DetID | PixID | Counts | Sigma | Mean | Median | Sigma |
| A | 13 | 254 | 9445 | 58.89 | 739 | 724 | 148.1 |
| A | 3 | 137 | 6759 | 40.75 | 739 | 724 | 148.1 |
| A | 0 | 226 | 6315 | 37.75 | 739 | 724 | 148.1 |
| B | 10 | 245 | 22746 | 157.73 | 730 | 712 | 139.7 |
| B | 0 | 190 | 19183 | 132.22 | 730 | 712 | 139.7 |
| B | 12 | 111 | 16700 | 114.45 | 730 | 712 | 139.7 |
| C | 14 | 238 | 114747 | 679.42 | 712 | 716 | 167.8 |
| C | 3 | 233 | 87365 | 516.27 | 712 | 716 | 167.8 |
| C | 2 | 16 | 11346 | 63.34 | 712 | 716 | 167.8 |
| D | 1 | 52 | 392482 | 2298.1 | 715 | 698 | 170.5 |
| D | 11 | 248 | 219471 | 1283.26 | 715 | 698 | 170.5 |
| D | 2 | 250 | 71268 | 413.95 | 715 | 698 | 170.5 |
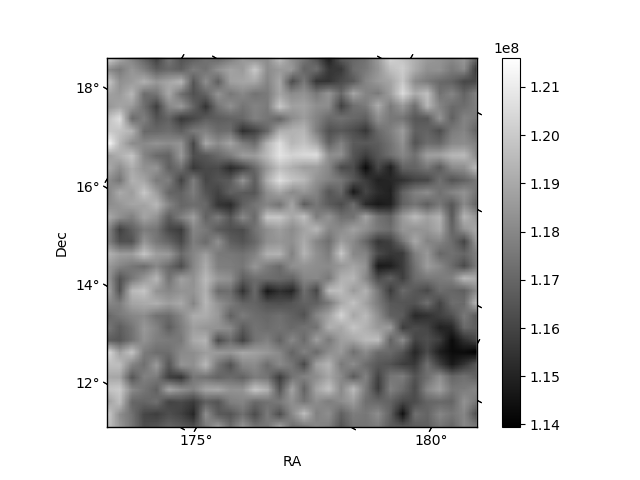
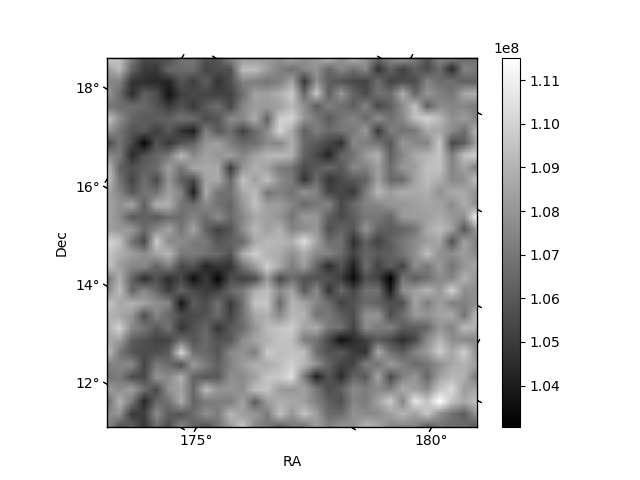
Histogram calculated using DETX and DETY for each event in the final _common_clean file
| Quadrant A | 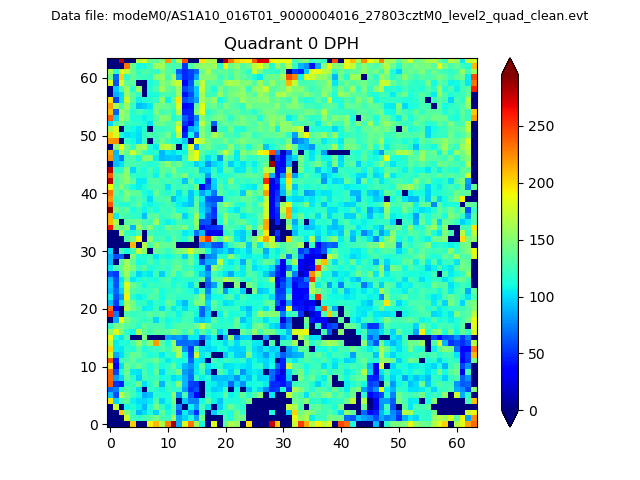 |
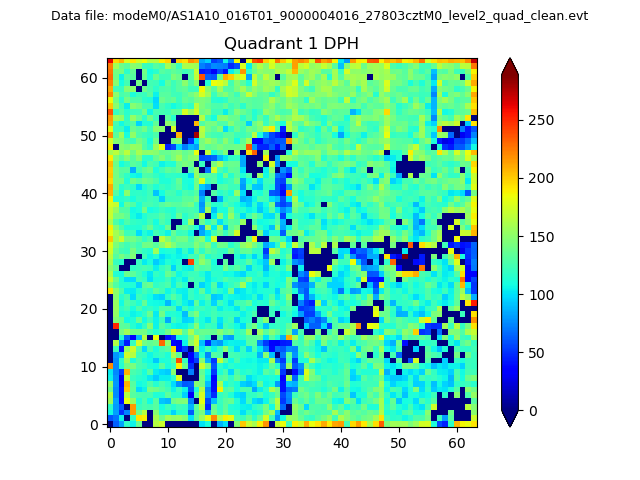 |
Quadrant B |
|---|---|---|---|
| Quadrant D | 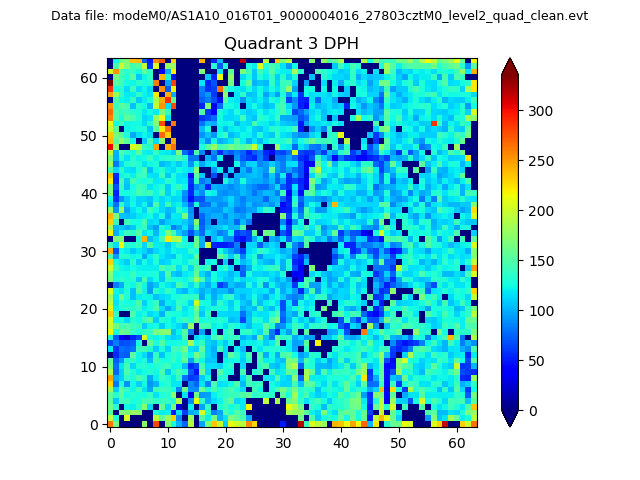 |
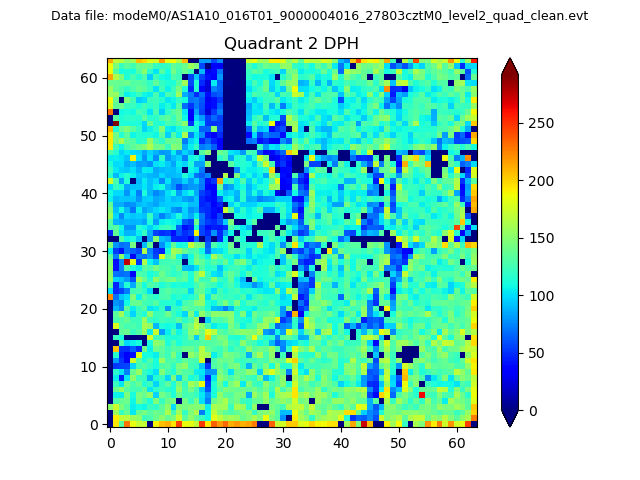 |
Quadrant C |
| Plot type | Count rate plots | Images |
|---|---|---|
| Comparison with Poisson distribution Blue bars denote a histogram of data divided into 1 sec bins. Red curve is a Poisson curve with rate = median count rate of data. |
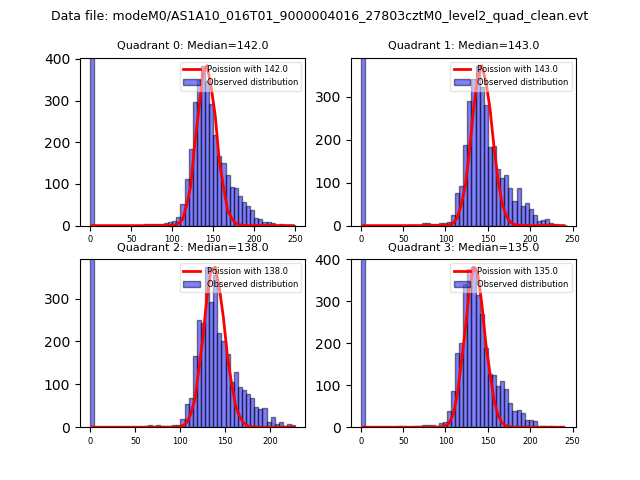 |
 |
| Quadrant-wise count rates Data is divided into 100 sec bins |
 |
|
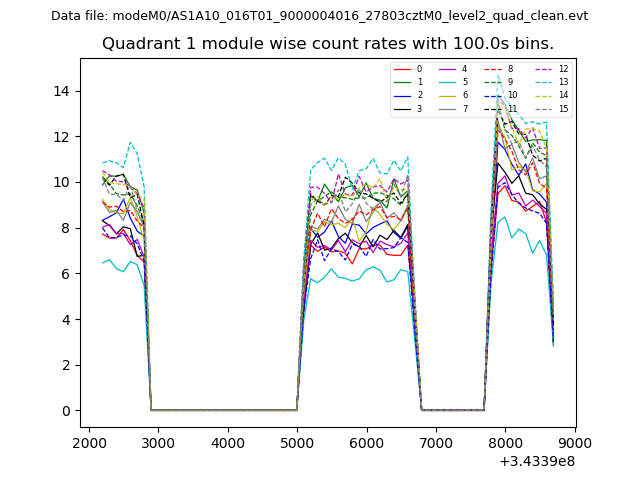
| Module-wise count rates for Quadrant A Data is divided into 100 sec bins |
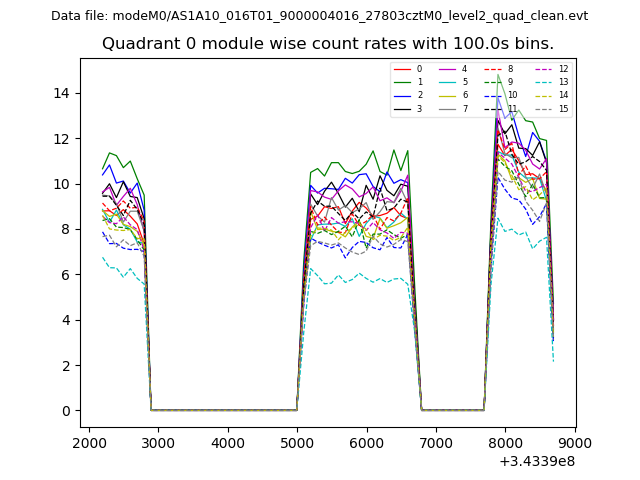 |
 |
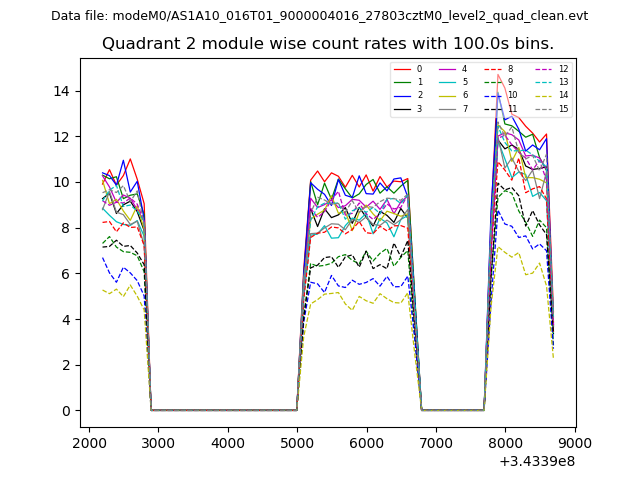
| Module-wise count rates for Quadrant B Data is divided into 100 sec bins |
 |
 |
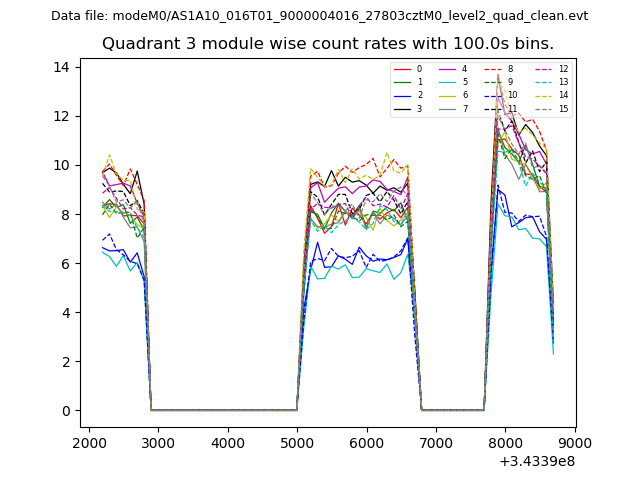
| Module-wise count rates for Quadrant C Data is divided into 100 sec bins |
 |
 |
| Module-wise count rates for Quadrant D Data is divided into 100 sec bins |
 |
 |
| Parameter | Plot |
|---|---|
| CZT HV Monitor | 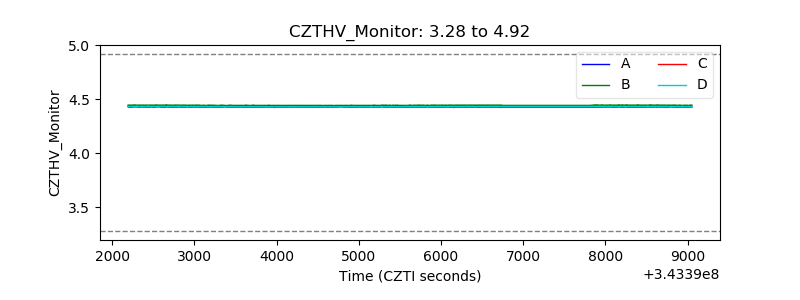 |
| D_VDD | 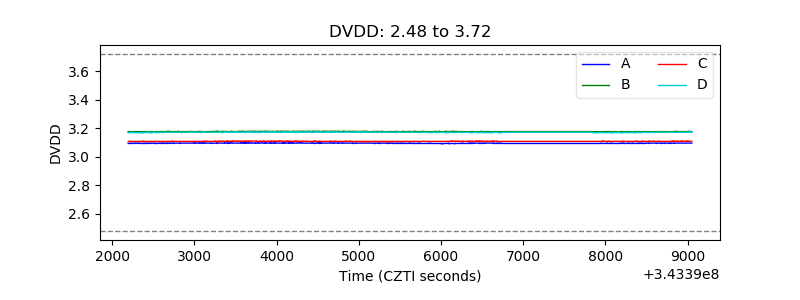 |
| Temperature 1 | 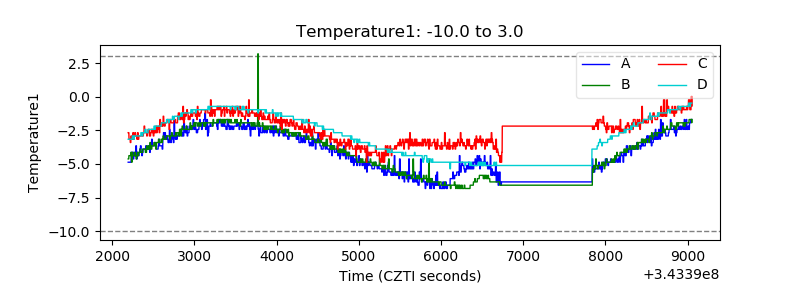 |
| Veto HV Monitor | 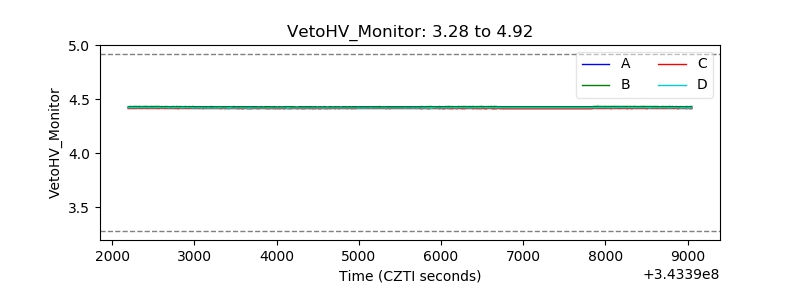 |
| Veto LLD | 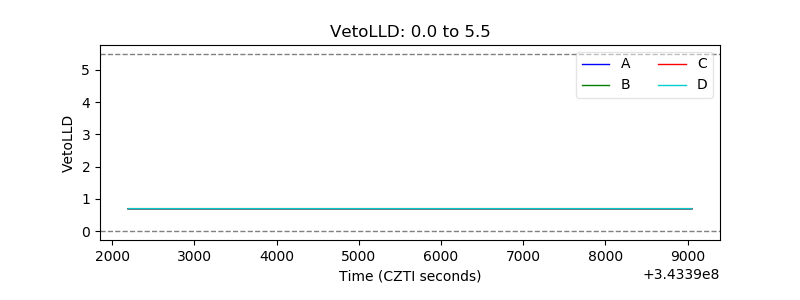 |
| Alpha Counter |  |
| _CPM_Rate |  |
| CZT Counter | 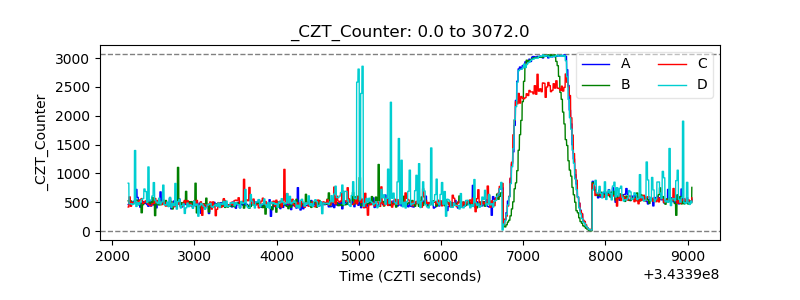 |
| +2.5 Volts monitor |  |
| +5 Volts monitor |  |
| _ROLL_ROT | 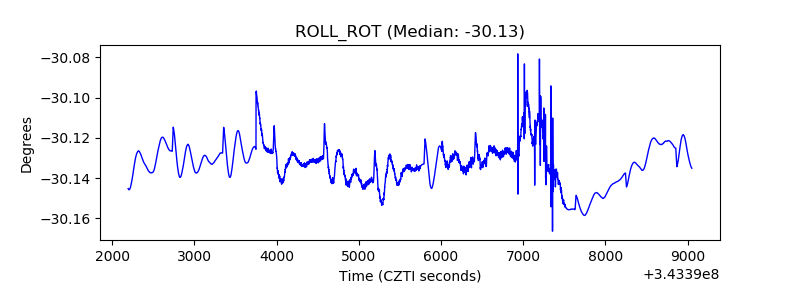 |
| _Roll_DEC | 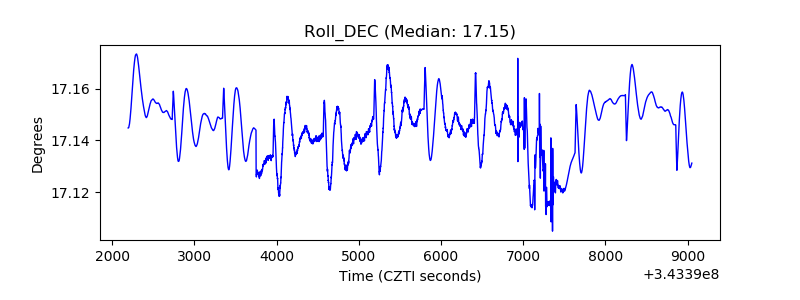 |
| _Roll_RA | 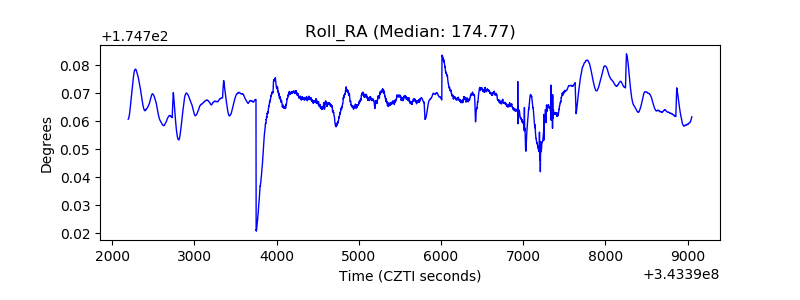 |
| Veto Counter | 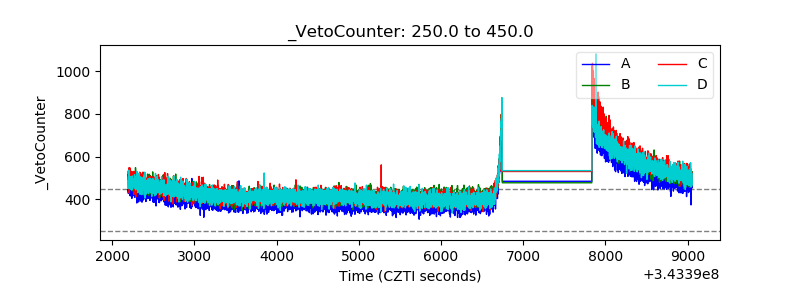 |