| Param | Original file | Final file |
|---|---|---|
| Filename | modeM0/AS1A10_016T01_9000004016_27805cztM0_level2.evt | modeM0/AS1A10_016T01_9000004016_27805cztM0_level2_quad_clean.evt |
| Size (bytes) | 980,786,880 | 149,863,680 |
| Size | 935.4 MB | 142.9 MB |
| Events in quadrant A | 6,466,685 | 919,888 |
| Events in quadrant B | 6,926,359 | 930,384 |
| Events in quadrant C | 6,675,823 | 897,997 |
| Events in quadrant D | 8,736,052 | 872,414 |
| Mode M9 | |||
|---|---|---|---|
| Quadrant | BADHDUFLAG | Total packets | Discarded packets |
| A | 0 | 20 | 0 |
| B | 0 | 20 | 0 |
| C | 0 | 20 | 0 |
| D | 0 | 20 | 0 |
| Mode M0 | |||
|---|---|---|---|
| Quadrant | BADHDUFLAG | Total packets | Discarded packets |
| A | 0 | 27255 | 0 |
| B | 0 | 28503 | 0 |
| C | 0 | 27575 | 0 |
| D | 0 | 34609 | 0 |
| Quadrant | Total seconds | Saturated seconds | Saturation percentage |
|---|---|---|---|
| A | 13285 | 72 | 0.541965% |
| B | 13286 | 103 | 0.775252% |
| C | 13286 | 123 | 0.925787% |
| D | 13286 | 454 | 3.417131% |
Noise dominated data is calculated using 1-second bins in cleaned event files. If a bin has >2000 counts, and if more than 50% of those come from <1% of pixels, then it is considered to be noise-dominated and hence unusable.
| Quadrant | # 1 sec bins | Bins with >0 counts | Bins with >2000 counts | High rate bins dominated by noise | Noise dominated (total time) | Noise dominated (detector-on time) | Marked lightcurve |
|---|---|---|---|---|---|---|---|
| A | 15320 | 13285 | 1 | 1 | 0.01% | 0.01% | 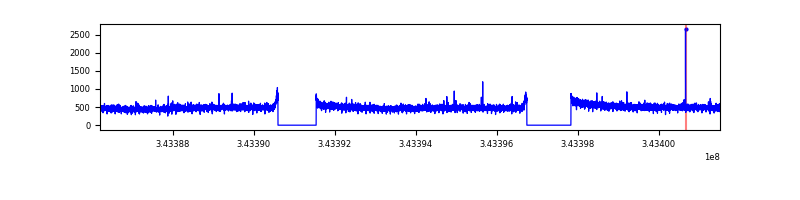 |
| B | 15321 | 13286 | 11 | 11 | 0.07% | 0.08% | 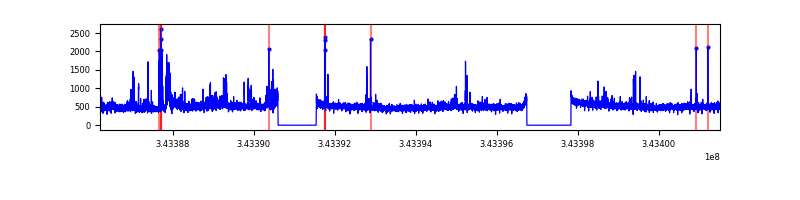 |
| C | 15321 | 13286 | 3 | 3 | 0.02% | 0.02% | 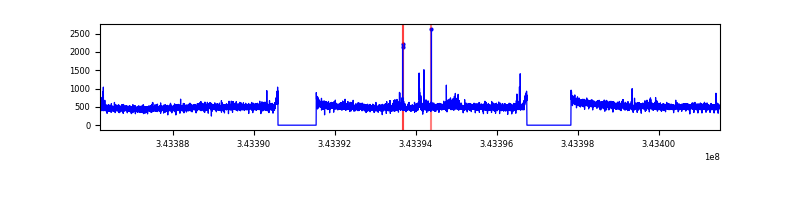 |
| D | 15321 | 13286 | 371 | 371 | 2.42% | 2.79% | 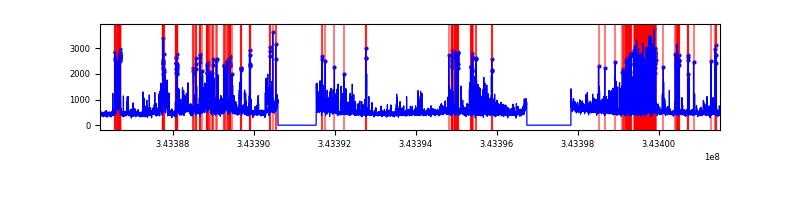 |
Top three noisy pixels from each quadrant. If the there are fewer than three noisy pixels in the level2.evt file, extra rows are filled as -1
| Pixel properties | Quadrant properties | ||||||
|---|---|---|---|---|---|---|---|
| Quadrant | DetID | PixID | Counts | Sigma | Mean | Median | Sigma |
| A | 13 | 254 | 22408 | 62.38 | 1675 | 1641 | 332.9 |
| A | 3 | 137 | 15416 | 41.38 | 1675 | 1641 | 332.9 |
| A | 0 | 226 | 14415 | 38.37 | 1675 | 1641 | 332.9 |
| B | 3 | 64 | 185768 | 592.28 | 1651 | 1608 | 310.9 |
| B | 10 | 245 | 117920 | 374.07 | 1651 | 1608 | 310.9 |
| B | 10 | 246 | 51204 | 159.5 | 1651 | 1608 | 310.9 |
| C | 14 | 238 | 260175 | 687.29 | 1608 | 1617 | 376.2 |
| C | 3 | 233 | 122322 | 320.85 | 1608 | 1617 | 376.2 |
| C | 2 | 16 | 15308 | 36.39 | 1608 | 1617 | 376.2 |
| D | 1 | 52 | 1642345 | 4277.12 | 1609 | 1567 | 383.6 |
| D | 11 | 248 | 677442 | 1761.85 | 1609 | 1567 | 383.6 |
| D | 2 | 250 | 232199 | 601.2 | 1609 | 1567 | 383.6 |
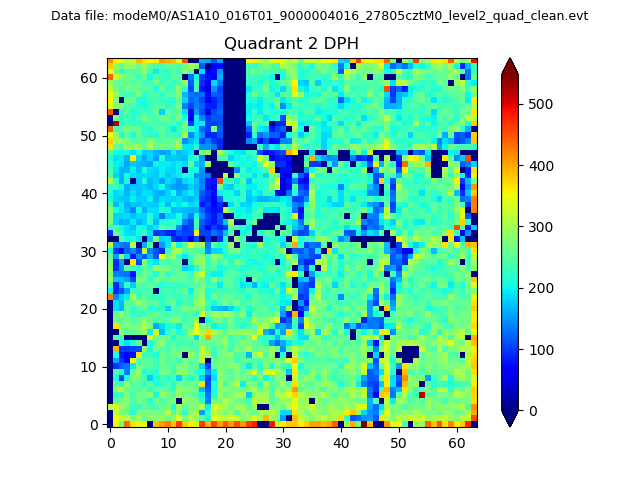
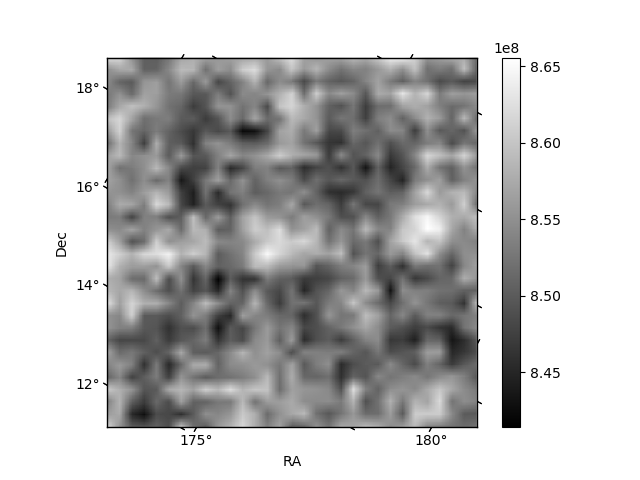
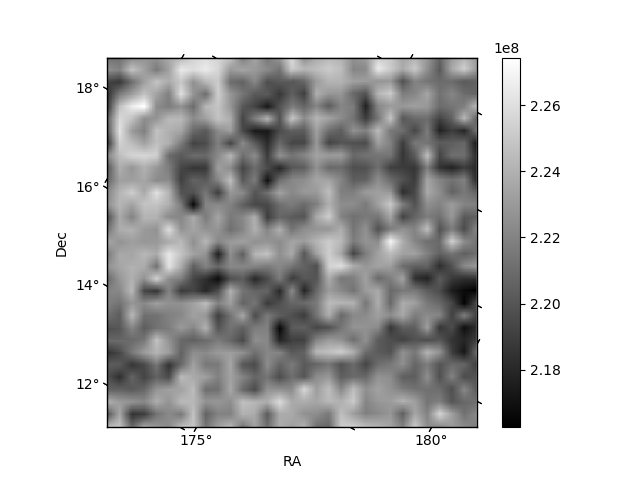
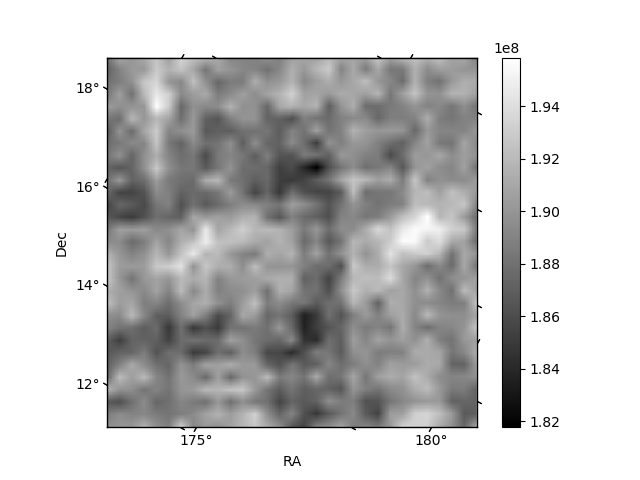
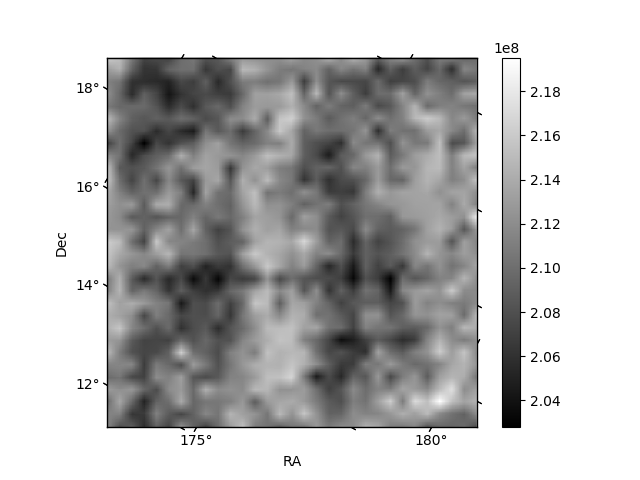
Histogram calculated using DETX and DETY for each event in the final _common_clean file
| Quadrant A | 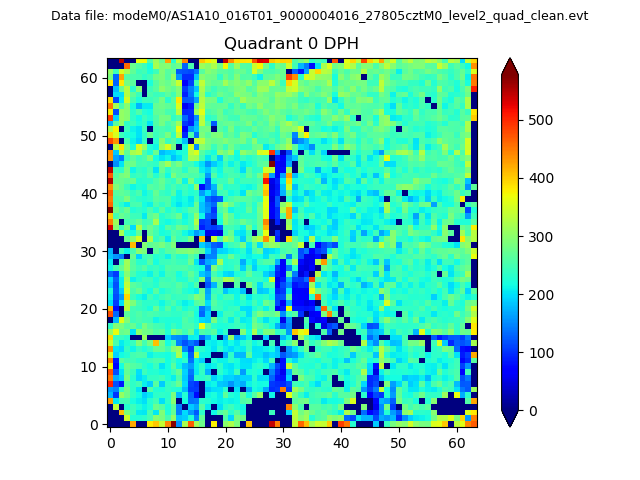 |
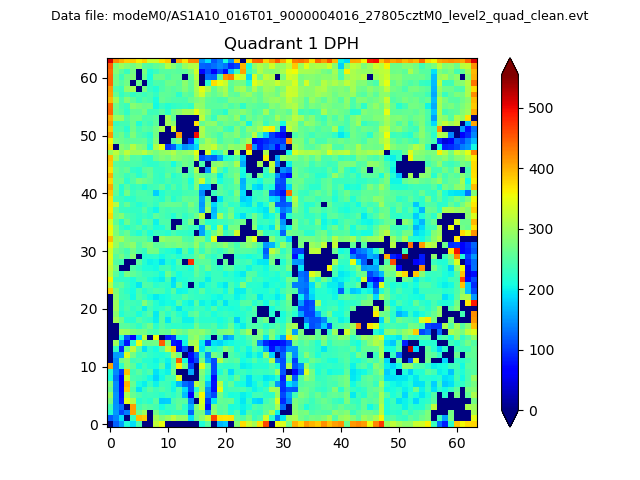 |
Quadrant B |
|---|---|---|---|
| Quadrant D | 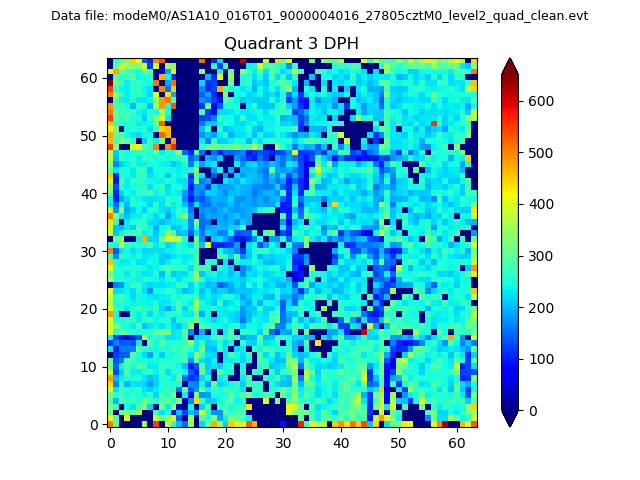 |
 |
Quadrant C |
| Plot type | Count rate plots | Images |
|---|---|---|
| Comparison with Poisson distribution Blue bars denote a histogram of data divided into 1 sec bins. Red curve is a Poisson curve with rate = median count rate of data. |
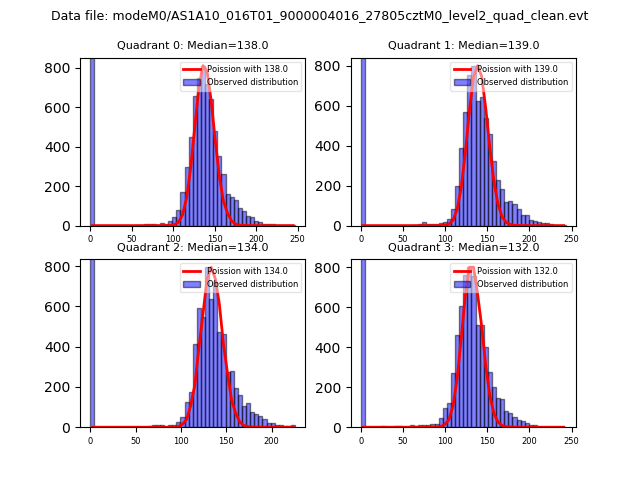 |
 |
| Quadrant-wise count rates Data is divided into 100 sec bins |
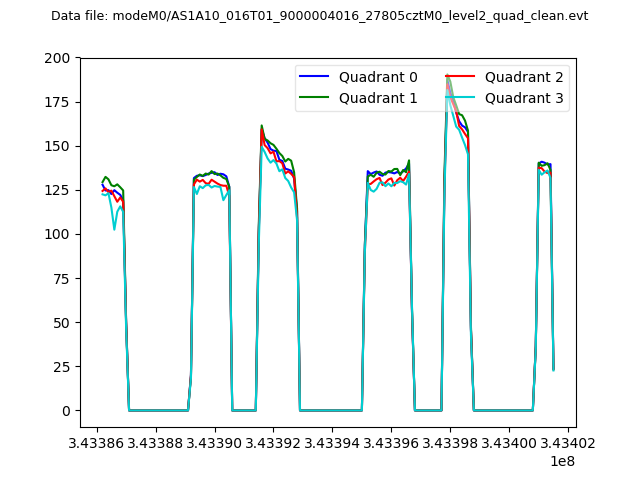 |
|
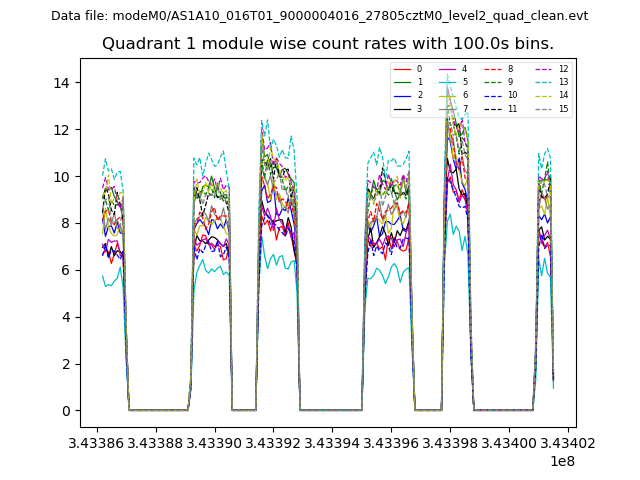
| Module-wise count rates for Quadrant A Data is divided into 100 sec bins |
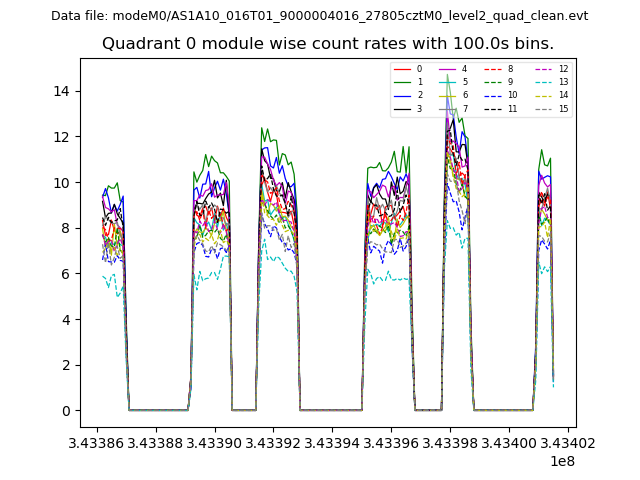 |
 |
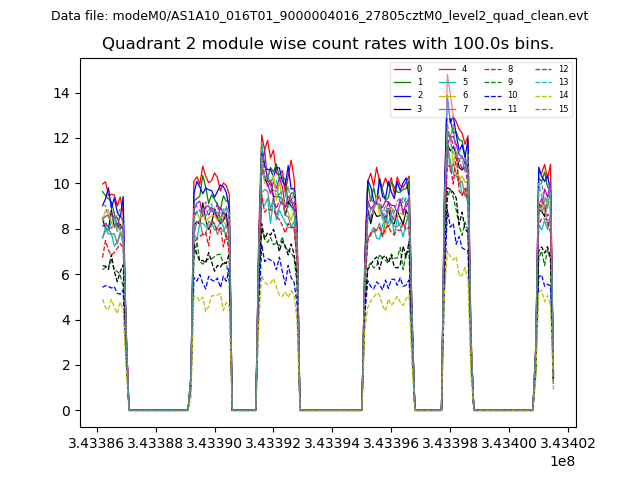
| Module-wise count rates for Quadrant B Data is divided into 100 sec bins |
 |
 |
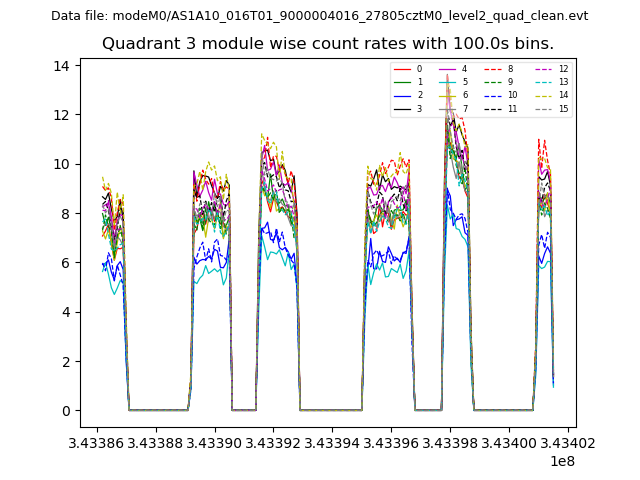
| Module-wise count rates for Quadrant C Data is divided into 100 sec bins |
 |
 |
| Module-wise count rates for Quadrant D Data is divided into 100 sec bins |
 |
 |
| Parameter | Plot |
|---|---|
| CZT HV Monitor | 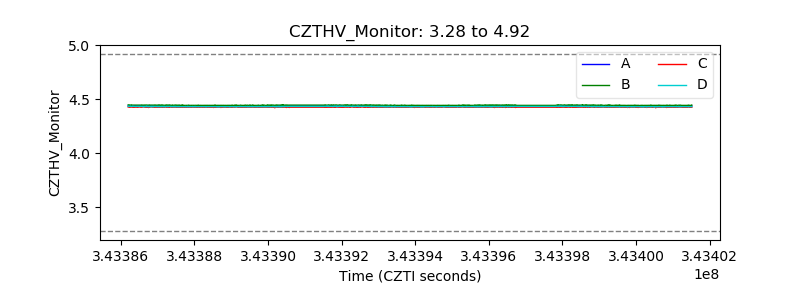 |
| D_VDD | 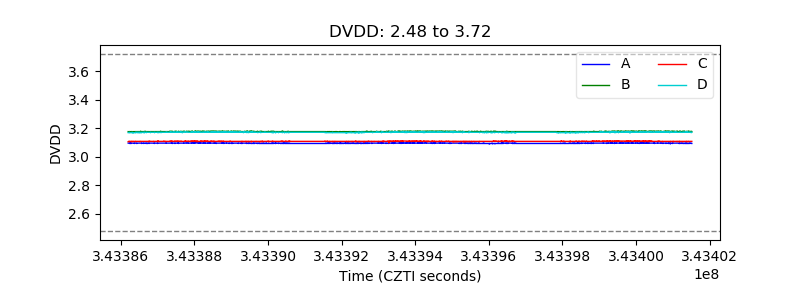 |
| Temperature 1 | 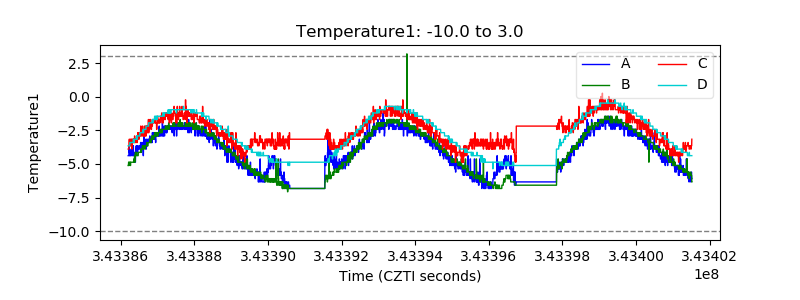 |
| Veto HV Monitor | 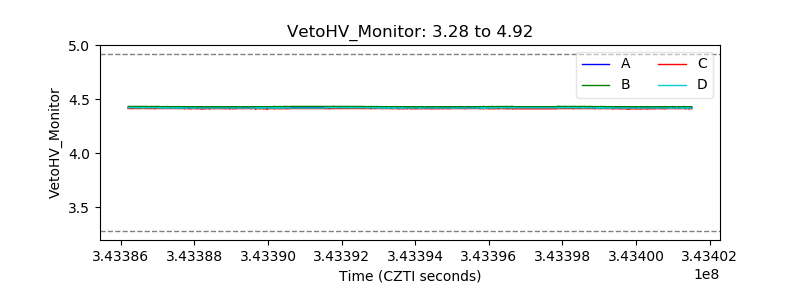 |
| Veto LLD | 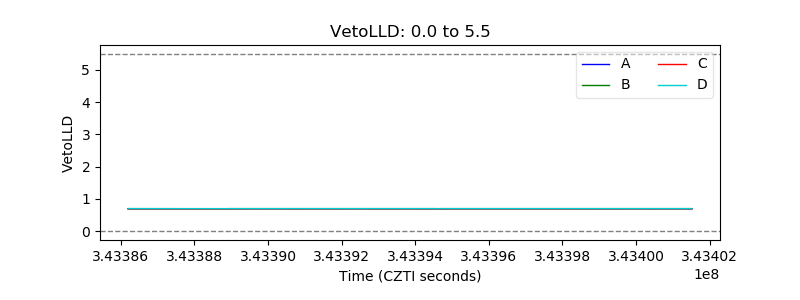 |
| Alpha Counter | 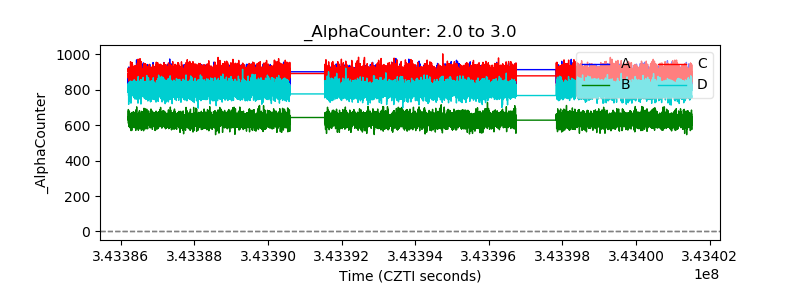 |
| _CPM_Rate | 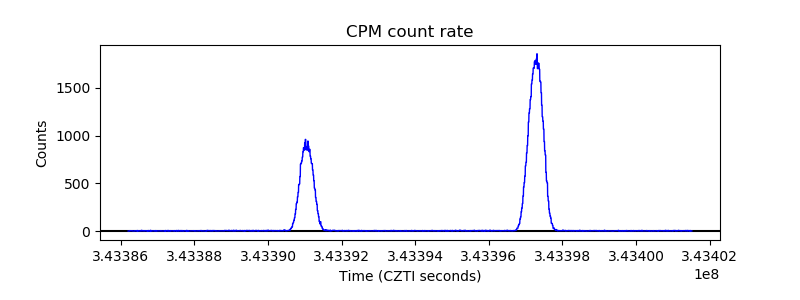 |
| CZT Counter | 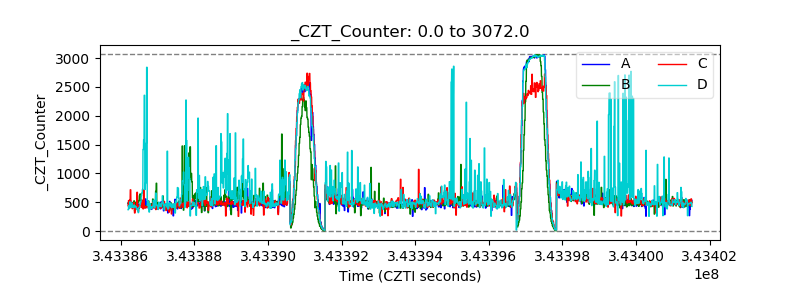 |
| +2.5 Volts monitor | 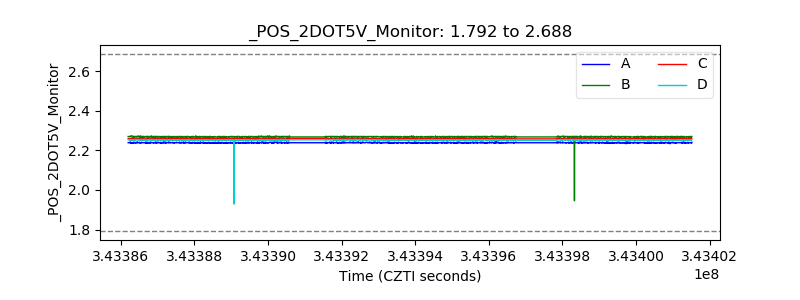 |
| +5 Volts monitor | 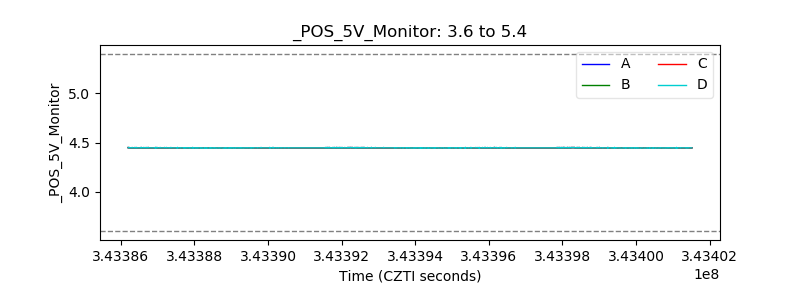 |
| _ROLL_ROT | 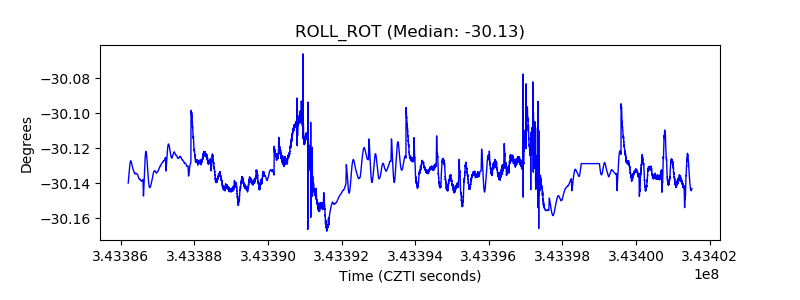 |
| _Roll_DEC | 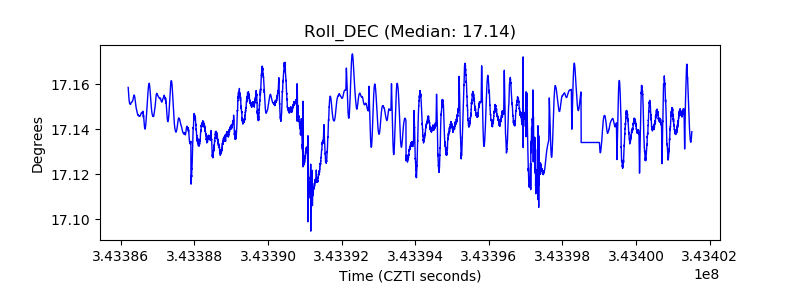 |
| _Roll_RA | 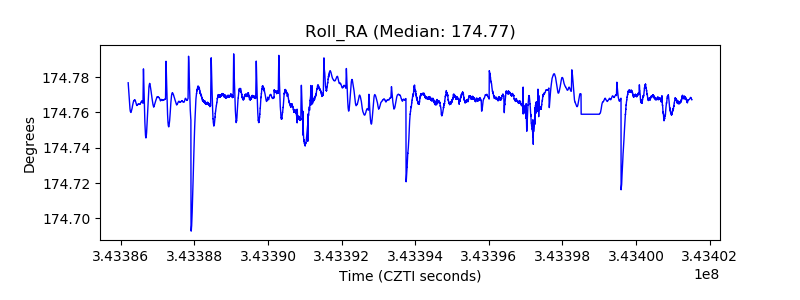 |
| Veto Counter | 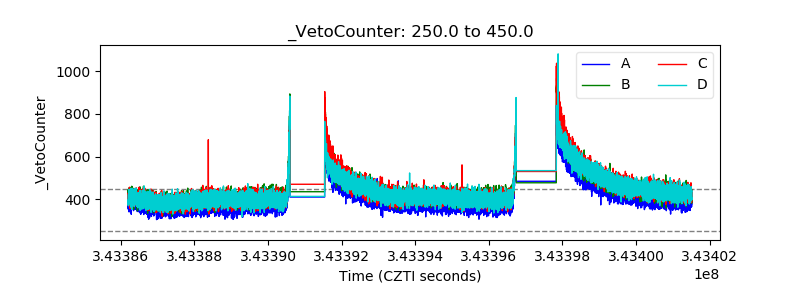 |