| Param | Original file | Final file |
|---|---|---|
| Filename | modeM0/AS1A10_024T01_9000004010cztM0_level2.fits | modeM0/AS1A10_024T01_9000004010cztM0_level2_quad_clean.evt |
| Size (bytes) | 195,341,760 | 239,218,560 |
| Size | 186.3 MB | 228.1 MB |
| Events in quadrant A | 1,189,326 | 1,526,380 |
| Events in quadrant B | 1,123,518 | 1,503,286 |
| Events in quadrant C | 1,143,222 | 1,449,518 |
| Events in quadrant D | 1,013,512 | 1,319,881 |
| Mode SS | |||
|---|---|---|---|
| Quadrant | BADHDUFLAG | Total packets | Discarded packets |
| A | 0 | 426 | 0 |
| B | 0 | 426 | 0 |
| C | 0 | 426 | 0 |
| D | 0 | 426 | 0 |
| Mode M0 | |||
|---|---|---|---|
| Quadrant | BADHDUFLAG | Total packets | Discarded packets |
| A | 0 | 42800 | 0 |
| B | 0 | 50269 | 0 |
| C | 0 | 47764 | 0 |
| D | 0 | 50998 | 0 |
| Mode M9 | |||
|---|---|---|---|
| Quadrant | BADHDUFLAG | Total packets | Discarded packets |
| A | 0 | 20 | 0 |
| B | 0 | 20 | 0 |
| C | 0 | 20 | 0 |
| D | 0 | 20 | 0 |
| Quadrant | Total seconds | Saturated seconds | Saturation percentage |
|---|---|---|---|
| A | 21002 | 227 | 1.080849% |
| B | 20993 | 740 | 3.524985% |
| C | 21006 | 580 | 2.761116% |
| D | 20992 | 690 | 3.286966% |
Noise dominated data is calculated using 1-second bins in cleaned event files. If a bin has >2000 counts, and if more than 50% of those come from <1% of pixels, then it is considered to be noise-dominated and hence unusable.
| Quadrant | # 1 sec bins | Bins with >0 counts | Bins with >2000 counts | High rate bins dominated by noise | Noise dominated (total time) | Noise dominated (detector-on time) | Marked lightcurve |
|---|---|---|---|---|---|---|---|
| A | 22825 | 21019 | 0 | 0 | 0.00% | 0.00% |  |
| B | 22824 | 21013 | 0 | 0 | 0.00% | 0.00% |  |
| C | 22825 | 21021 | 0 | 0 | 0.00% | 0.00% | 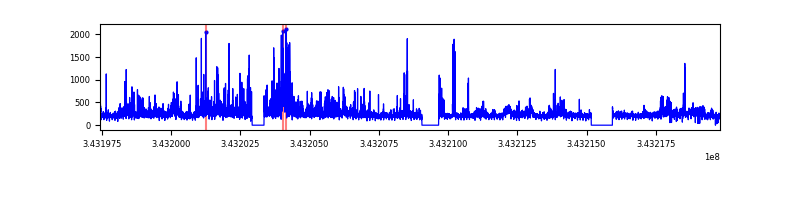 |
| D | 22825 | 21013 | 0 | 0 | 0.00% | 0.00% | 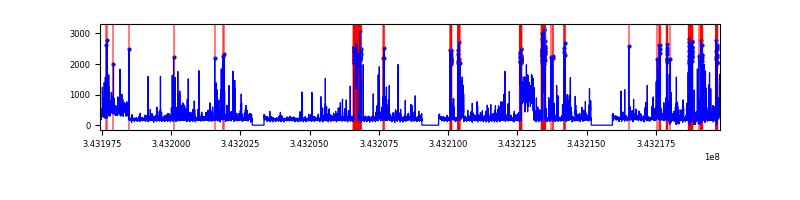 |
Top three noisy pixels from each quadrant. If the there are fewer than three noisy pixels in the level2.evt file, extra rows are filled as -1
| Pixel properties | Quadrant properties | ||||||
|---|---|---|---|---|---|---|---|
| Quadrant | DetID | PixID | Counts | Sigma | Mean | Median | Sigma |
| A | 0 | 29 | 1188 | 11.35 | 309 | 289 | 79.2 |
| A | 7 | 110 | 985 | 8.79 | 309 | 289 | 79.2 |
| A | 0 | 30 | 921 | 7.98 | 309 | 289 | 79.2 |
| B | 2 | 9 | 930 | 10.82 | 296 | 283 | 59.8 |
| B | 2 | 8 | 764 | 8.05 | 296 | 283 | 59.8 |
| B | 5 | 128 | 758 | 7.95 | 296 | 283 | 59.8 |
| C | 1 | 81 | 874 | 7.62 | 301 | 280 | 77.9 |
| C | 3 | 202 | 874 | 7.62 | 301 | 280 | 77.9 |
| C | 1 | 80 | 868 | 7.55 | 301 | 280 | 77.9 |
| D | 4 | 246 | 793 | 6.68 | 288 | 260 | 79.7 |
| D | 15 | 46 | 749 | 6.13 | 288 | 260 | 79.7 |
| D | 6 | 67 | 726 | 5.84 | 288 | 260 | 79.7 |
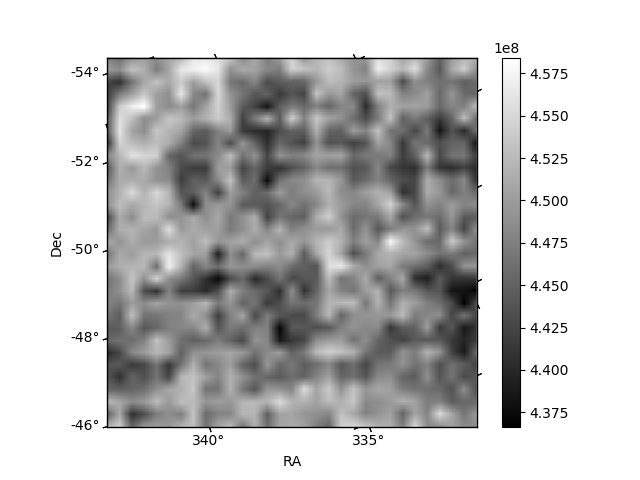
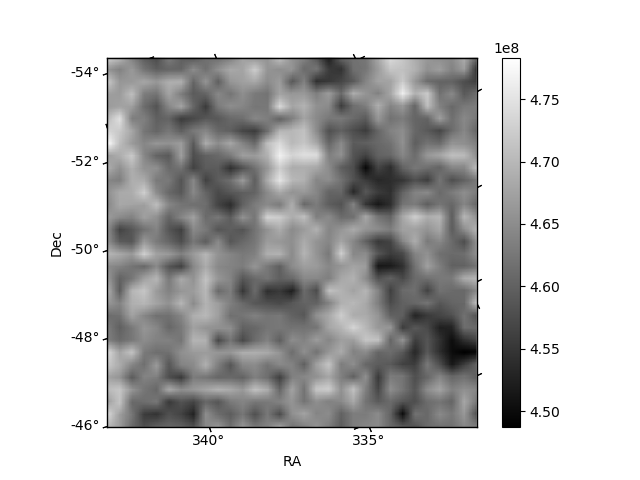
Histogram calculated using DETX and DETY for each event in the final _common_clean file
| Quadrant A |  |
 |
Quadrant B |
|---|---|---|---|
| Quadrant D | 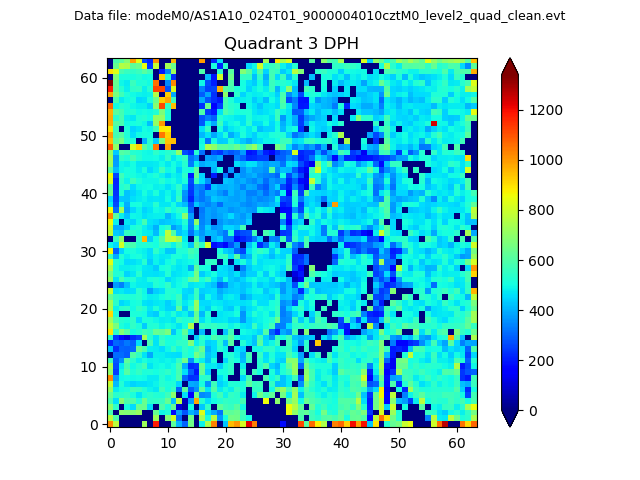 |
 |
Quadrant C |
| Plot type | Count rate plots | Images |
|---|---|---|
| Comparison with Poisson distribution Blue bars denote a histogram of data divided into 1 sec bins. Red curve is a Poisson curve with rate = median count rate of data. |
 |
 |
| Quadrant-wise count rates Data is divided into 100 sec bins |
 |
|
| Module-wise count rates for Quadrant A Data is divided into 100 sec bins |
 |
 |
| Module-wise count rates for Quadrant B Data is divided into 100 sec bins |
 |
 |
| Module-wise count rates for Quadrant C Data is divided into 100 sec bins |
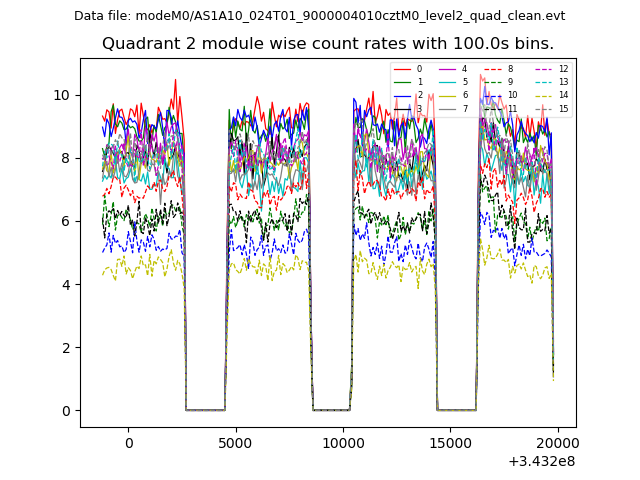 |
 |
| Module-wise count rates for Quadrant D Data is divided into 100 sec bins |
 |
 |
| Parameter | Plot |
|---|---|
| CZT HV Monitor | 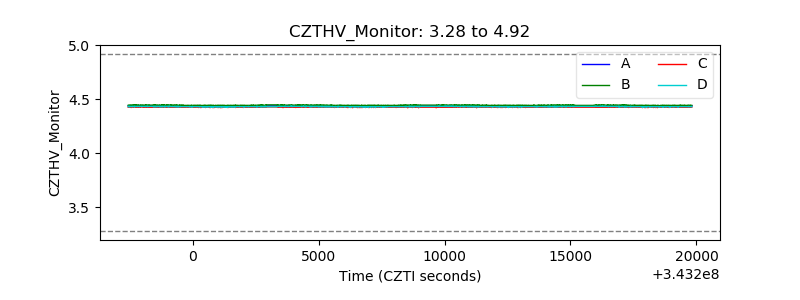 |
| D_VDD |  |
| Temperature 1 |  |
| Veto HV Monitor | 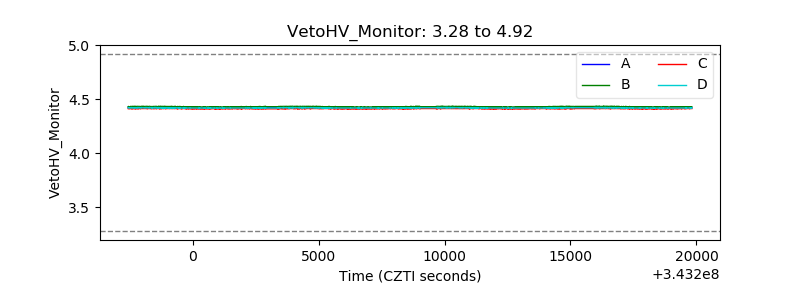 |
| Veto LLD |  |
| Alpha Counter |  |
| _CPM_Rate |  |
| CZT Counter |  |
| +2.5 Volts monitor | 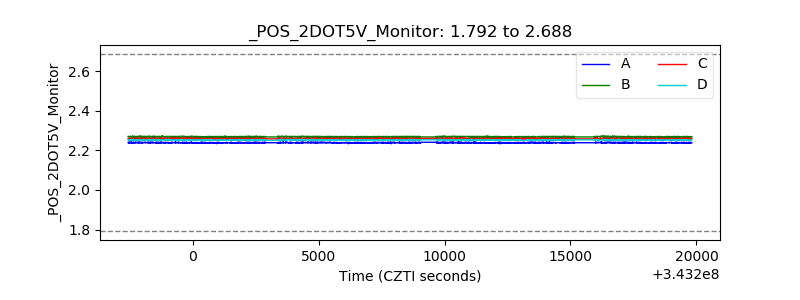 |
| +5 Volts monitor | 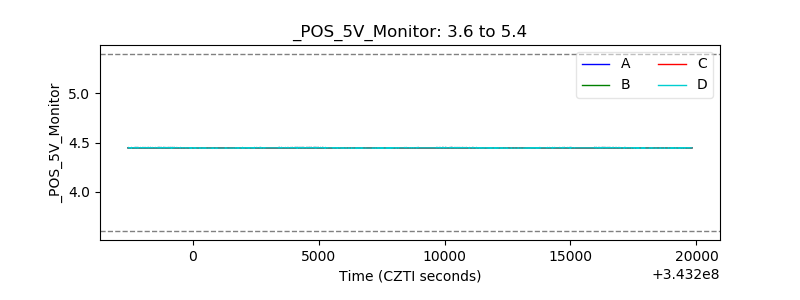 |
| _ROLL_ROT |  |
| _Roll_DEC |  |
| _Roll_RA |  |
| Veto Counter | 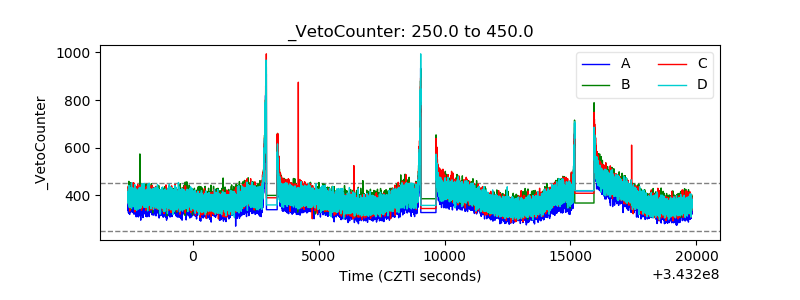 |