| Param | Original file | Final file |
|---|---|---|
| Filename | modeM0/AS1A10_024T01_9000004010_27771cztM0_level2.evt | modeM0/AS1A10_024T01_9000004010_27771cztM0_level2_quad_clean.evt |
| Size (bytes) | 1,348,093,440 | 249,600,960 |
| Size | 1.3 GB | 238.0 MB |
| Events in quadrant A | 8,494,801 | 1,607,358 |
| Events in quadrant B | 10,497,114 | 1,615,731 |
| Events in quadrant C | 10,141,582 | 1,557,226 |
| Events in quadrant D | 10,456,134 | 1,517,630 |
| Mode M0 | |||
|---|---|---|---|
| Quadrant | BADHDUFLAG | Total packets | Discarded packets |
| A | 0 | 37273 | 0 |
| B | 0 | 42849 | 0 |
| C | 0 | 41293 | 0 |
| D | 0 | 43747 | 0 |
| Mode M9 | |||
|---|---|---|---|
| Quadrant | BADHDUFLAG | Total packets | Discarded packets |
| A | 0 | 18 | 0 |
| B | 0 | 18 | 0 |
| C | 0 | 18 | 0 |
| D | 0 | 18 | 0 |
| Quadrant | Total seconds | Saturated seconds | Saturation percentage |
|---|---|---|---|
| A | 18315 | 197 | 1.075621% |
| B | 18315 | 570 | 3.112203% |
| C | 18314 | 433 | 2.364311% |
| D | 18315 | 560 | 3.057603% |
Noise dominated data is calculated using 1-second bins in cleaned event files. If a bin has >2000 counts, and if more than 50% of those come from <1% of pixels, then it is considered to be noise-dominated and hence unusable.
| Quadrant | # 1 sec bins | Bins with >0 counts | Bins with >2000 counts | High rate bins dominated by noise | Noise dominated (total time) | Noise dominated (detector-on time) | Marked lightcurve |
|---|---|---|---|---|---|---|---|
| A | 20115 | 18315 | 2 | 2 | 0.01% | 0.01% | 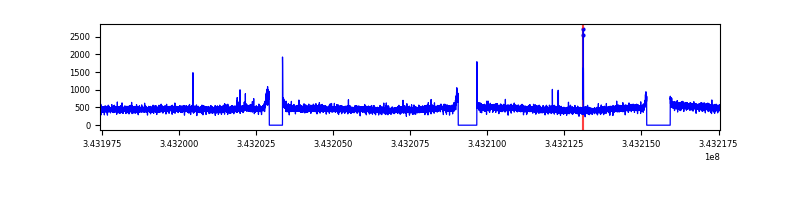 |
| B | 20115 | 18315 | 225 | 225 | 1.12% | 1.23% | 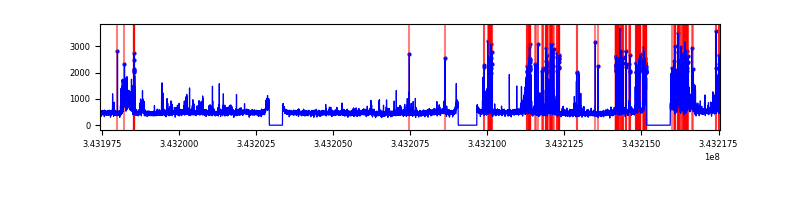 |
| C | 20114 | 18314 | 76 | 76 | 0.38% | 0.41% | 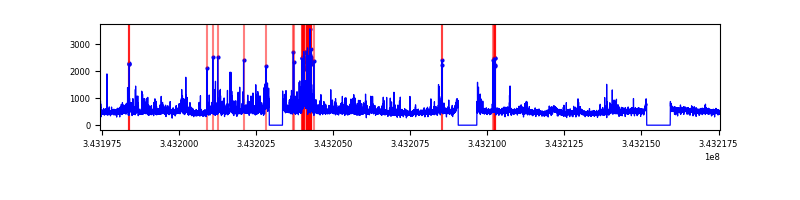 |
| D | 20115 | 18315 | 422 | 422 | 2.10% | 2.30% |  |
Top three noisy pixels from each quadrant. If the there are fewer than three noisy pixels in the level2.evt file, extra rows are filled as -1
| Pixel properties | Quadrant properties | ||||||
|---|---|---|---|---|---|---|---|
| Quadrant | DetID | PixID | Counts | Sigma | Mean | Median | Sigma |
| A | 13 | 254 | 31841 | 67.75 | 2193 | 2148 | 438.3 |
| A | 3 | 137 | 21046 | 43.12 | 2193 | 2148 | 438.3 |
| A | 0 | 226 | 18943 | 38.32 | 2193 | 2148 | 438.3 |
| B | 3 | 64 | 1519806 | 3716.32 | 2160 | 2107 | 408.4 |
| B | 0 | 190 | 126237 | 303.95 | 2160 | 2107 | 408.4 |
| B | 5 | 255 | 111401 | 267.62 | 2160 | 2107 | 408.4 |
| C | 3 | 233 | 1248001 | 2559.64 | 2088 | 2103 | 486.7 |
| C | 14 | 238 | 332130 | 678.02 | 2088 | 2103 | 486.7 |
| C | 6 | 112 | 227492 | 463.05 | 2088 | 2103 | 486.7 |
| D | 1 | 52 | 1986586 | 3909.74 | 2111 | 2049 | 507.6 |
| D | 2 | 250 | 349136 | 683.8 | 2111 | 2049 | 507.6 |
| D | 2 | 234 | 80153 | 153.87 | 2111 | 2049 | 507.6 |
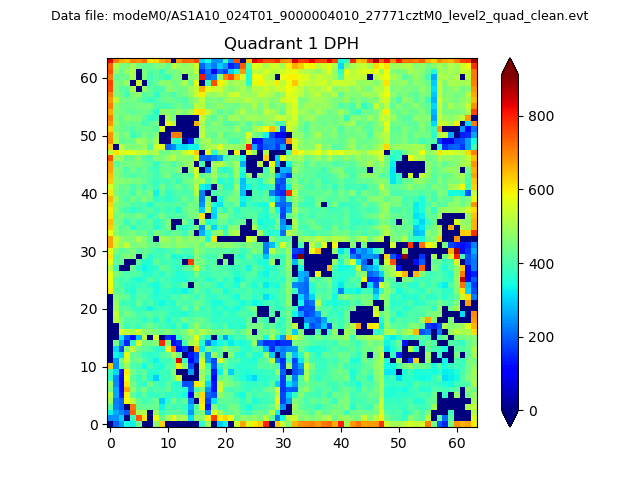
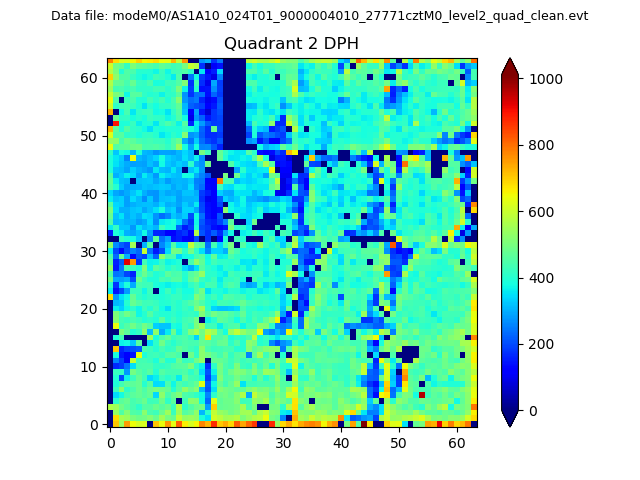
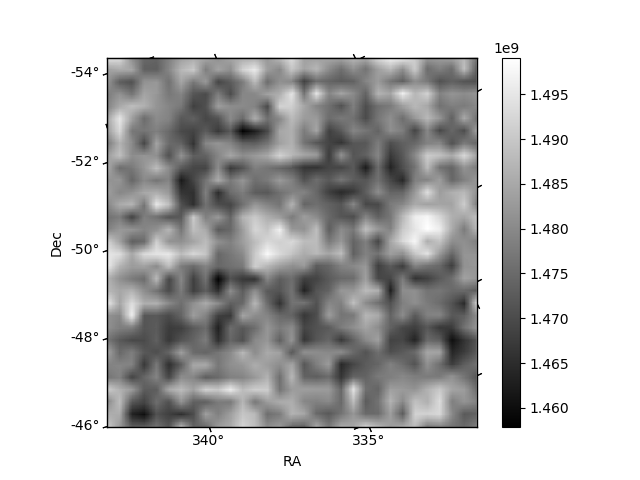
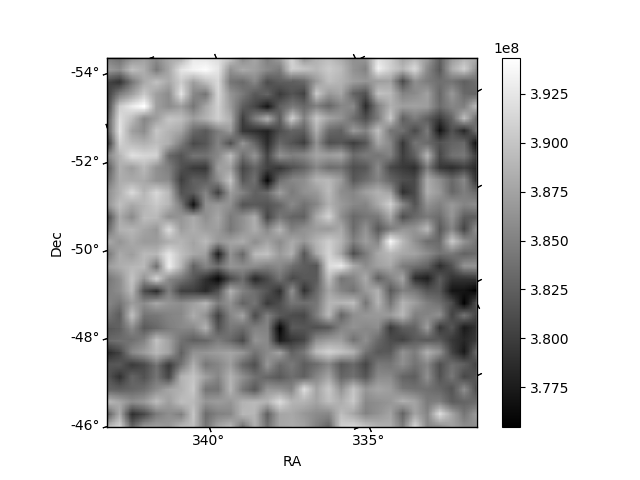
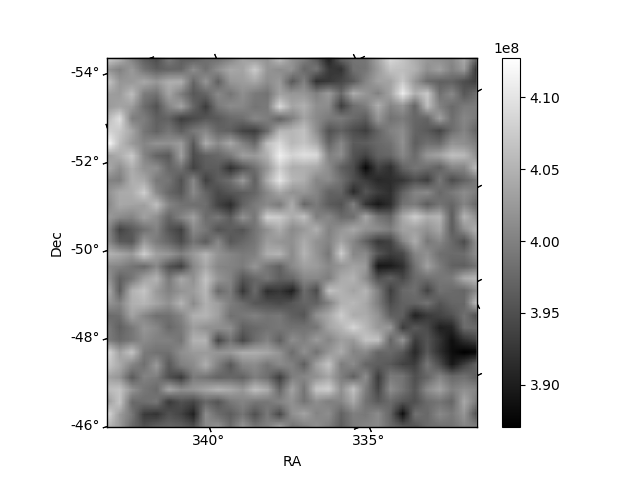
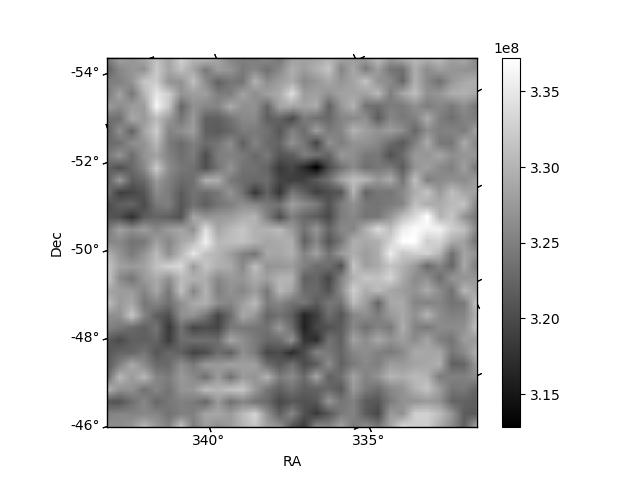
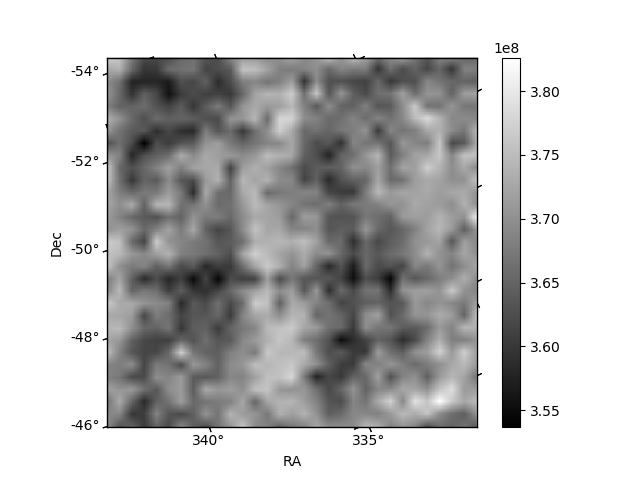
Histogram calculated using DETX and DETY for each event in the final _common_clean file
| Quadrant A | 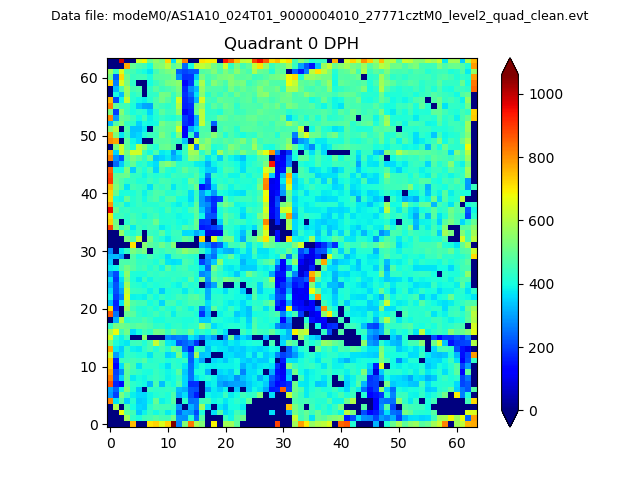 |
 |
Quadrant B |
|---|---|---|---|
| Quadrant D | 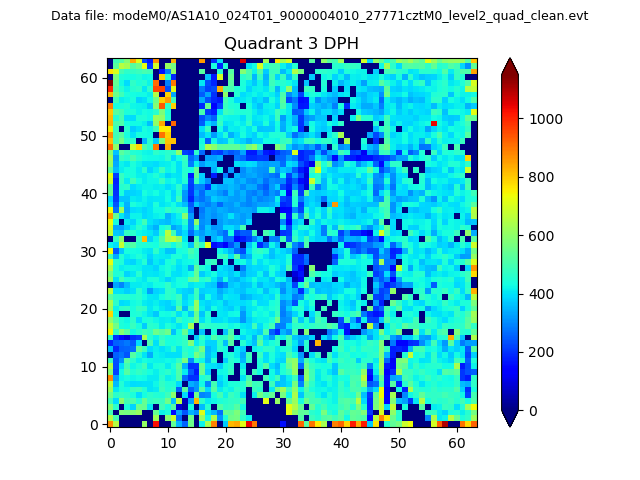 |
 |
Quadrant C |
| Plot type | Count rate plots | Images |
|---|---|---|
| Comparison with Poisson distribution Blue bars denote a histogram of data divided into 1 sec bins. Red curve is a Poisson curve with rate = median count rate of data. |
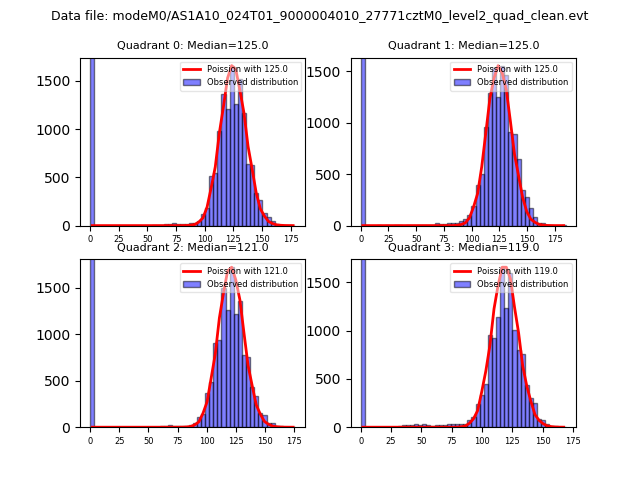 |
 |
| Quadrant-wise count rates Data is divided into 100 sec bins |
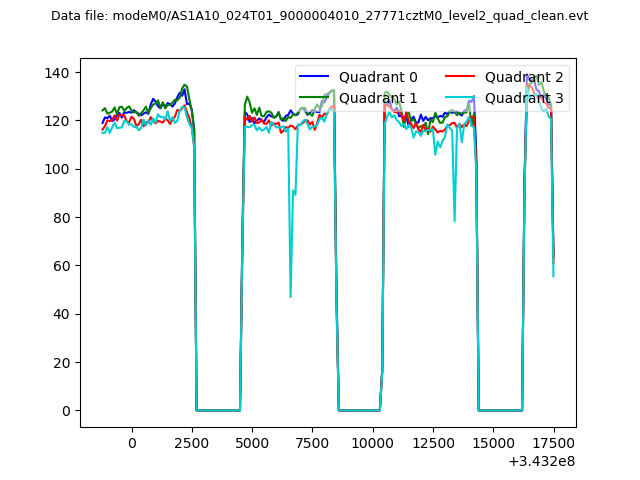 |
|
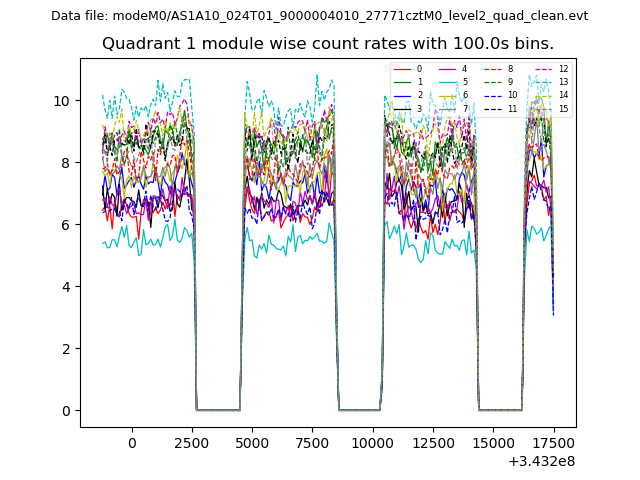
| Module-wise count rates for Quadrant A Data is divided into 100 sec bins |
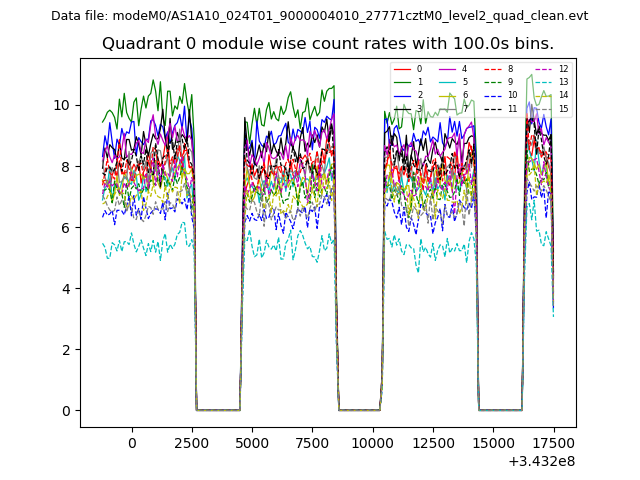 |
 |
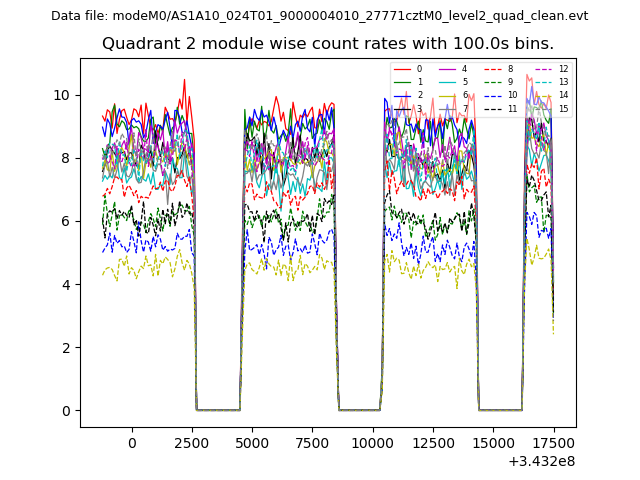
| Module-wise count rates for Quadrant B Data is divided into 100 sec bins |
 |
 |
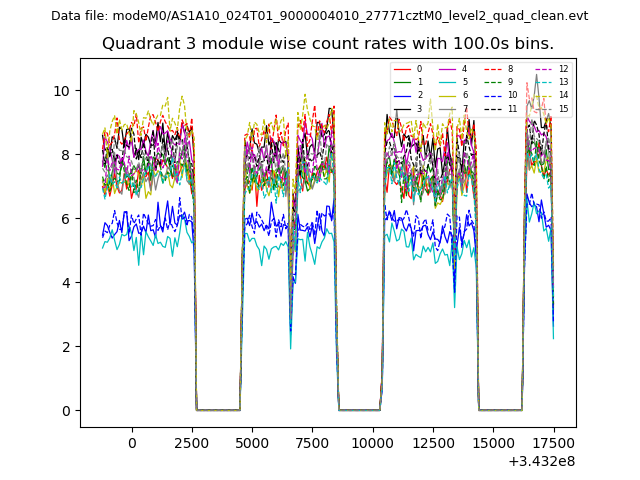
| Module-wise count rates for Quadrant C Data is divided into 100 sec bins |
 |
 |
| Module-wise count rates for Quadrant D Data is divided into 100 sec bins |
 |
 |
| Parameter | Plot |
|---|---|
| CZT HV Monitor | 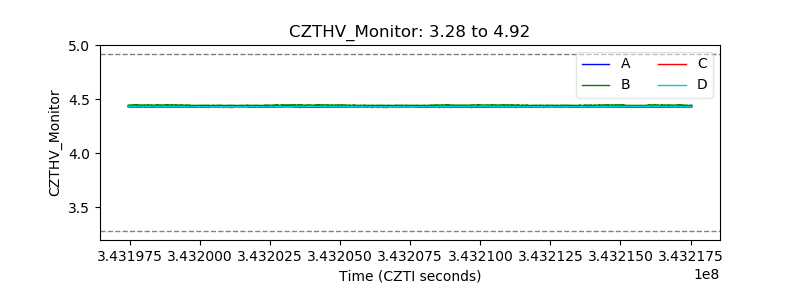 |
| D_VDD |  |
| Temperature 1 | 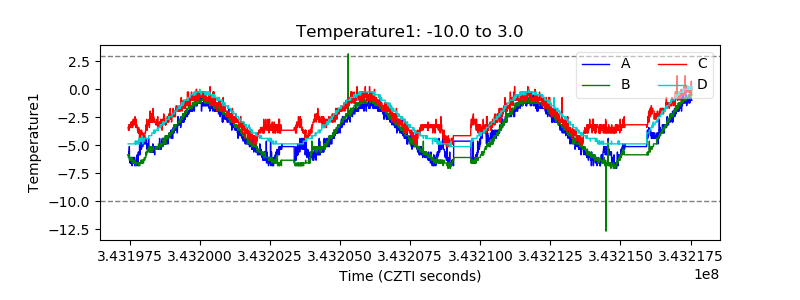 |
| Veto HV Monitor | 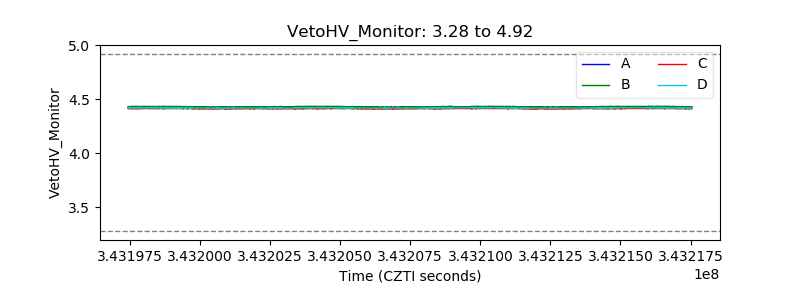 |
| Veto LLD | 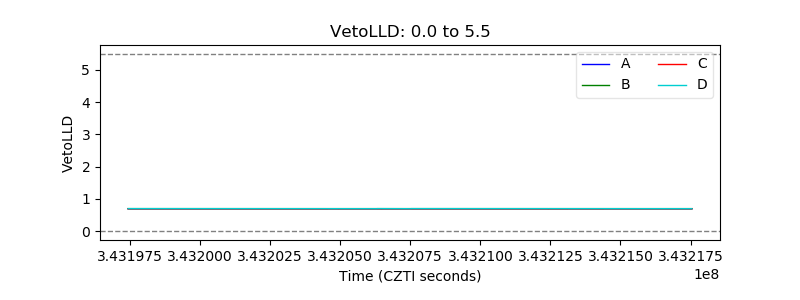 |
| Alpha Counter | 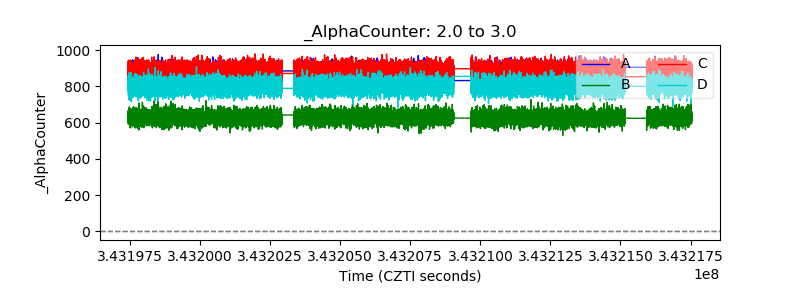 |
| _CPM_Rate | 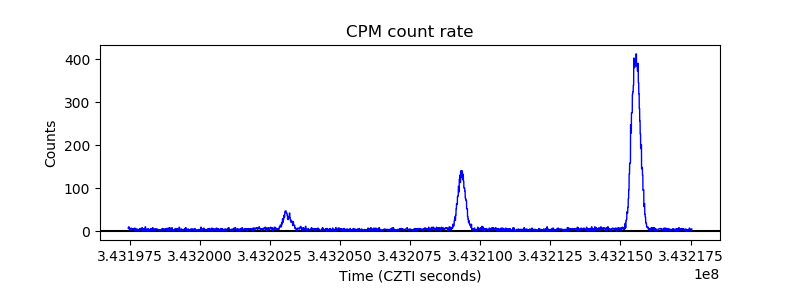 |
| CZT Counter | 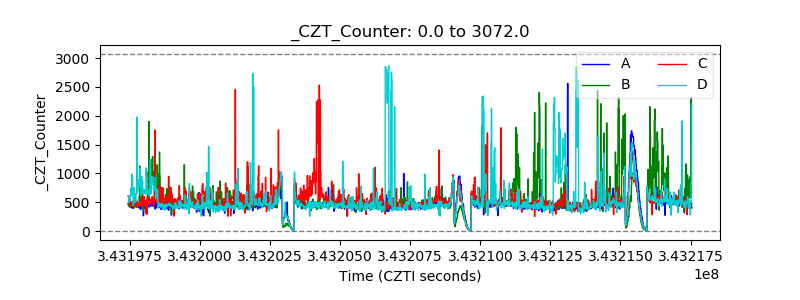 |
| +2.5 Volts monitor |  |
| +5 Volts monitor |  |
| _ROLL_ROT | 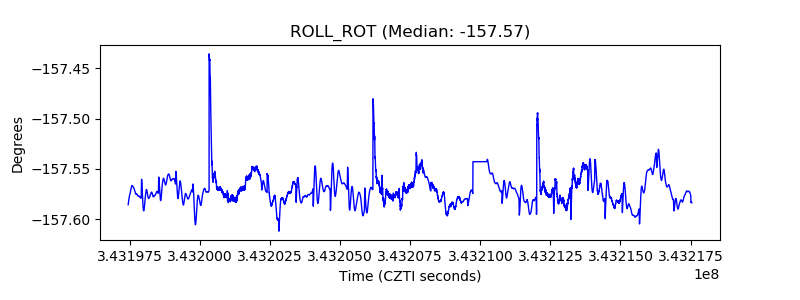 |
| _Roll_DEC | 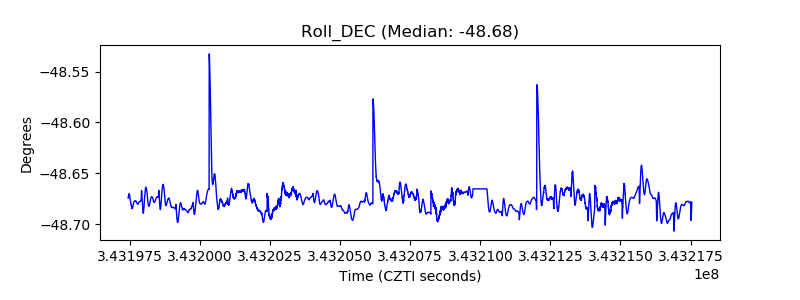 |
| _Roll_RA | 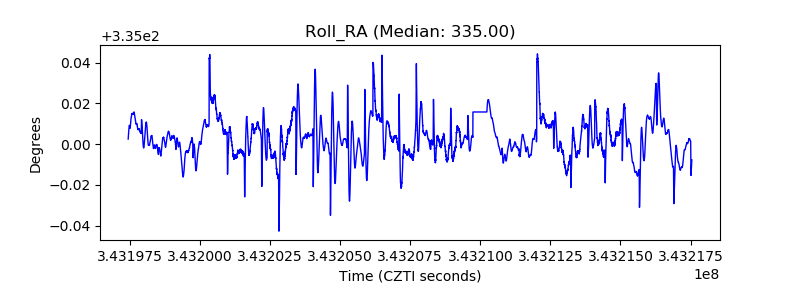 |
| Veto Counter | 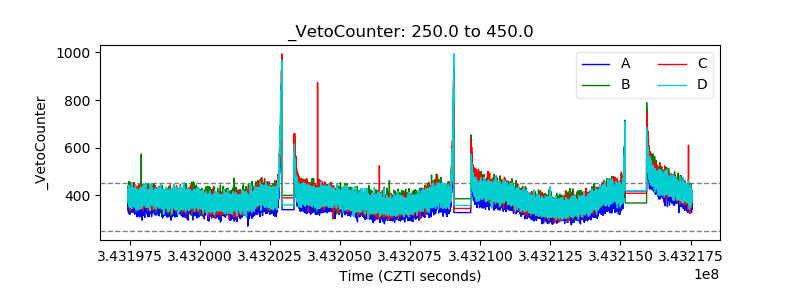 |