| Param | Original file | Final file |
|---|---|---|
| Filename | modeM0/AS1A10_024T01_9000004010_27772cztM0_level2.evt | modeM0/AS1A10_024T01_9000004010_27772cztM0_level2_quad_clean.evt |
| Size (bytes) | 234,682,560 | 56,574,720 |
| Size | 223.8 MB | 54.0 MB |
| Events in quadrant A | 1,357,792 | 384,989 |
| Events in quadrant B | 2,165,345 | 376,031 |
| Events in quadrant C | 1,556,770 | 370,751 |
| Events in quadrant D | 1,816,006 | 361,599 |
| Mode M0 | |||
|---|---|---|---|
| Quadrant | BADHDUFLAG | Total packets | Discarded packets |
| A | 0 | 6202 | 0 |
| B | 0 | 8419 | 0 |
| C | 0 | 6478 | 0 |
| D | 0 | 7601 | 0 |
| Quadrant | Total seconds | Saturated seconds | Saturation percentage |
|---|---|---|---|
| A | 3087 | 0 | 0.000000% |
| B | 3076 | 133 | 4.323797% |
| C | 3091 | 10 | 0.323520% |
| D | 3078 | 96 | 3.118908% |
Noise dominated data is calculated using 1-second bins in cleaned event files. If a bin has >2000 counts, and if more than 50% of those come from <1% of pixels, then it is considered to be noise-dominated and hence unusable.
| Quadrant | # 1 sec bins | Bins with >0 counts | Bins with >2000 counts | High rate bins dominated by noise | Noise dominated (total time) | Noise dominated (detector-on time) | Marked lightcurve |
|---|---|---|---|---|---|---|---|
| A | 3113 | 3110 | 0 | 0 | 0.00% | 0.00% | 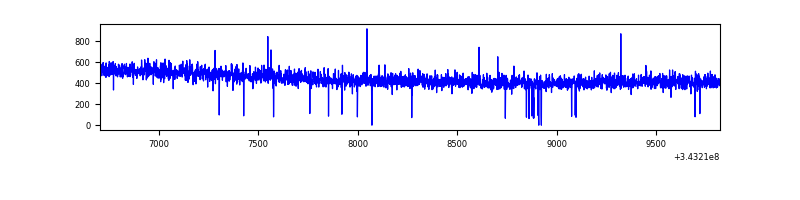 |
| B | 3112 | 3106 | 109 | 109 | 3.50% | 3.51% | 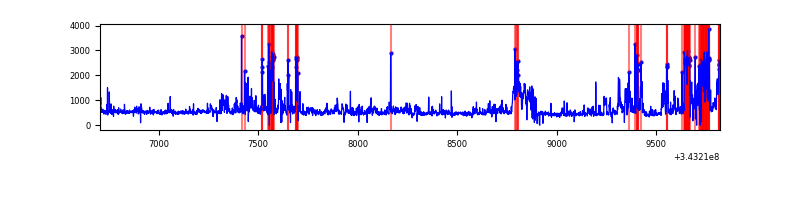 |
| C | 3113 | 3112 | 0 | 0 | 0.00% | 0.00% | 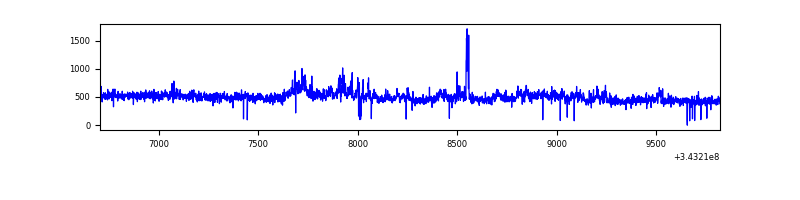 |
| D | 3114 | 3109 | 118 | 118 | 3.79% | 3.80% | 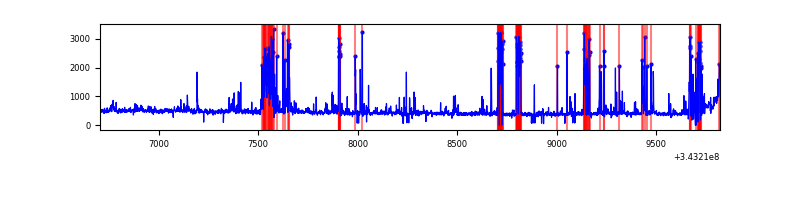 |
Top three noisy pixels from each quadrant. If the there are fewer than three noisy pixels in the level2.evt file, extra rows are filled as -1
| Pixel properties | Quadrant properties | ||||||
|---|---|---|---|---|---|---|---|
| Quadrant | DetID | PixID | Counts | Sigma | Mean | Median | Sigma |
| A | 13 | 254 | 5538 | 71.19 | 351 | 344 | 73.0 |
| A | 3 | 137 | 3186 | 38.96 | 351 | 344 | 73.0 |
| A | 0 | 226 | 2990 | 36.27 | 351 | 344 | 73.0 |
| B | 3 | 64 | 717443 | 10700.17 | 340 | 332 | 67.0 |
| B | 0 | 190 | 42079 | 622.92 | 340 | 332 | 67.0 |
| B | 0 | 230 | 20945 | 307.57 | 340 | 332 | 67.0 |
| C | 3 | 233 | 226305 | 2895.95 | 327 | 329 | 78.0 |
| C | 14 | 238 | 52208 | 664.84 | 327 | 329 | 78.0 |
| C | 13 | 61 | 2307 | 25.35 | 327 | 329 | 78.0 |
| D | 1 | 52 | 324665 | 3973.66 | 331 | 320 | 81.6 |
| D | 2 | 250 | 161442 | 1973.96 | 331 | 320 | 81.6 |
| D | 7 | 69 | 21442 | 258.77 | 331 | 320 | 81.6 |
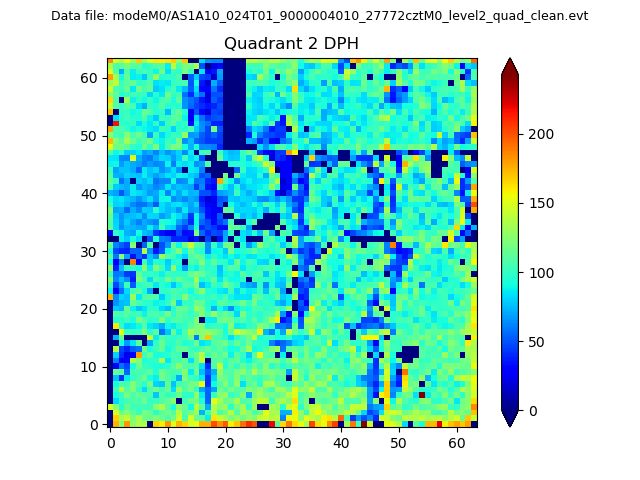
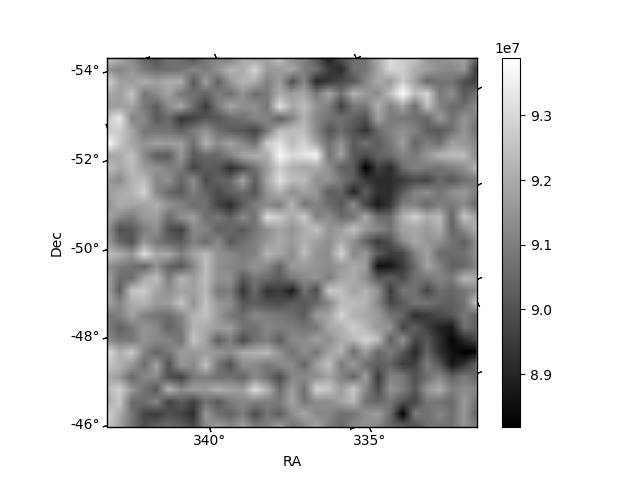
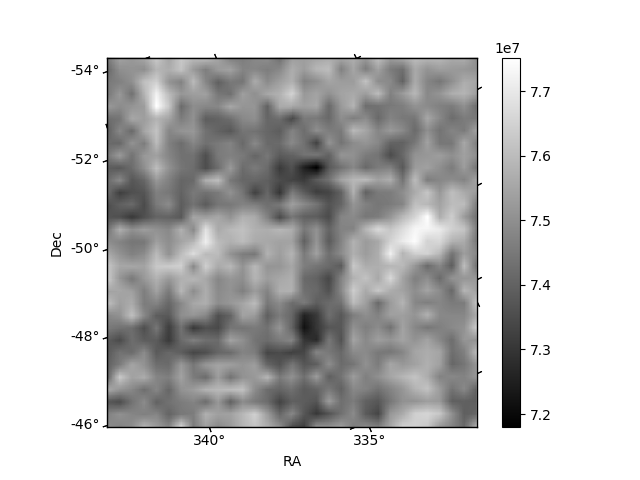
Histogram calculated using DETX and DETY for each event in the final _common_clean file
| Quadrant A | 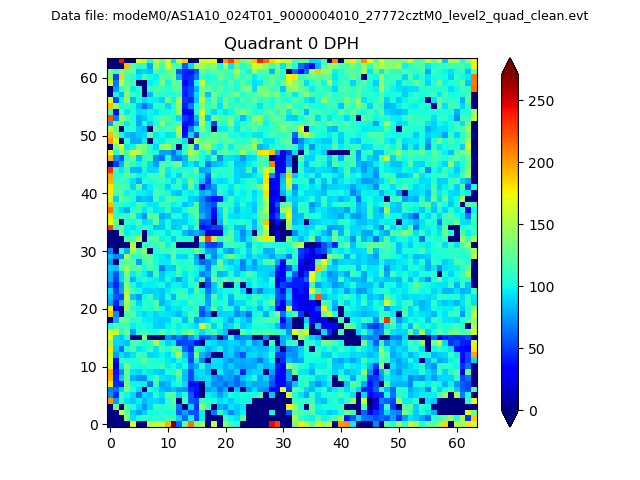 |
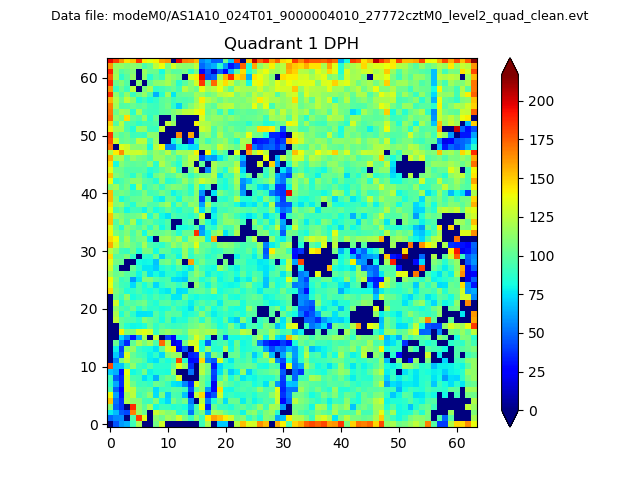 |
Quadrant B |
|---|---|---|---|
| Quadrant D | 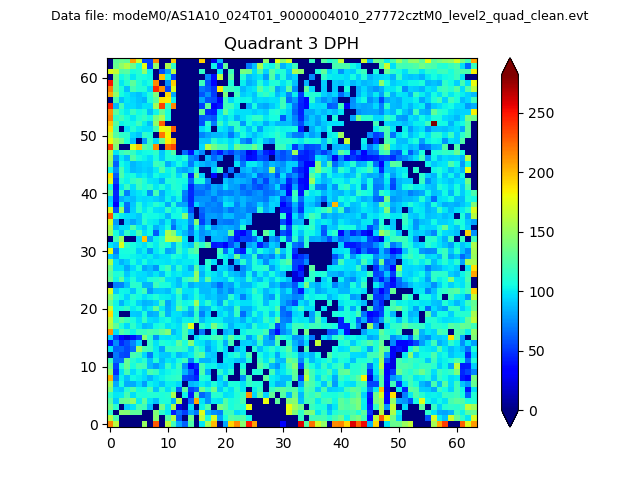 |
 |
Quadrant C |
| Plot type | Count rate plots | Images |
|---|---|---|
| Comparison with Poisson distribution Blue bars denote a histogram of data divided into 1 sec bins. Red curve is a Poisson curve with rate = median count rate of data. |
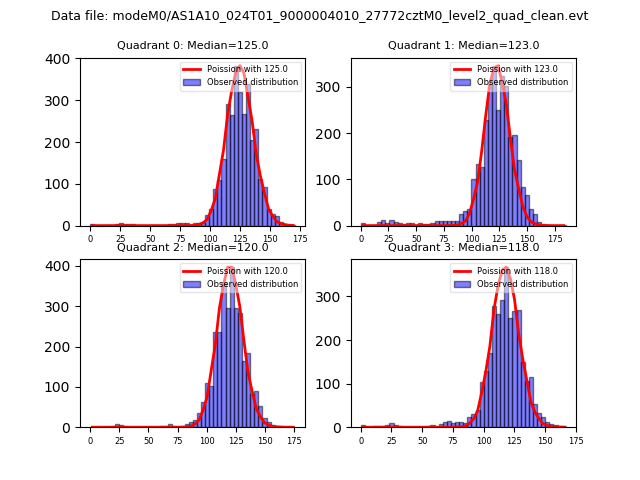 |
 |
| Quadrant-wise count rates Data is divided into 100 sec bins |
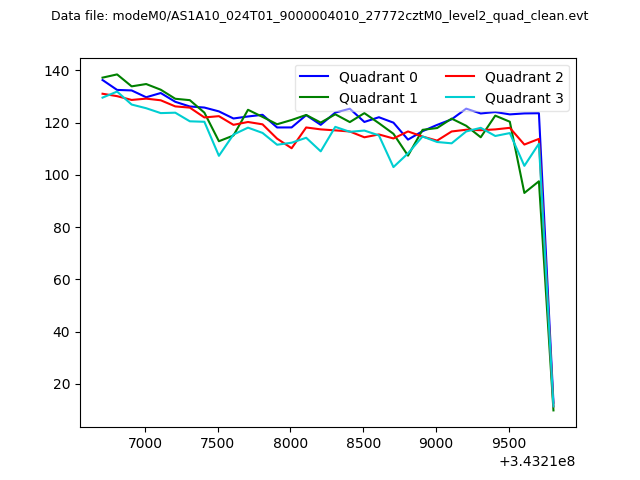 |
|
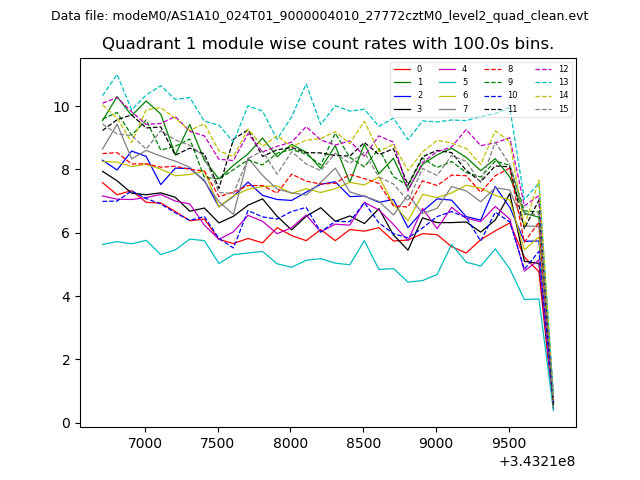
| Module-wise count rates for Quadrant A Data is divided into 100 sec bins |
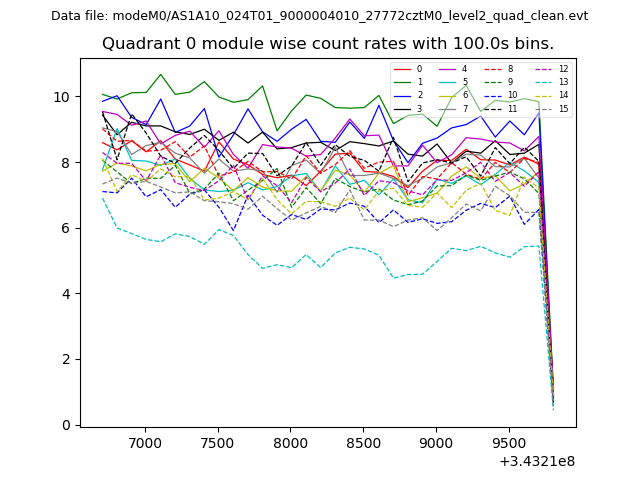 |
 |
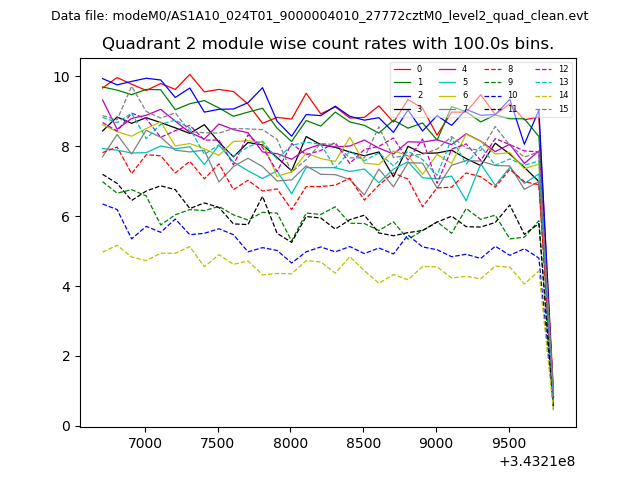
| Module-wise count rates for Quadrant B Data is divided into 100 sec bins |
 |
 |
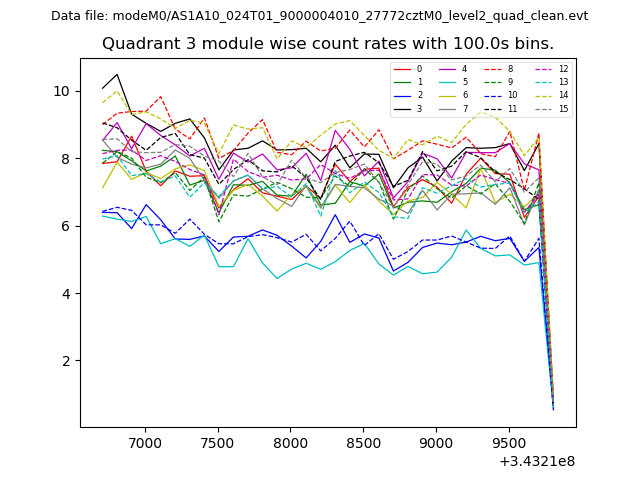
| Module-wise count rates for Quadrant C Data is divided into 100 sec bins |
 |
 |
| Module-wise count rates for Quadrant D Data is divided into 100 sec bins |
 |
 |
| Parameter | Plot |
|---|---|
| CZT HV Monitor | 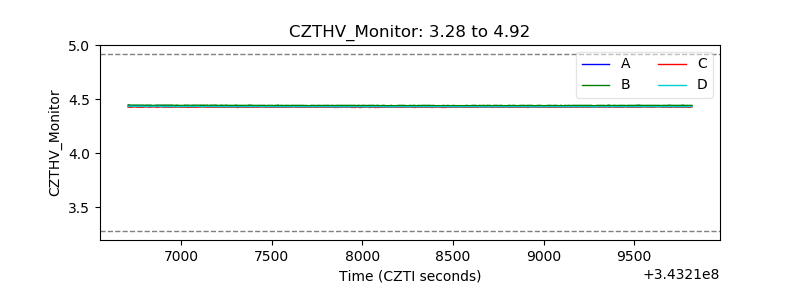 |
| D_VDD |  |
| Temperature 1 | 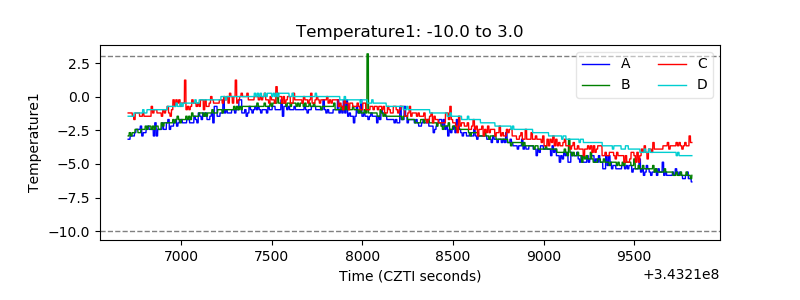 |
| Veto HV Monitor | 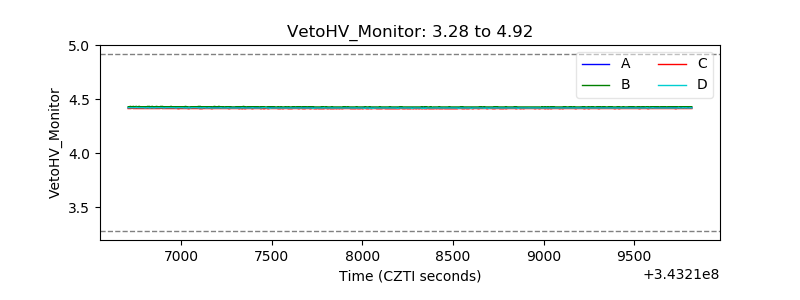 |
| Veto LLD | 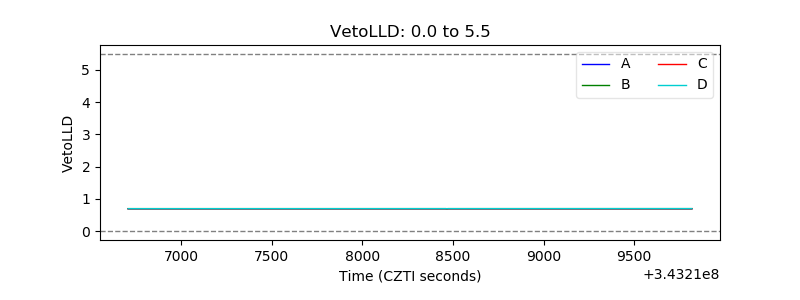 |
| Alpha Counter | 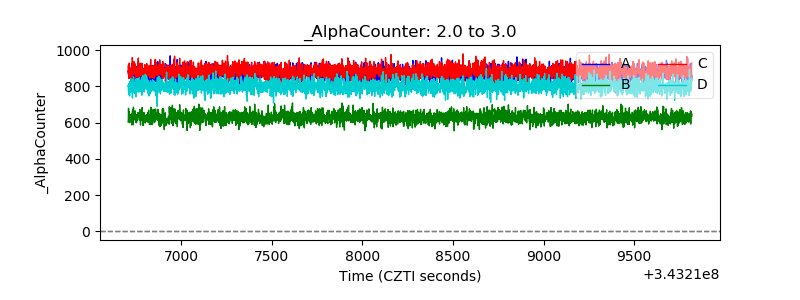 |
| _CPM_Rate | 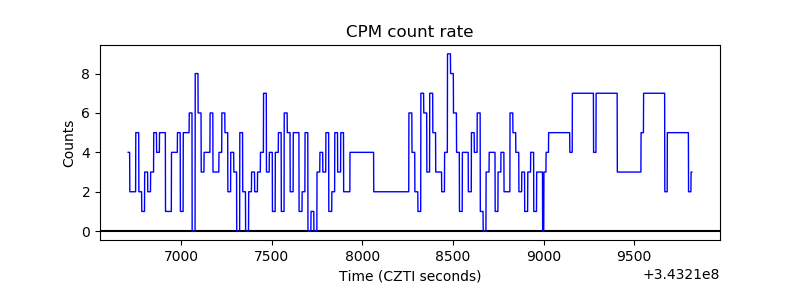 |
| CZT Counter | 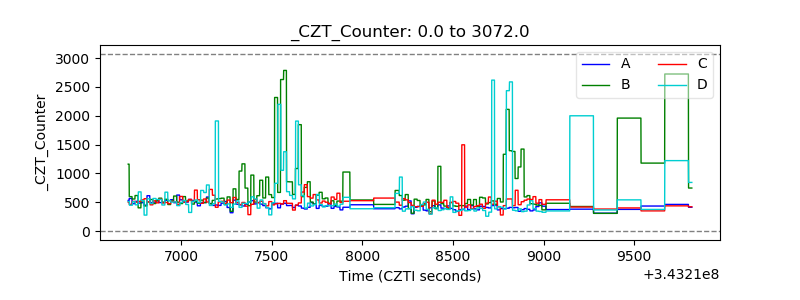 |
| +2.5 Volts monitor |  |
| +5 Volts monitor |  |
| _ROLL_ROT | 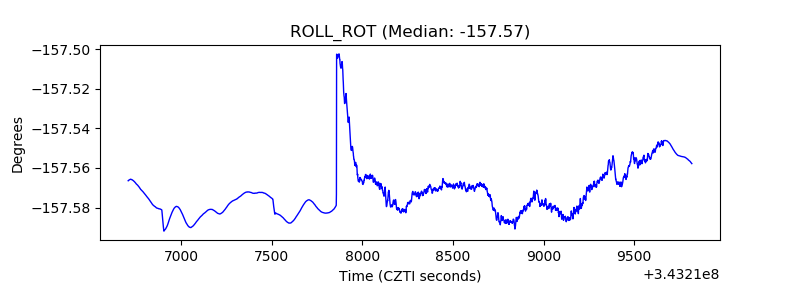 |
| _Roll_DEC | 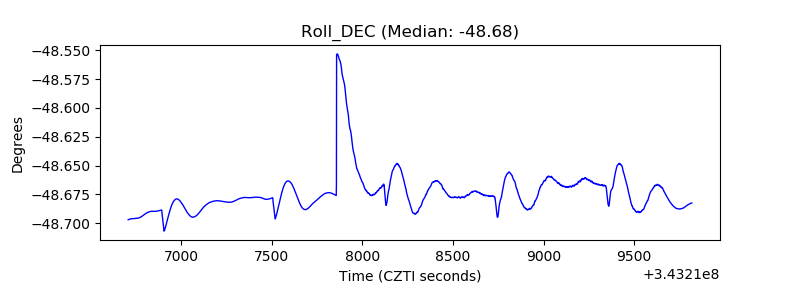 |
| _Roll_RA |  |
| Veto Counter | 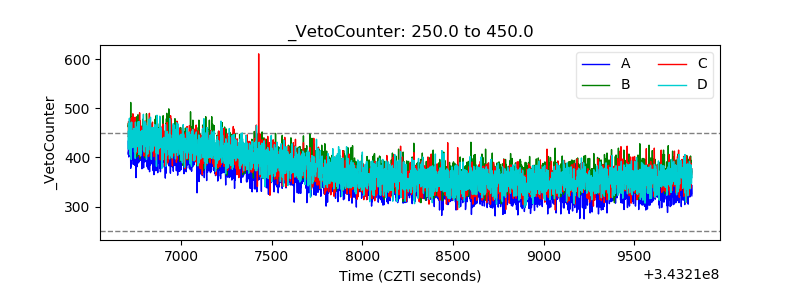 |