| Param | Original file | Final file |
|---|---|---|
| Filename | modeM0/AS1A10_016T02_9000004018cztM0_level2.fits | modeM0/AS1A10_016T02_9000004018cztM0_level2_quad_clean.evt |
| Size (bytes) | 383,990,400 | 271,405,440 |
| Size | 366.2 MB | 258.8 MB |
| Events in quadrant A | 2,441,746 | 1,556,802 |
| Events in quadrant B | 2,292,904 | 1,437,342 |
| Events in quadrant C | 2,306,180 | 1,368,038 |
| Events in quadrant D | 2,057,738 | 1,324,660 |
| Mode M0 | |||
|---|---|---|---|
| Quadrant | BADHDUFLAG | Total packets | Discarded packets |
| A | 0 | 77924 | 0 |
| B | 0 | 89873 | 0 |
| C | 0 | 78878 | 0 |
| D | 0 | 81985 | 0 |
| Mode M9 | |||
|---|---|---|---|
| Quadrant | BADHDUFLAG | Total packets | Discarded packets |
| A | 0 | 72 | 0 |
| B | 0 | 72 | 0 |
| C | 0 | 72 | 0 |
| D | 0 | 72 | 0 |
| Mode SS | |||
|---|---|---|---|
| Quadrant | BADHDUFLAG | Total packets | Discarded packets |
| A | 0 | 752 | 0 |
| B | 0 | 752 | 0 |
| C | 0 | 752 | 0 |
| D | 0 | 752 | 0 |
| Quadrant | Total seconds | Saturated seconds | Saturation percentage |
|---|---|---|---|
| A | 36841 | 447 | 1.213322% |
| B | 36841 | 1874 | 5.086724% |
| C | 36841 | 694 | 1.883771% |
| D | 36841 | 563 | 1.528189% |
Noise dominated data is calculated using 1-second bins in cleaned event files. If a bin has >2000 counts, and if more than 50% of those come from <1% of pixels, then it is considered to be noise-dominated and hence unusable.
| Quadrant | # 1 sec bins | Bins with >0 counts | Bins with >2000 counts | High rate bins dominated by noise | Noise dominated (total time) | Noise dominated (detector-on time) | Marked lightcurve |
|---|---|---|---|---|---|---|---|
| A | 42946 | 36835 | 0 | 0 | 0.00% | 0.00% |  |
| B | 42946 | 36817 | 0 | 0 | 0.00% | 0.00% |  |
| C | 42946 | 36835 | 0 | 0 | 0.00% | 0.00% |  |
| D | 42946 | 36834 | 0 | 0 | 0.00% | 0.00% |  |
Top three noisy pixels from each quadrant. If the there are fewer than three noisy pixels in the level2.evt file, extra rows are filled as -1
| Pixel properties | Quadrant properties | ||||||
|---|---|---|---|---|---|---|---|
| Quadrant | DetID | PixID | Counts | Sigma | Mean | Median | Sigma |
| A | 0 | 29 | 2243 | 10.54 | 635 | 600 | 155.9 |
| A | 7 | 110 | 1913 | 8.42 | 635 | 600 | 155.9 |
| A | 9 | 19 | 1801 | 7.71 | 635 | 600 | 155.9 |
| B | 2 | 9 | 1785 | 9.86 | 605 | 579 | 122.3 |
| B | 5 | 128 | 1537 | 7.83 | 605 | 579 | 122.3 |
| B | 2 | 8 | 1499 | 7.52 | 605 | 579 | 122.3 |
| C | 12 | 241 | 1638 | 6.83 | 609 | 573 | 155.8 |
| C | 9 | 209 | 1574 | 6.42 | 609 | 573 | 155.8 |
| C | 12 | 249 | 1564 | 6.36 | 609 | 573 | 155.8 |
| D | 7 | 3 | 1484 | 6.06 | 586 | 534 | 156.9 |
| D | 6 | 231 | 1478 | 6.02 | 586 | 534 | 156.9 |
| D | 15 | 46 | 1426 | 5.69 | 586 | 534 | 156.9 |
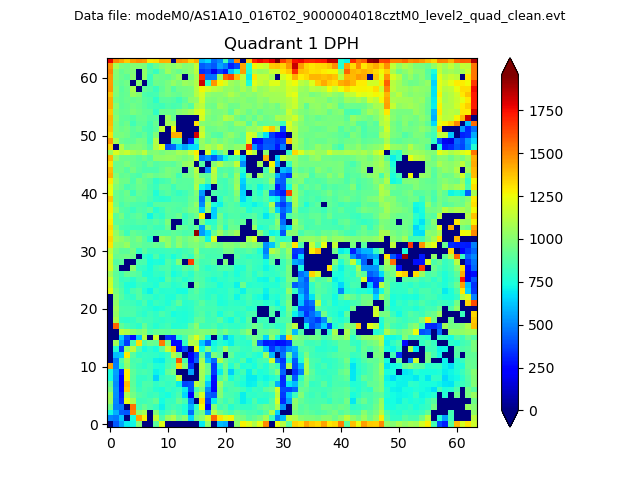
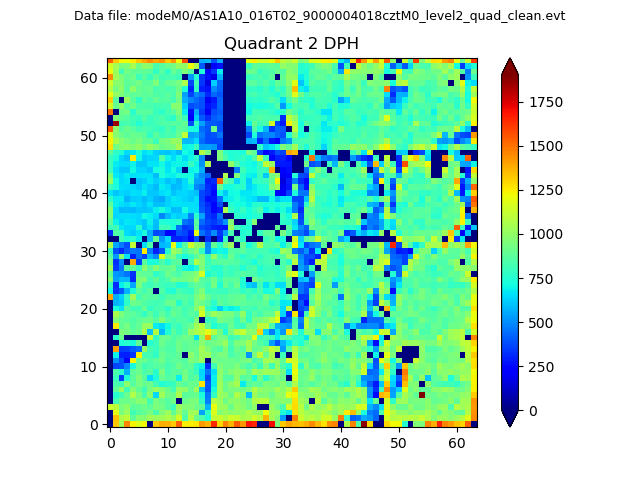
Histogram calculated using DETX and DETY for each event in the final _common_clean file
| Quadrant A |  |
 |
Quadrant B |
|---|---|---|---|
| Quadrant D | 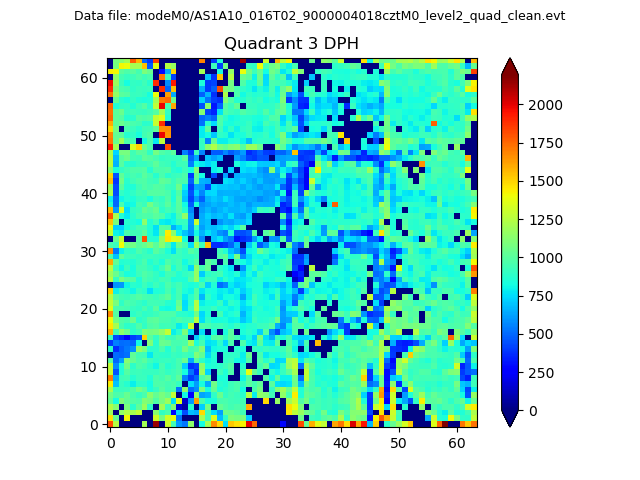 |
 |
Quadrant C |
| Plot type | Count rate plots | Images |
|---|---|---|
| Comparison with Poisson distribution Blue bars denote a histogram of data divided into 1 sec bins. Red curve is a Poisson curve with rate = median count rate of data. |
 |
 |
| Quadrant-wise count rates Data is divided into 100 sec bins |
 |
|
| Module-wise count rates for Quadrant A Data is divided into 100 sec bins |
 |
 |
| Module-wise count rates for Quadrant B Data is divided into 100 sec bins |
 |
 |
| Module-wise count rates for Quadrant C Data is divided into 100 sec bins |
 |
 |
| Module-wise count rates for Quadrant D Data is divided into 100 sec bins |
 |
 |
| Parameter | Plot |
|---|---|
| CZT HV Monitor |  |
| D_VDD |  |
| Temperature 1 |  |
| Veto HV Monitor |  |
| Veto LLD |  |
| Alpha Counter |  |
| _CPM_Rate |  |
| CZT Counter |  |
| +2.5 Volts monitor |  |
| +5 Volts monitor |  |
| _ROLL_ROT |  |
| _Roll_DEC |  |
| _Roll_RA |  |
| Veto Counter |  |