| Param | Original file | Final file |
|---|---|---|
| Filename | modeM0/AS1A10_016T02_9000004018_27804cztM0_level2.evt | modeM0/AS1A10_016T02_9000004018_27804cztM0_level2_quad_clean.evt |
| Size (bytes) | 103,420,800 | 17,228,160 |
| Size | 98.6 MB | 16.4 MB |
| Events in quadrant A | 772,289 | 108,736 |
| Events in quadrant B | 775,800 | 111,812 |
| Events in quadrant C | 760,348 | 104,096 |
| Events in quadrant D | 736,205 | 102,792 |
| Mode M0 | |||
|---|---|---|---|
| Quadrant | BADHDUFLAG | Total packets | Discarded packets |
| A | 0 | 3212 | 0 |
| B | 0 | 3209 | 0 |
| C | 0 | 3148 | 0 |
| D | 0 | 2967 | 0 |
| Mode M9 | |||
|---|---|---|---|
| Quadrant | BADHDUFLAG | Total packets | Discarded packets |
| A | 0 | 12 | 0 |
| B | 0 | 12 | 0 |
| C | 0 | 12 | 0 |
| D | 0 | 12 | 0 |
| Quadrant | Total seconds | Saturated seconds | Saturation percentage |
|---|---|---|---|
| A | 1247 | 9 | 0.721732% |
| B | 1247 | 16 | 1.283079% |
| C | 1247 | 23 | 1.844427% |
| D | 1246 | 14 | 1.123596% |
Noise dominated data is calculated using 1-second bins in cleaned event files. If a bin has >2000 counts, and if more than 50% of those come from <1% of pixels, then it is considered to be noise-dominated and hence unusable.
| Quadrant | # 1 sec bins | Bins with >0 counts | Bins with >2000 counts | High rate bins dominated by noise | Noise dominated (total time) | Noise dominated (detector-on time) | Marked lightcurve |
|---|---|---|---|---|---|---|---|
| A | 1247 | 1247 | 0 | 0 | 0.00% | 0.00% | 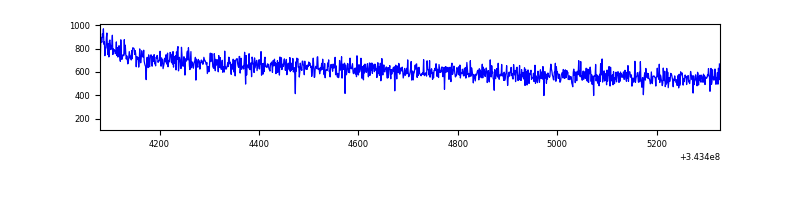 |
| B | 1247 | 1247 | 0 | 0 | 0.00% | 0.00% | 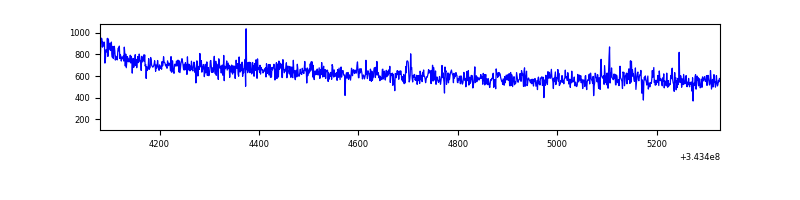 |
| C | 1247 | 1247 | 0 | 0 | 0.00% | 0.00% | 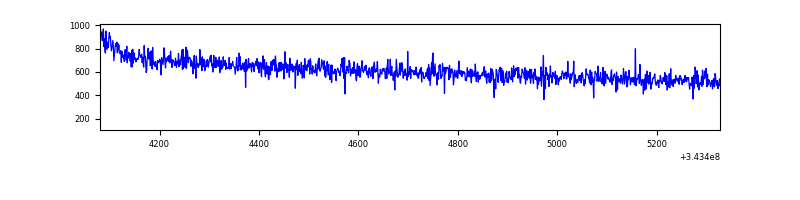 |
| D | 1246 | 1246 | 7 | 7 | 0.56% | 0.56% | 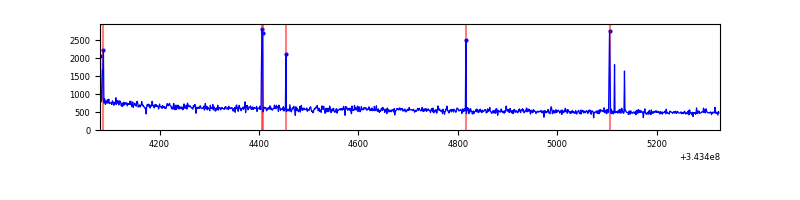 |
Top three noisy pixels from each quadrant. If the there are fewer than three noisy pixels in the level2.evt file, extra rows are filled as -1
| Pixel properties | Quadrant properties | ||||||
|---|---|---|---|---|---|---|---|
| Quadrant | DetID | PixID | Counts | Sigma | Mean | Median | Sigma |
| A | 13 | 254 | 1956 | 42.78 | 200 | 197 | 41.1 |
| A | 0 | 226 | 1670 | 35.82 | 200 | 197 | 41.1 |
| A | 3 | 137 | 1669 | 35.8 | 200 | 197 | 41.1 |
| B | 12 | 111 | 4310 | 106.54 | 197 | 193 | 38.6 |
| B | 11 | 111 | 3975 | 97.87 | 197 | 193 | 38.6 |
| B | 14 | 111 | 3867 | 95.07 | 197 | 193 | 38.6 |
| C | 14 | 238 | 30609 | 680.44 | 186 | 187 | 44.7 |
| C | 3 | 233 | 1902 | 38.36 | 186 | 187 | 44.7 |
| C | 4 | 175 | 1607 | 31.76 | 186 | 187 | 44.7 |
| D | 1 | 52 | 22298 | 474.24 | 188 | 182 | 46.6 |
| D | 2 | 234 | 3747 | 76.44 | 188 | 182 | 46.6 |
| D | 2 | 250 | 2441 | 48.44 | 188 | 182 | 46.6 |
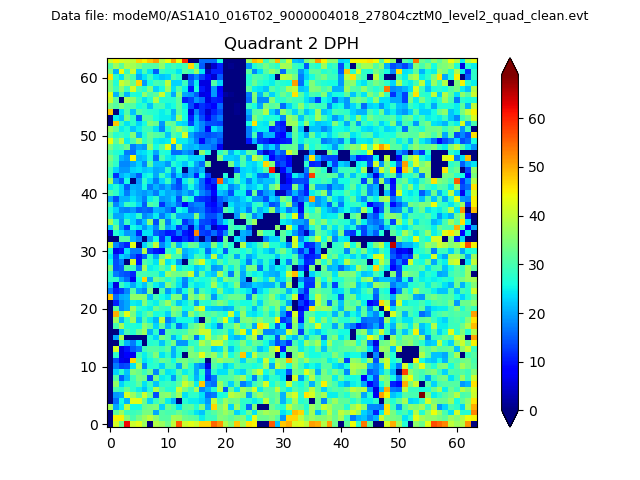
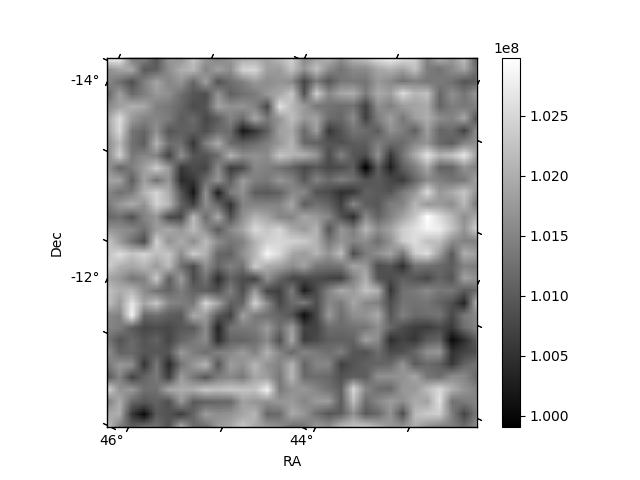
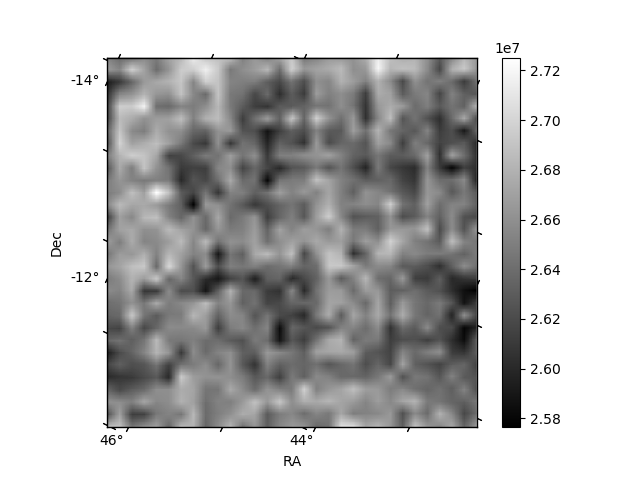
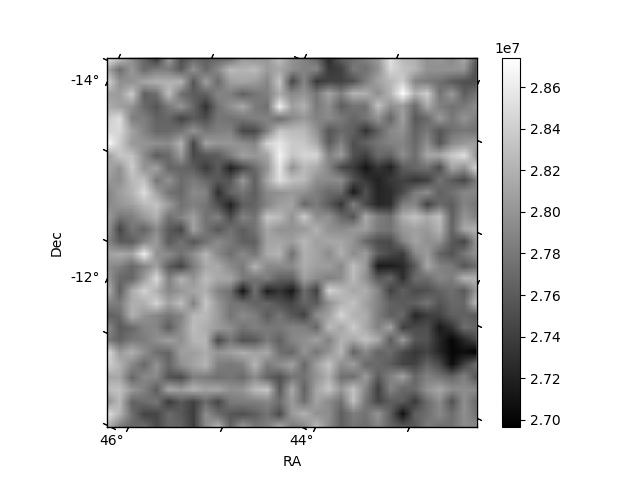
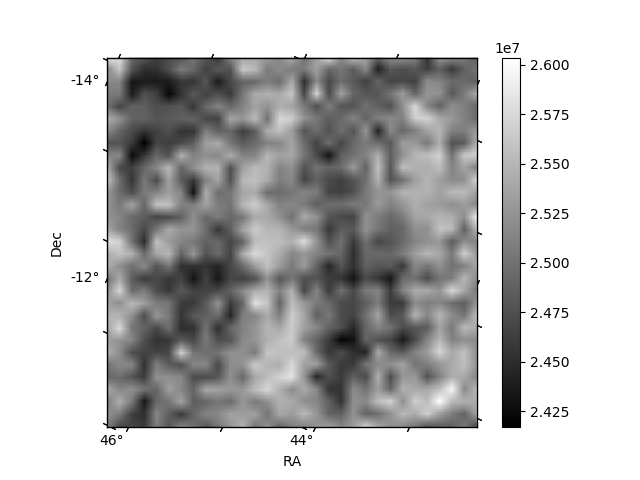
Histogram calculated using DETX and DETY for each event in the final _common_clean file
| Quadrant A | 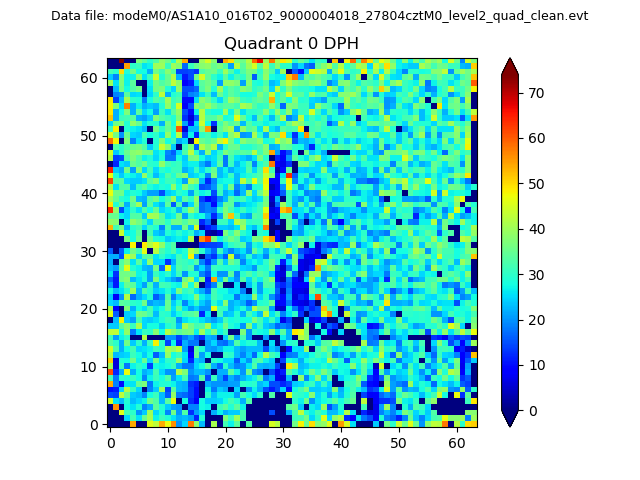 |
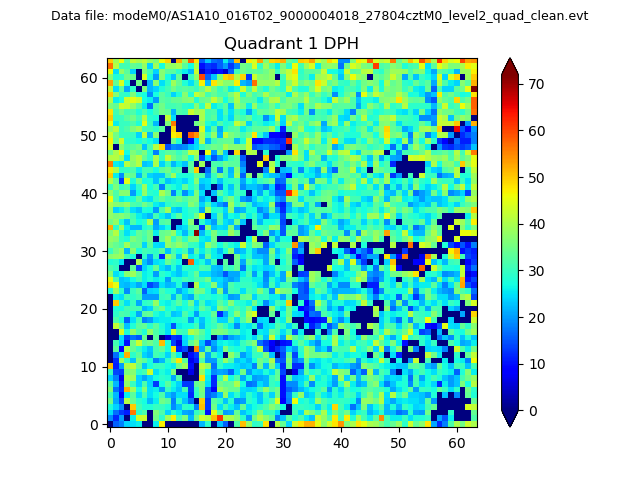 |
Quadrant B |
|---|---|---|---|
| Quadrant D | 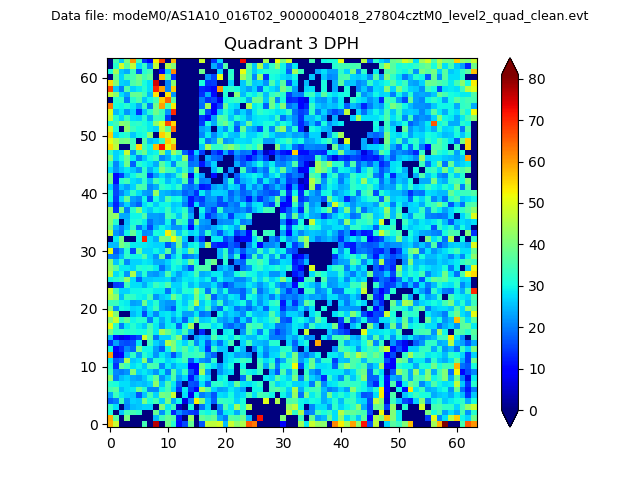 |
 |
Quadrant C |
| Plot type | Count rate plots | Images |
|---|---|---|
| Comparison with Poisson distribution Blue bars denote a histogram of data divided into 1 sec bins. Red curve is a Poisson curve with rate = median count rate of data. |
 |
 |
| Quadrant-wise count rates Data is divided into 100 sec bins |
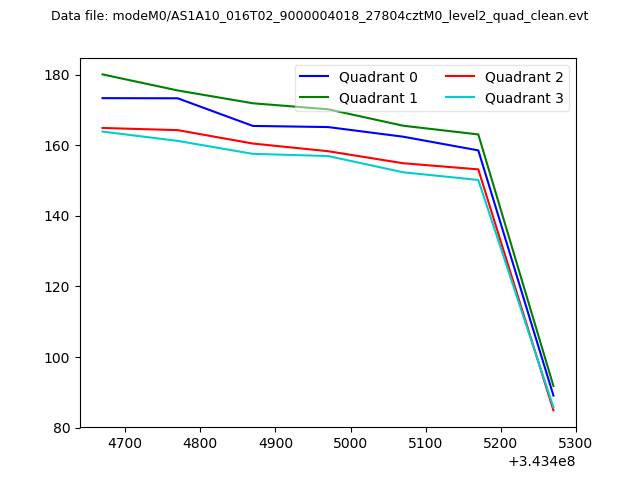 |
|
| Module-wise count rates for Quadrant A Data is divided into 100 sec bins |
 |
 |
| Module-wise count rates for Quadrant B Data is divided into 100 sec bins |
 |
 |
| Module-wise count rates for Quadrant C Data is divided into 100 sec bins |
 |
 |
| Module-wise count rates for Quadrant D Data is divided into 100 sec bins |
 |
 |
| Parameter | Plot |
|---|---|
| CZT HV Monitor | 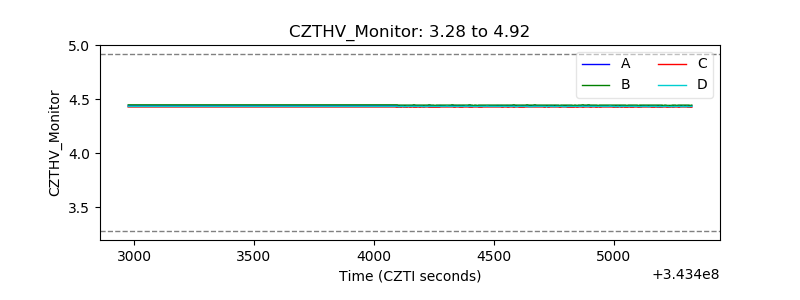 |
| D_VDD | 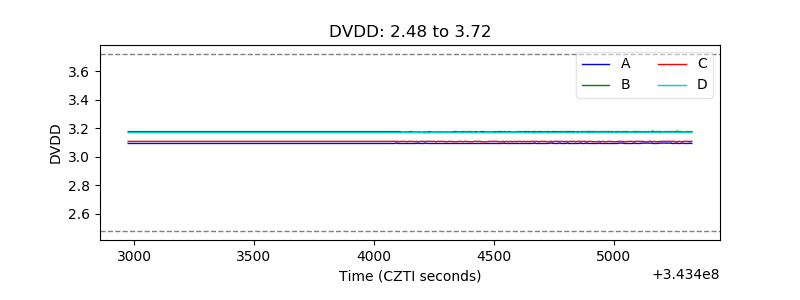 |
| Temperature 1 | 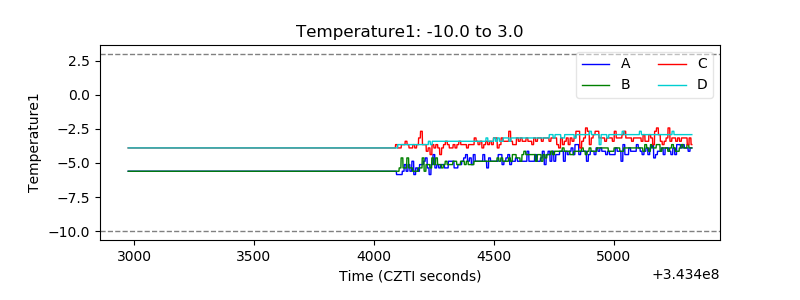 |
| Veto HV Monitor | 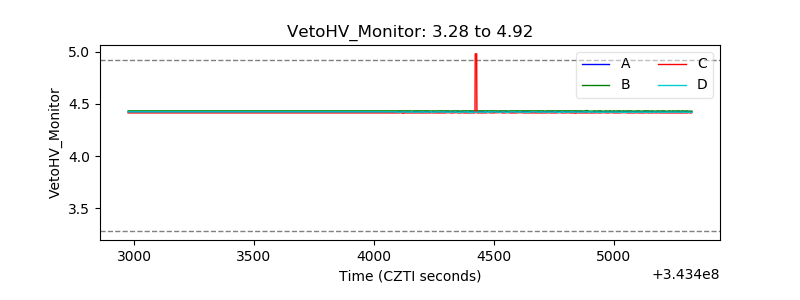 |
| Veto LLD |  |
| Alpha Counter | 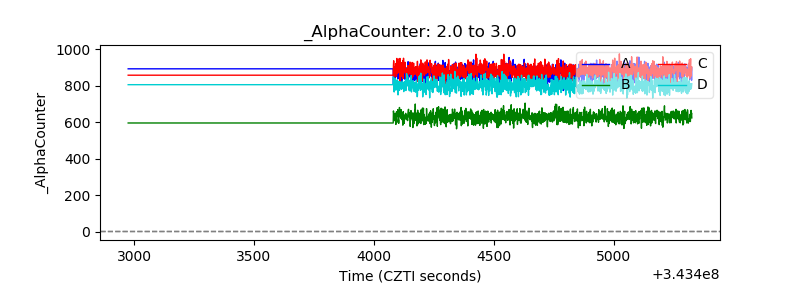 |
| _CPM_Rate | 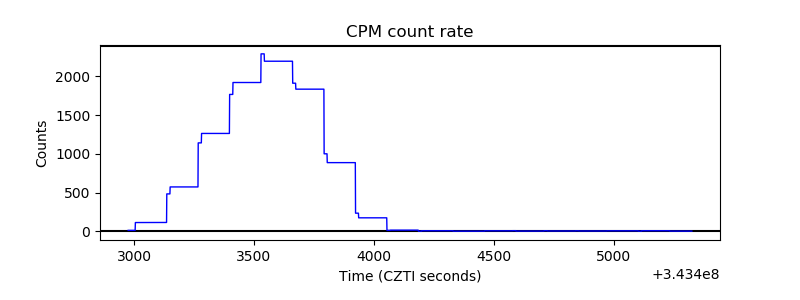 |
| CZT Counter | 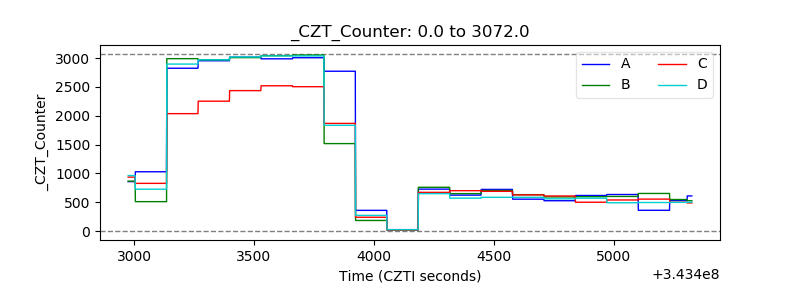 |
| +2.5 Volts monitor | 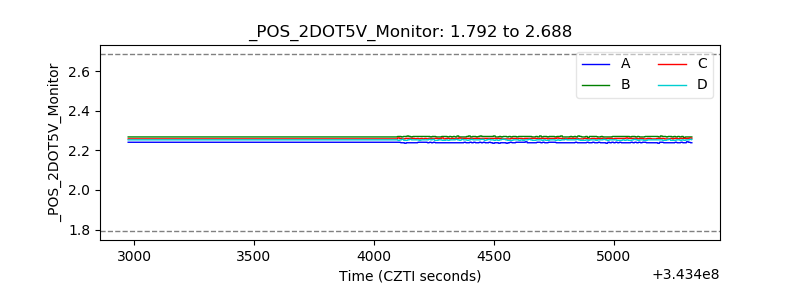 |
| +5 Volts monitor | 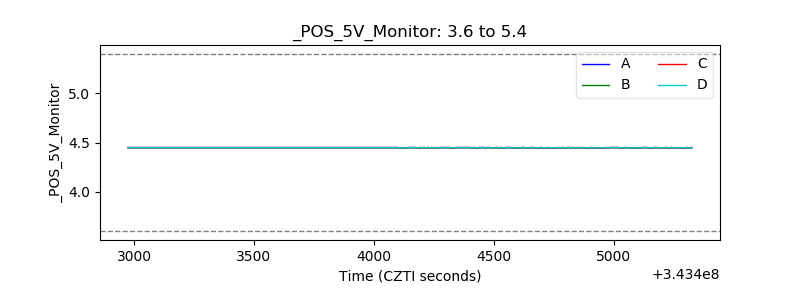 |
| _ROLL_ROT |  |
| _Roll_DEC |  |
| _Roll_RA | 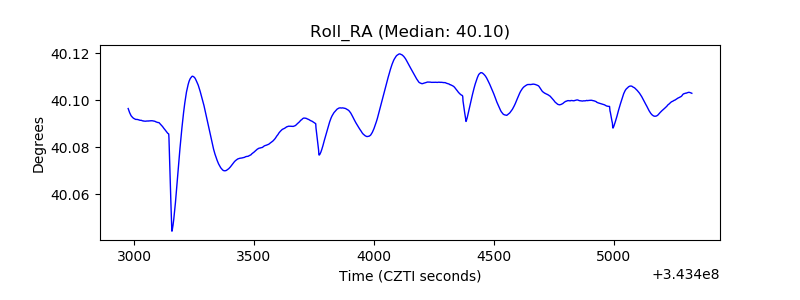 |
| Veto Counter |  |