| Param | Original file | Final file |
|---|---|---|
| Filename | modeM0/AS1A10_016T02_9000004018_27806cztM0_level2.evt | modeM0/AS1A10_016T02_9000004018_27806cztM0_level2_quad_clean.evt |
| Size (bytes) | 480,502,080 | 124,087,680 |
| Size | 458.2 MB | 118.3 MB |
| Events in quadrant A | 3,510,334 | 863,414 |
| Events in quadrant B | 3,646,083 | 872,644 |
| Events in quadrant C | 3,477,201 | 779,922 |
| Events in quadrant D | 3,475,818 | 787,891 |
| Mode M0 | |||
|---|---|---|---|
| Quadrant | BADHDUFLAG | Total packets | Discarded packets |
| A | 0 | 14446 | 0 |
| B | 0 | 14876 | 0 |
| C | 0 | 14382 | 0 |
| D | 0 | 14465 | 0 |
| Mode M9 | |||
|---|---|---|---|
| Quadrant | BADHDUFLAG | Total packets | Discarded packets |
| A | 0 | 13 | 0 |
| B | 0 | 13 | 0 |
| C | 0 | 13 | 0 |
| D | 0 | 13 | 0 |
| Quadrant | Total seconds | Saturated seconds | Saturation percentage |
|---|---|---|---|
| A | 6518 | 114 | 1.749003% |
| B | 6519 | 142 | 2.178248% |
| C | 6519 | 144 | 2.208928% |
| D | 6519 | 88 | 1.349900% |
Noise dominated data is calculated using 1-second bins in cleaned event files. If a bin has >2000 counts, and if more than 50% of those come from <1% of pixels, then it is considered to be noise-dominated and hence unusable.
| Quadrant | # 1 sec bins | Bins with >0 counts | Bins with >2000 counts | High rate bins dominated by noise | Noise dominated (total time) | Noise dominated (detector-on time) | Marked lightcurve |
|---|---|---|---|---|---|---|---|
| A | 7793 | 6518 | 0 | 0 | 0.00% | 0.00% | 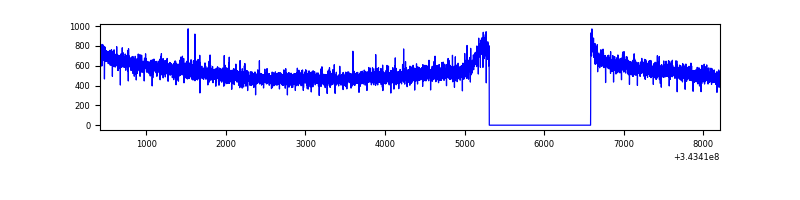 |
| B | 7794 | 6519 | 5 | 5 | 0.06% | 0.08% | 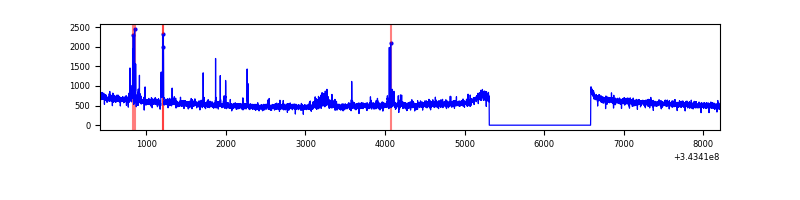 |
| C | 7794 | 6519 | 5 | 5 | 0.06% | 0.08% | 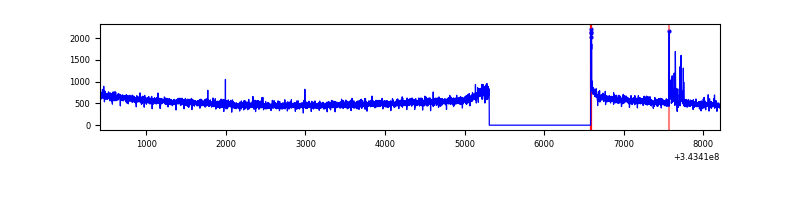 |
| D | 7794 | 6519 | 4 | 4 | 0.05% | 0.06% | 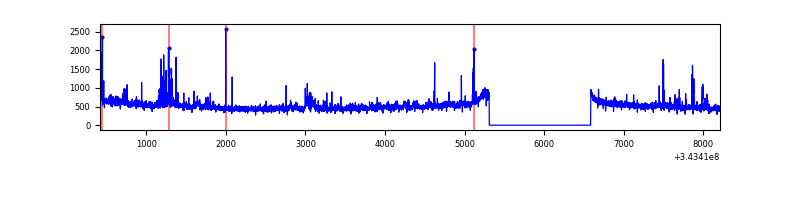 |
Top three noisy pixels from each quadrant. If the there are fewer than three noisy pixels in the level2.evt file, extra rows are filled as -1
| Pixel properties | Quadrant properties | ||||||
|---|---|---|---|---|---|---|---|
| Quadrant | DetID | PixID | Counts | Sigma | Mean | Median | Sigma |
| A | 13 | 254 | 9274 | 46.47 | 911 | 898 | 180.2 |
| A | 3 | 137 | 8194 | 40.48 | 911 | 898 | 180.2 |
| A | 0 | 226 | 7439 | 36.29 | 911 | 898 | 180.2 |
| B | 10 | 245 | 121422 | 706.48 | 899 | 880 | 170.6 |
| B | 12 | 111 | 20298 | 113.81 | 899 | 880 | 170.6 |
| B | 11 | 111 | 18151 | 101.22 | 899 | 880 | 170.6 |
| C | 14 | 238 | 137265 | 701.07 | 838 | 845 | 194.6 |
| C | 10 | 22 | 58321 | 295.37 | 838 | 845 | 194.6 |
| C | 3 | 233 | 14118 | 68.21 | 838 | 845 | 194.6 |
| D | 1 | 52 | 235098 | 1137.34 | 859 | 838 | 206.0 |
| D | 2 | 234 | 25935 | 121.85 | 859 | 838 | 206.0 |
| D | 14 | 226 | 8098 | 35.25 | 859 | 838 | 206.0 |
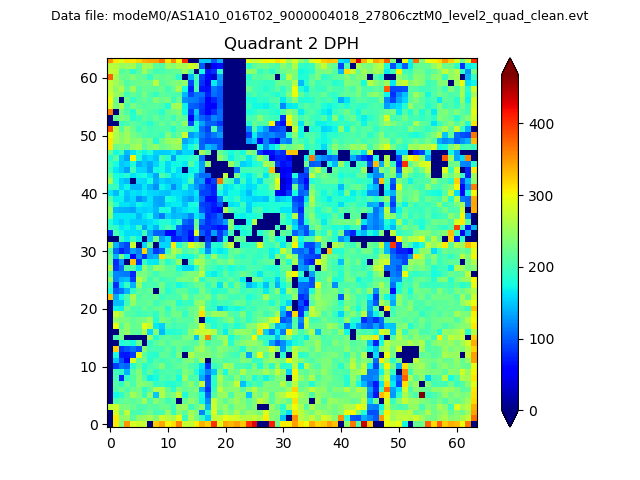
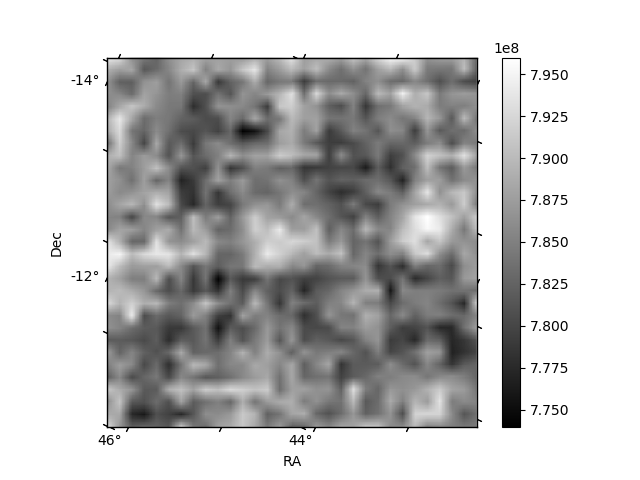
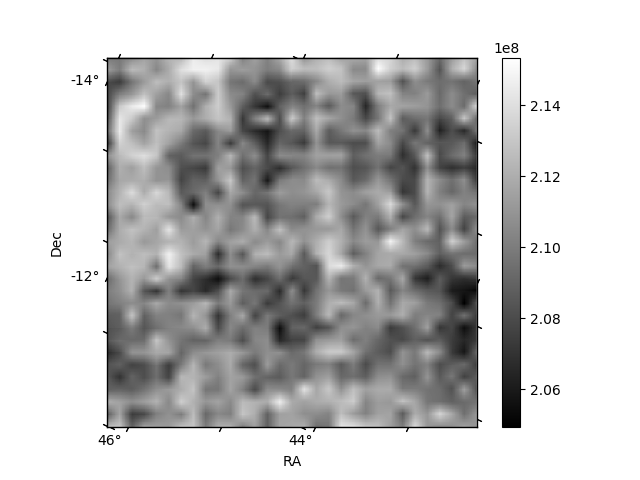
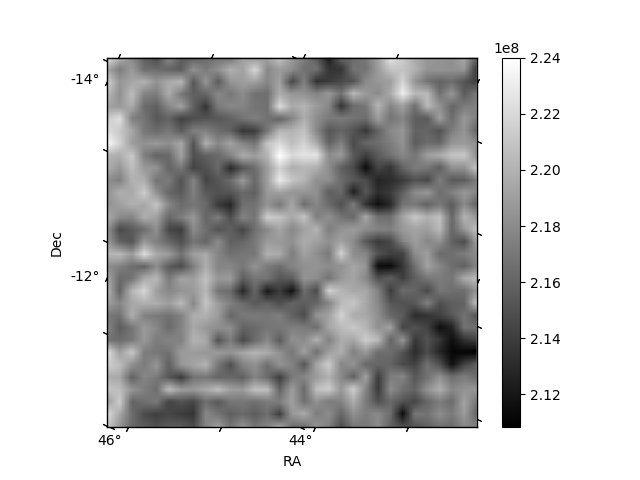
Histogram calculated using DETX and DETY for each event in the final _common_clean file
| Quadrant A | 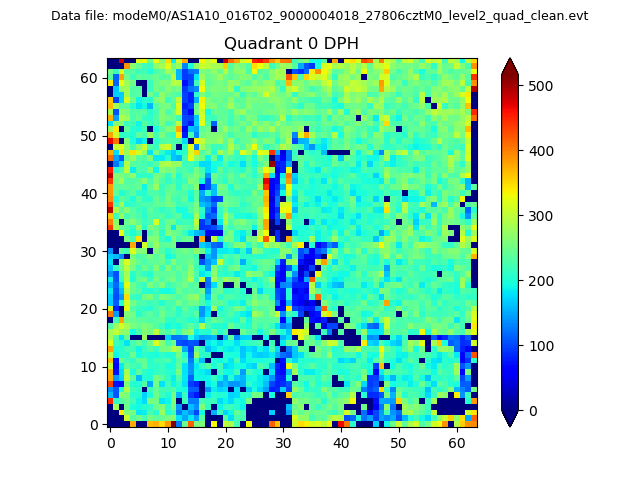 |
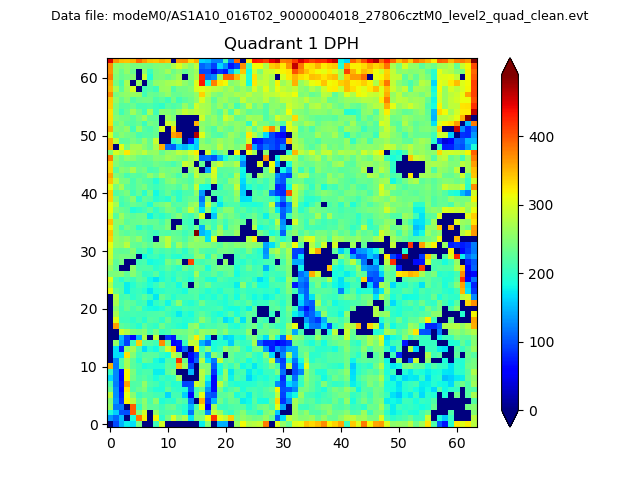 |
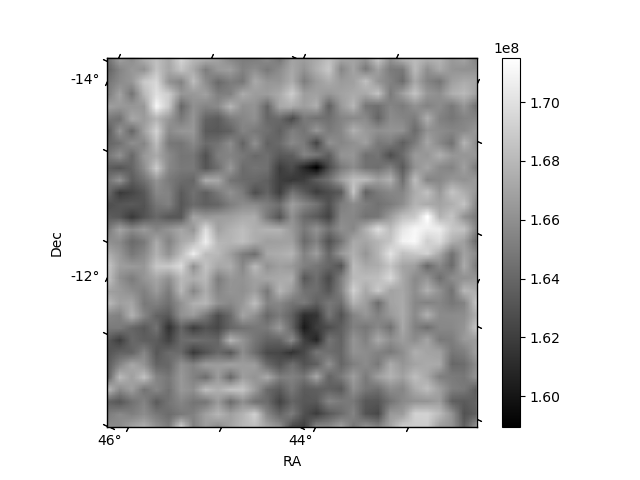
Quadrant B |
|---|---|---|---|
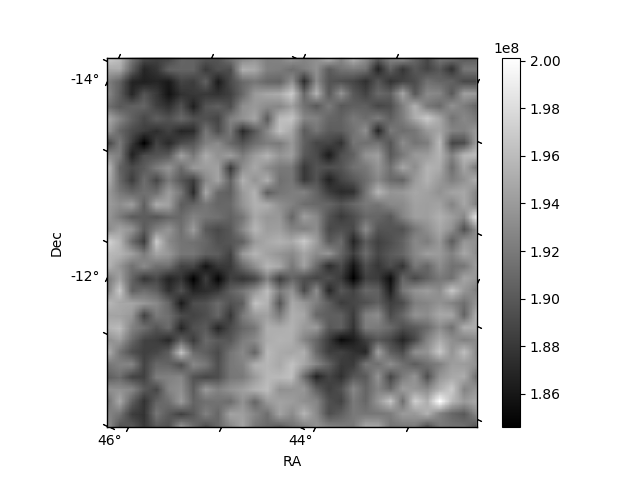
| Quadrant D | 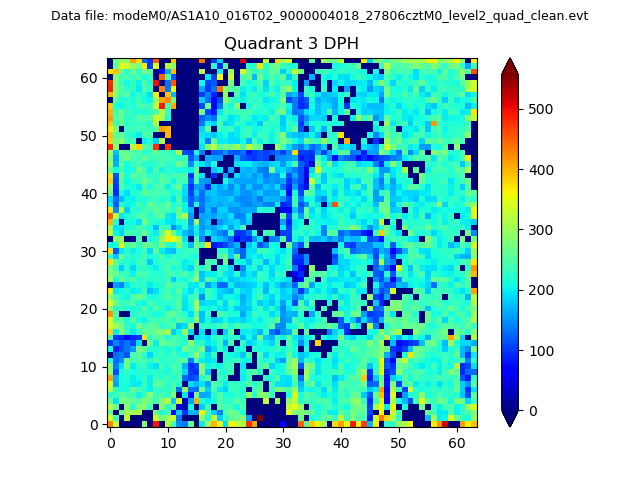 |
 |
Quadrant C |
| Plot type | Count rate plots | Images |
|---|---|---|
| Comparison with Poisson distribution Blue bars denote a histogram of data divided into 1 sec bins. Red curve is a Poisson curve with rate = median count rate of data. |
 |
 |
| Quadrant-wise count rates Data is divided into 100 sec bins |
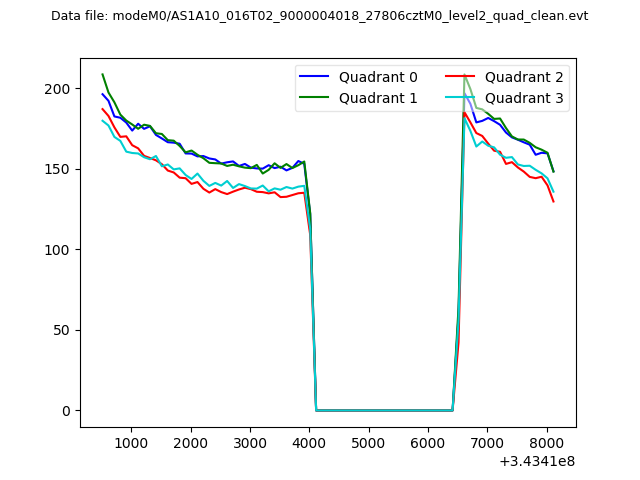 |
|
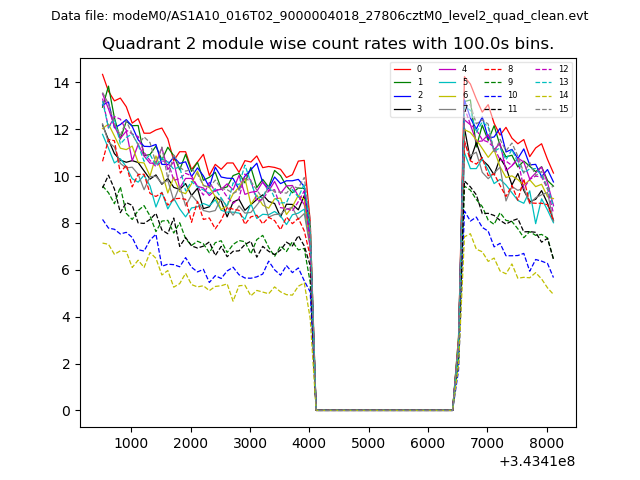
| Module-wise count rates for Quadrant A Data is divided into 100 sec bins |
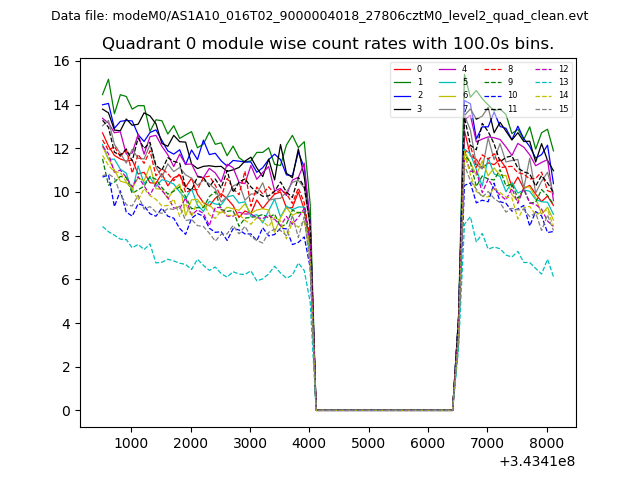 |
 |
| Module-wise count rates for Quadrant B Data is divided into 100 sec bins |
 |
 |
| Module-wise count rates for Quadrant C Data is divided into 100 sec bins |
 |
 |
| Module-wise count rates for Quadrant D Data is divided into 100 sec bins |
 |
 |
| Parameter | Plot |
|---|---|
| CZT HV Monitor | 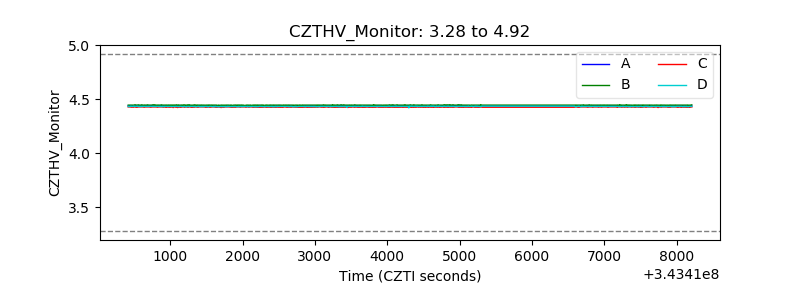 |
| D_VDD |  |
| Temperature 1 | 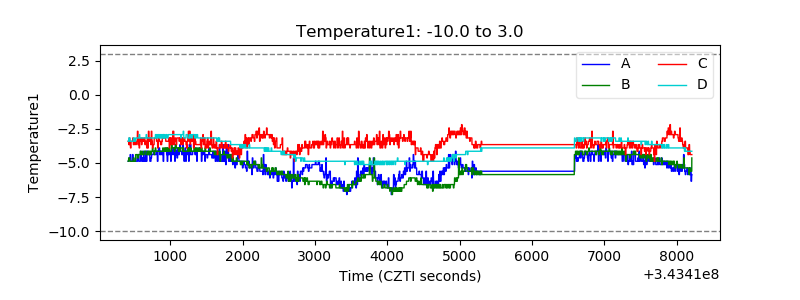 |
| Veto HV Monitor | 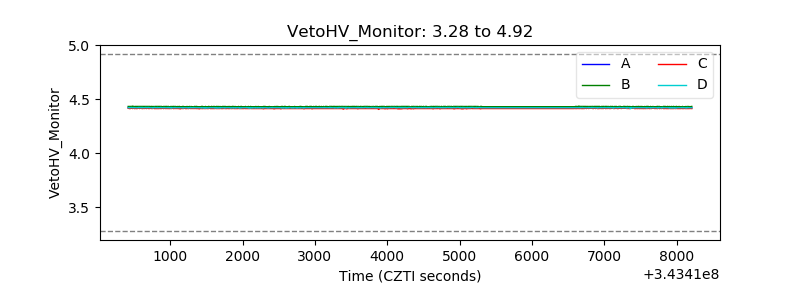 |
| Veto LLD | 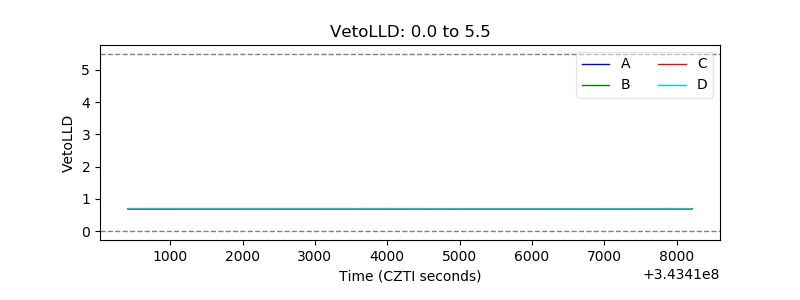 |
| Alpha Counter | 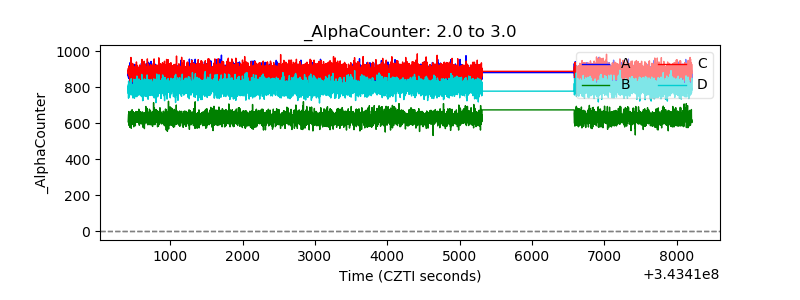 |
| _CPM_Rate | 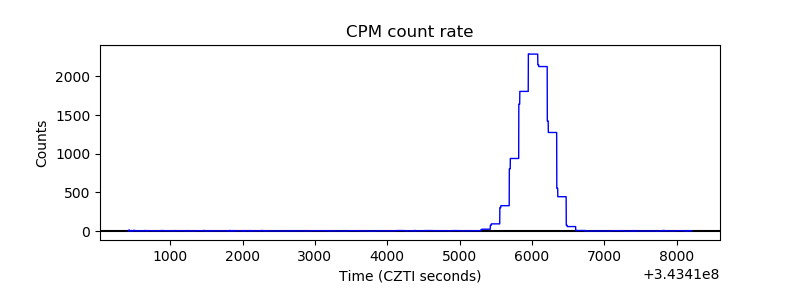 |
| CZT Counter | 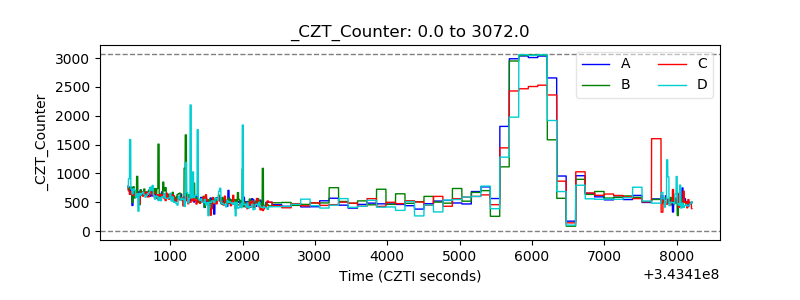 |
| +2.5 Volts monitor |  |
| +5 Volts monitor |  |
| _ROLL_ROT |  |
| _Roll_DEC |  |
| _Roll_RA | 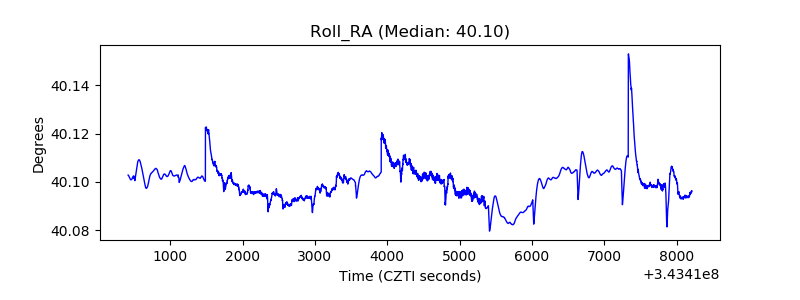 |
| Veto Counter | 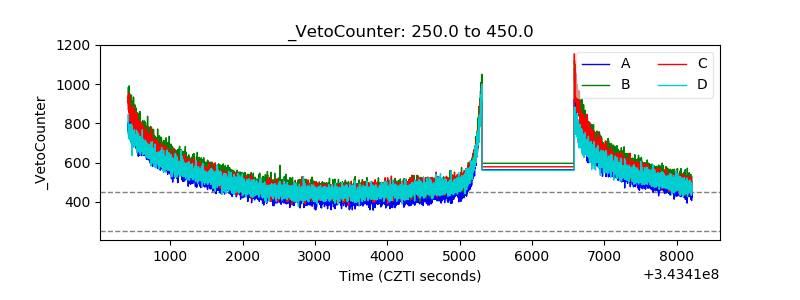 |