| Param | Original file | Final file |
|---|---|---|
| Filename | modeM0/AS1A10_016T02_9000004018_27807cztM0_level2.evt | modeM0/AS1A10_016T02_9000004018_27807cztM0_level2_quad_clean.evt |
| Size (bytes) | 441,302,400 | 104,806,080 |
| Size | 420.9 MB | 100.0 MB |
| Events in quadrant A | 3,190,011 | 719,570 |
| Events in quadrant B | 3,380,033 | 721,025 |
| Events in quadrant C | 3,246,904 | 644,981 |
| Events in quadrant D | 3,130,118 | 659,444 |
| Mode M0 | |||
|---|---|---|---|
| Quadrant | BADHDUFLAG | Total packets | Discarded packets |
| A | 0 | 13119 | 0 |
| B | 0 | 13717 | 0 |
| C | 0 | 13403 | 0 |
| D | 0 | 13259 | 0 |
| Mode M9 | |||
|---|---|---|---|
| Quadrant | BADHDUFLAG | Total packets | Discarded packets |
| A | 0 | 12 | 0 |
| B | 0 | 12 | 0 |
| C | 0 | 12 | 0 |
| D | 0 | 12 | 0 |
| Quadrant | Total seconds | Saturated seconds | Saturation percentage |
|---|---|---|---|
| A | 6150 | 115 | 1.869919% |
| B | 6150 | 174 | 2.829268% |
| C | 6150 | 156 | 2.536585% |
| D | 6149 | 74 | 1.203448% |
Noise dominated data is calculated using 1-second bins in cleaned event files. If a bin has >2000 counts, and if more than 50% of those come from <1% of pixels, then it is considered to be noise-dominated and hence unusable.
| Quadrant | # 1 sec bins | Bins with >0 counts | Bins with >2000 counts | High rate bins dominated by noise | Noise dominated (total time) | Noise dominated (detector-on time) | Marked lightcurve |
|---|---|---|---|---|---|---|---|
| A | 7385 | 6150 | 0 | 0 | 0.00% | 0.00% | 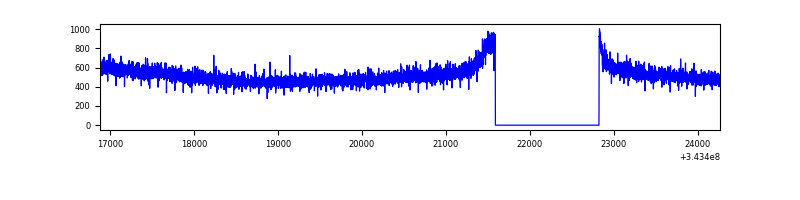 |
| B | 7385 | 6150 | 16 | 16 | 0.22% | 0.26% | 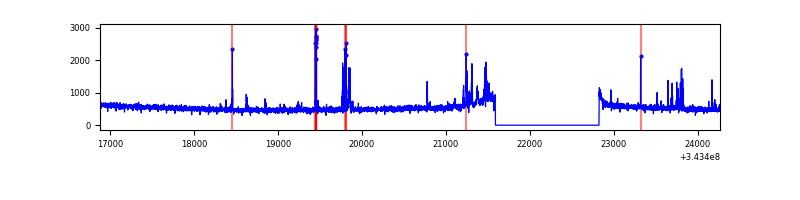 |
| C | 7385 | 6150 | 1 | 1 | 0.01% | 0.02% |  |
| D | 7384 | 6149 | 3 | 3 | 0.04% | 0.05% | 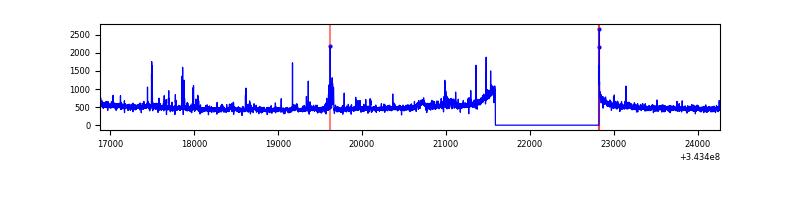 |
Top three noisy pixels from each quadrant. If the there are fewer than three noisy pixels in the level2.evt file, extra rows are filled as -1
| Pixel properties | Quadrant properties | ||||||
|---|---|---|---|---|---|---|---|
| Quadrant | DetID | PixID | Counts | Sigma | Mean | Median | Sigma |
| A | 13 | 254 | 8413 | 46.08 | 828 | 817 | 164.9 |
| A | 3 | 137 | 7642 | 41.4 | 828 | 817 | 164.9 |
| A | 0 | 226 | 6803 | 36.31 | 828 | 817 | 164.9 |
| B | 10 | 245 | 86257 | 548.8 | 816 | 796 | 155.7 |
| B | 15 | 33 | 69562 | 441.59 | 816 | 796 | 155.7 |
| B | 0 | 190 | 26821 | 167.12 | 816 | 796 | 155.7 |
| C | 14 | 238 | 125240 | 696.27 | 768 | 776 | 178.8 |
| C | 3 | 233 | 65844 | 364.0 | 768 | 776 | 178.8 |
| C | 10 | 22 | 44925 | 246.97 | 768 | 776 | 178.8 |
| D | 1 | 52 | 176152 | 955.21 | 782 | 763 | 183.6 |
| D | 2 | 234 | 24335 | 128.38 | 782 | 763 | 183.6 |
| D | 3 | 14 | 7832 | 38.5 | 782 | 763 | 183.6 |
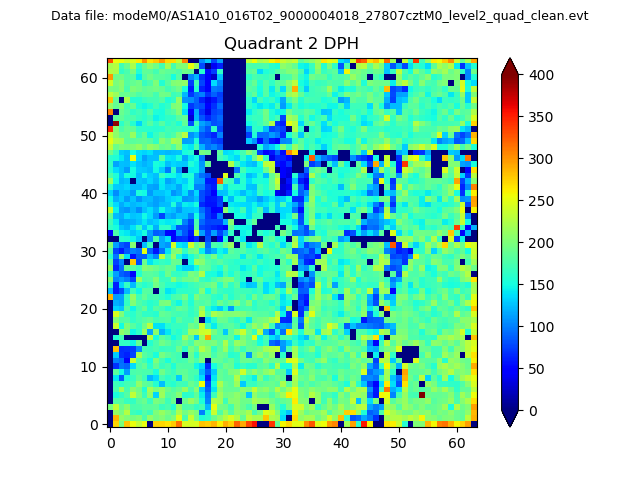
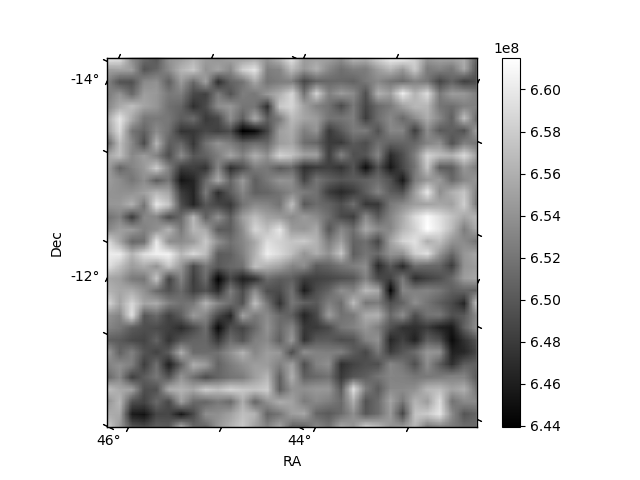
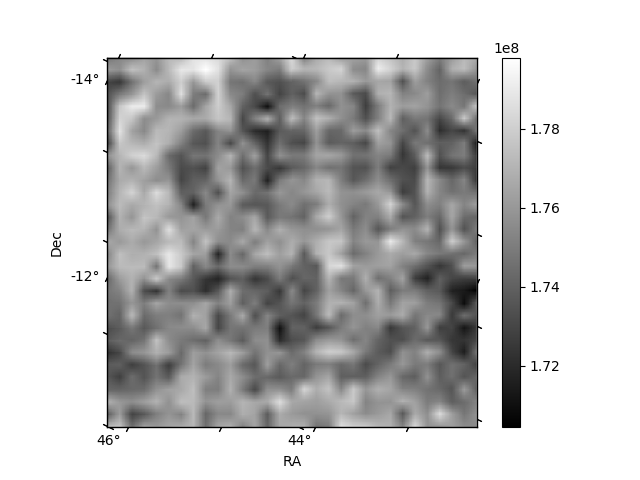
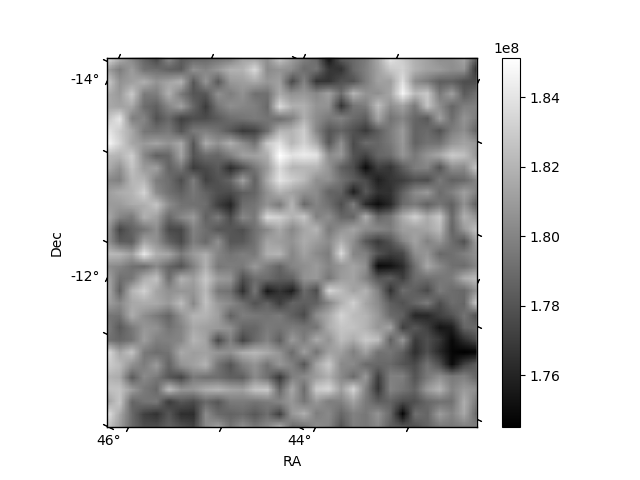
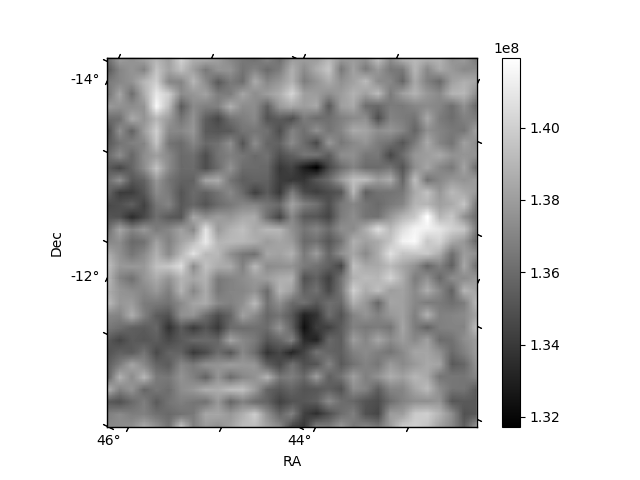
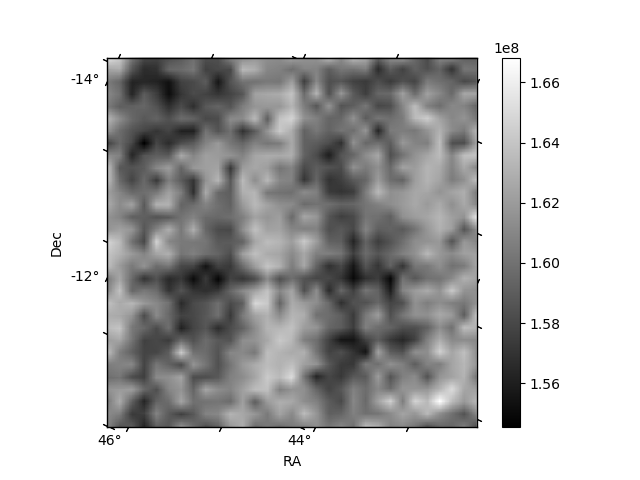
Histogram calculated using DETX and DETY for each event in the final _common_clean file
| Quadrant A | 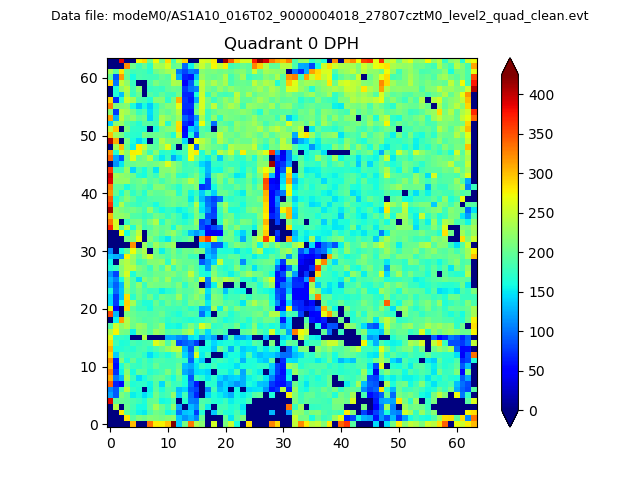 |
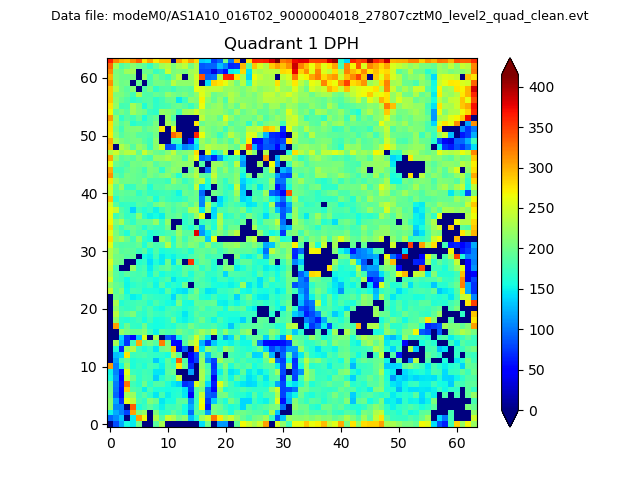 |
Quadrant B |
|---|---|---|---|
| Quadrant D | 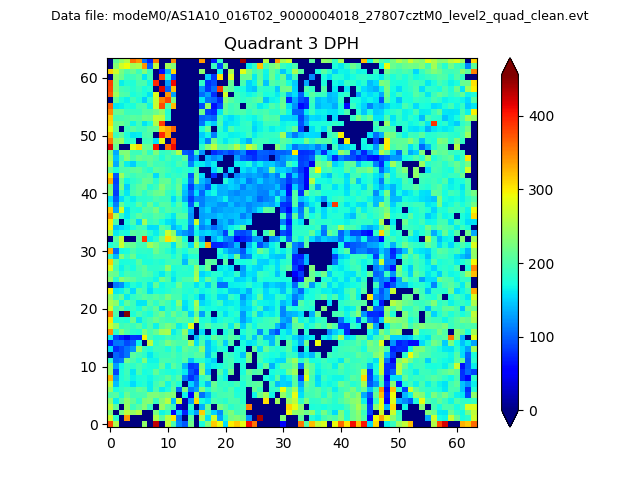 |
 |
Quadrant C |
| Plot type | Count rate plots | Images |
|---|---|---|
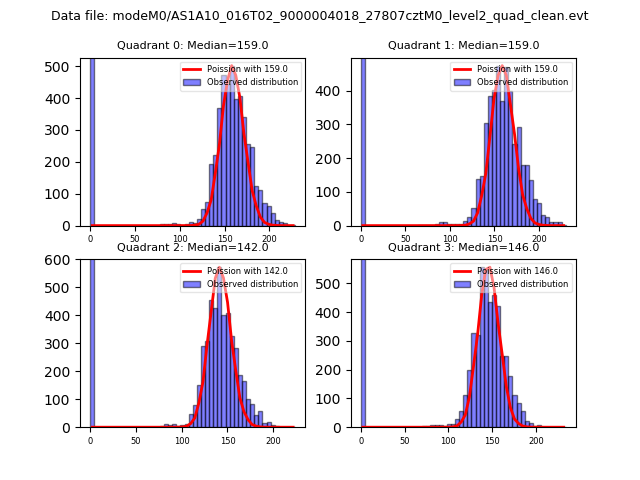
| Comparison with Poisson distribution Blue bars denote a histogram of data divided into 1 sec bins. Red curve is a Poisson curve with rate = median count rate of data. |
 |
 |
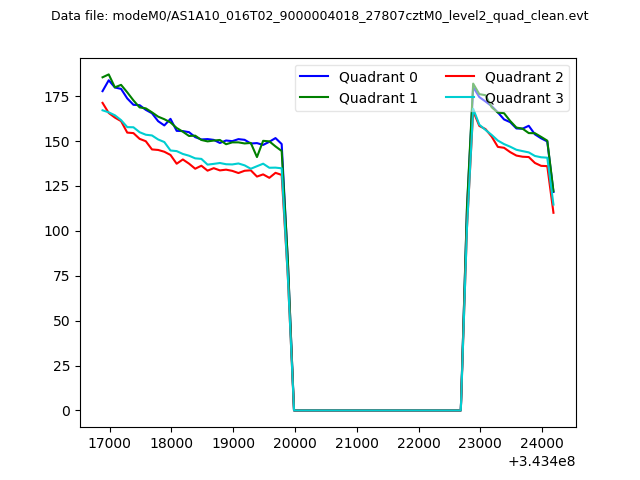
| Quadrant-wise count rates Data is divided into 100 sec bins |
 |
|
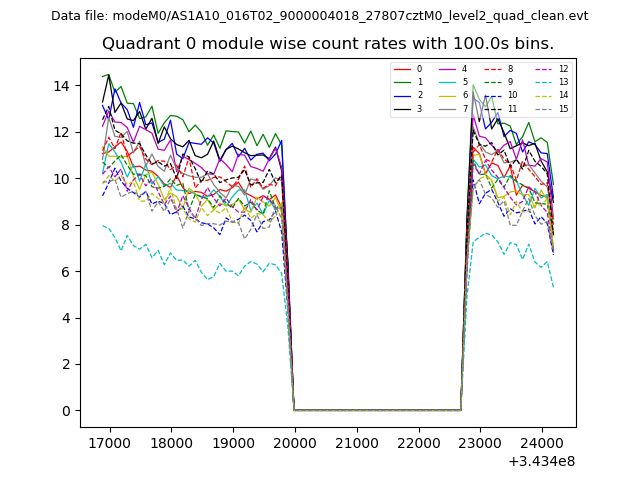
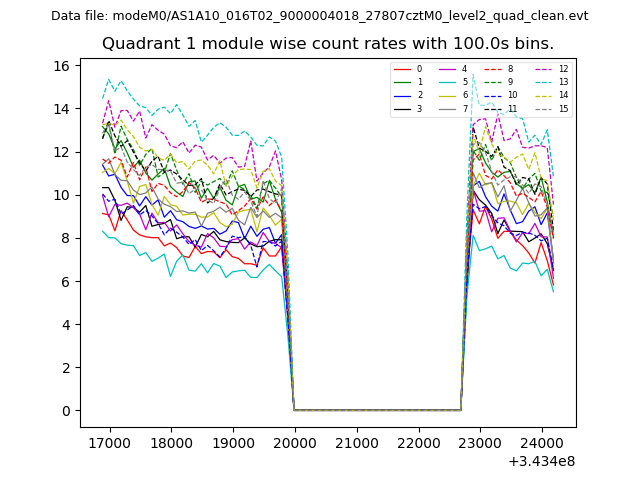
| Module-wise count rates for Quadrant A Data is divided into 100 sec bins |
 |
 |
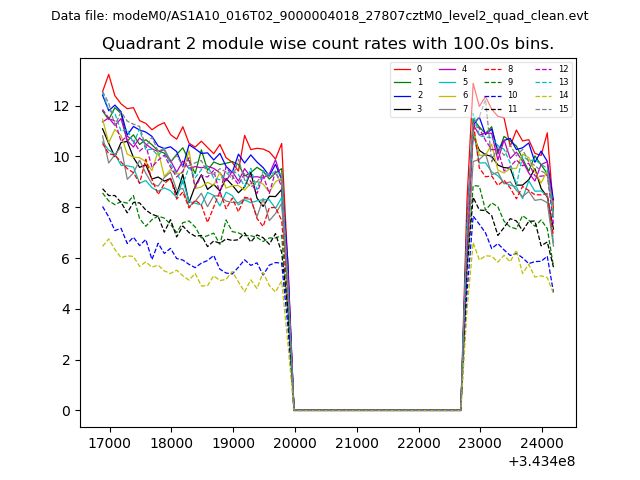
| Module-wise count rates for Quadrant B Data is divided into 100 sec bins |
 |
 |
| Module-wise count rates for Quadrant C Data is divided into 100 sec bins |
 |
 |
| Module-wise count rates for Quadrant D Data is divided into 100 sec bins |
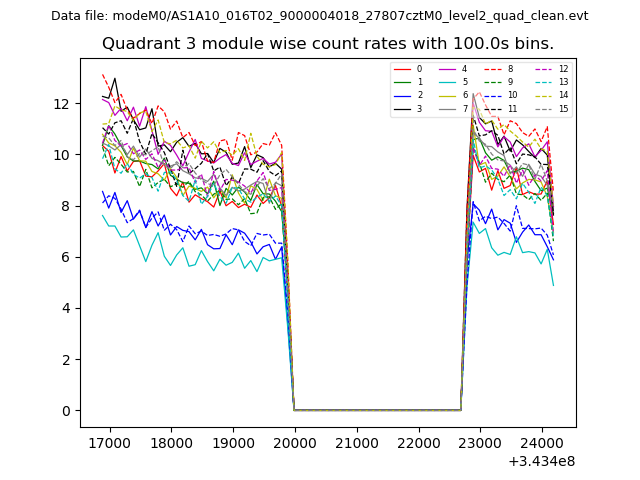 |
 |
| Parameter | Plot |
|---|---|
| CZT HV Monitor | 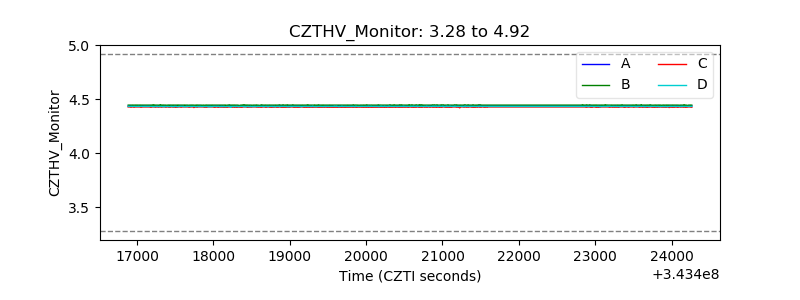 |
| D_VDD | 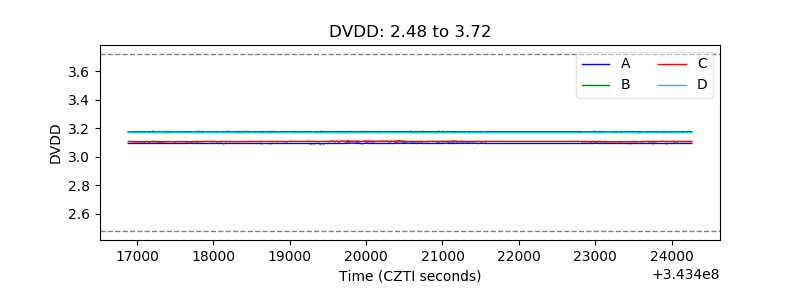 |
| Temperature 1 | 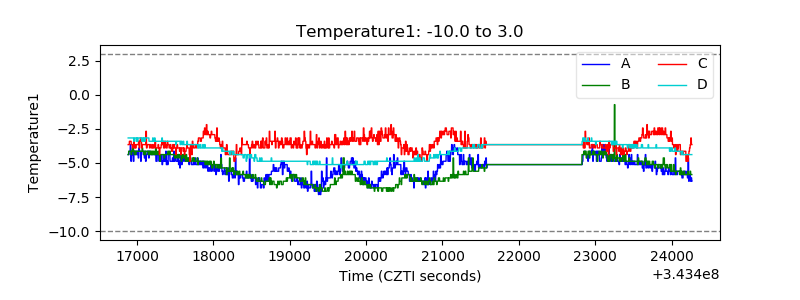 |
| Veto HV Monitor | 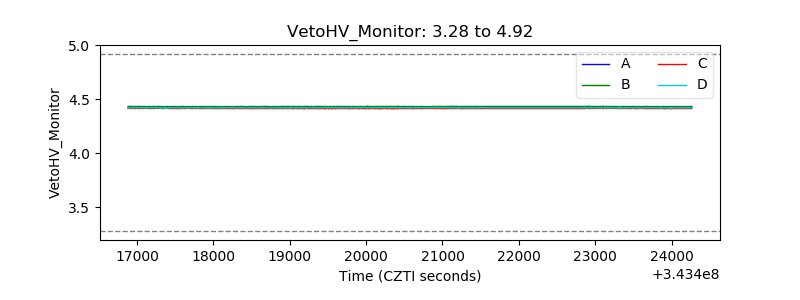 |
| Veto LLD | 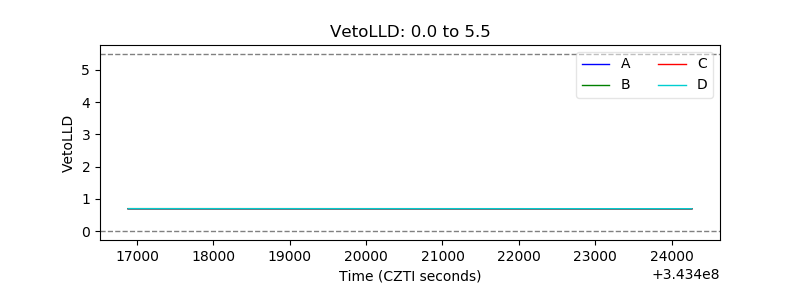 |
| Alpha Counter | 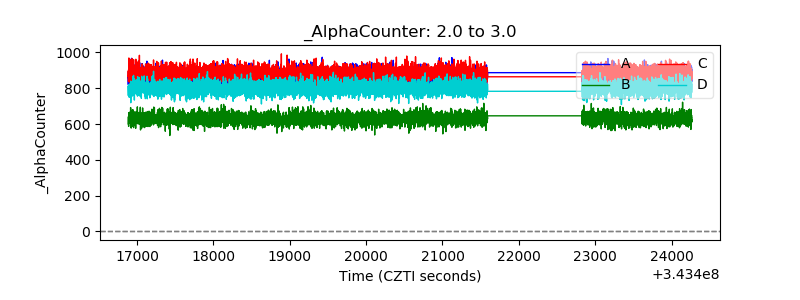 |
| _CPM_Rate | 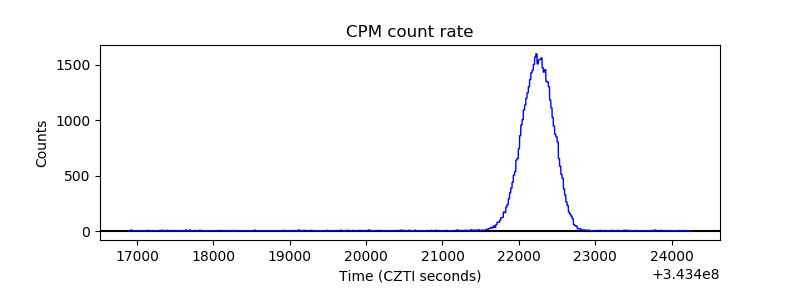 |
| CZT Counter | 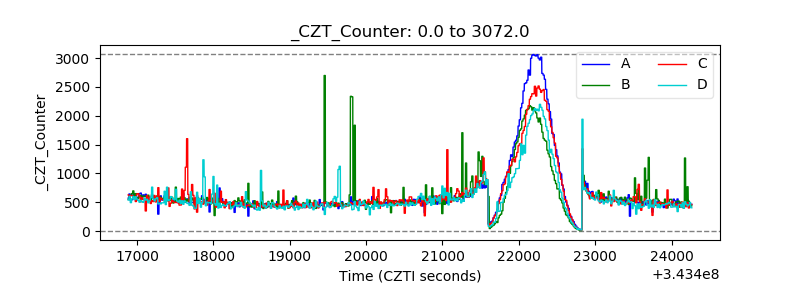 |
| +2.5 Volts monitor |  |
| +5 Volts monitor |  |
| _ROLL_ROT | 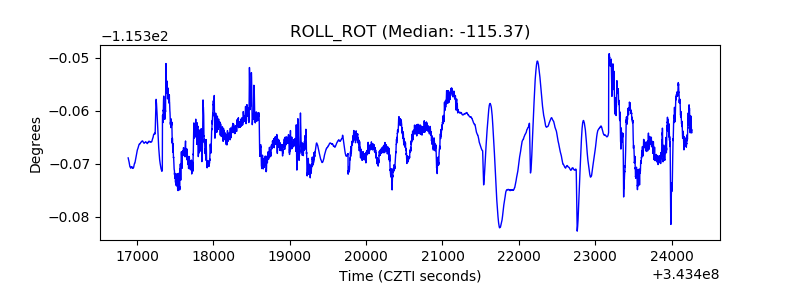 |
| _Roll_DEC | 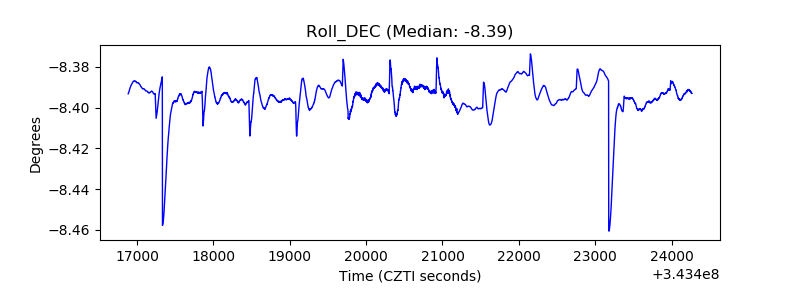 |
| _Roll_RA | 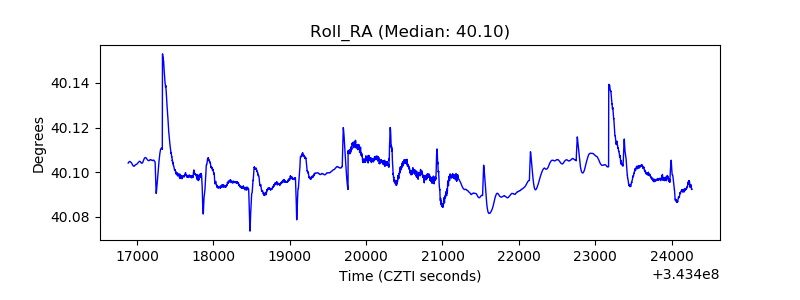 |
| Veto Counter | 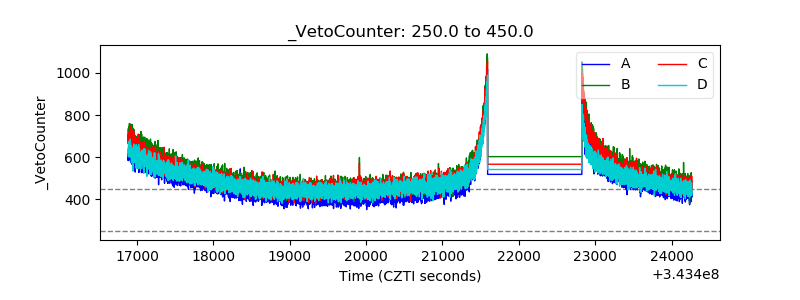 |