| Param | Original file | Final file |
|---|---|---|
| Filename | modeM0/AS1A10_016T02_9000004018_27808cztM0_level2.evt | modeM0/AS1A10_016T02_9000004018_27808cztM0_level2_quad_clean.evt |
| Size (bytes) | 468,501,120 | 99,570,240 |
| Size | 446.8 MB | 95.0 MB |
| Events in quadrant A | 3,329,010 | 667,393 |
| Events in quadrant B | 3,609,927 | 669,399 |
| Events in quadrant C | 3,385,068 | 601,678 |
| Events in quadrant D | 3,415,070 | 615,680 |
| Mode M0 | |||
|---|---|---|---|
| Quadrant | BADHDUFLAG | Total packets | Discarded packets |
| A | 0 | 13977 | 0 |
| B | 0 | 14787 | 0 |
| C | 0 | 14181 | 0 |
| D | 0 | 14586 | 0 |
| Mode M9 | |||
|---|---|---|---|
| Quadrant | BADHDUFLAG | Total packets | Discarded packets |
| A | 0 | 14 | 0 |
| B | 0 | 15 | 0 |
| C | 0 | 15 | 0 |
| D | 0 | 15 | 0 |
| Quadrant | Total seconds | Saturated seconds | Saturation percentage |
|---|---|---|---|
| A | 6618 | 76 | 1.148383% |
| B | 6617 | 147 | 2.221551% |
| C | 6617 | 140 | 2.115762% |
| D | 6617 | 93 | 1.405471% |
Noise dominated data is calculated using 1-second bins in cleaned event files. If a bin has >2000 counts, and if more than 50% of those come from <1% of pixels, then it is considered to be noise-dominated and hence unusable.
| Quadrant | # 1 sec bins | Bins with >0 counts | Bins with >2000 counts | High rate bins dominated by noise | Noise dominated (total time) | Noise dominated (detector-on time) | Marked lightcurve |
|---|---|---|---|---|---|---|---|
| A | 7733 | 6618 | 0 | 0 | 0.00% | 0.00% | 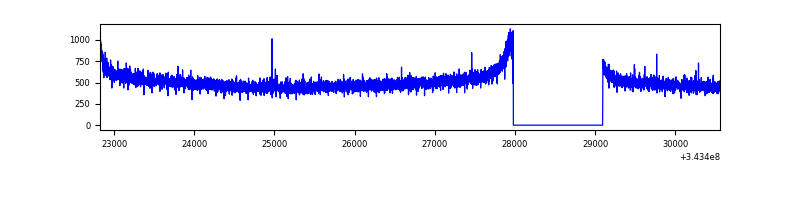 |
| B | 7732 | 6617 | 27 | 27 | 0.35% | 0.41% | 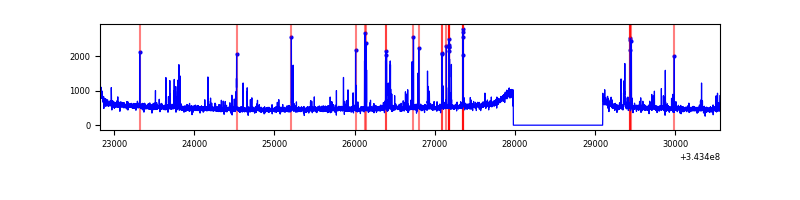 |
| C | 7732 | 6617 | 1 | 1 | 0.01% | 0.02% |  |
| D | 7732 | 6617 | 48 | 48 | 0.62% | 0.73% | 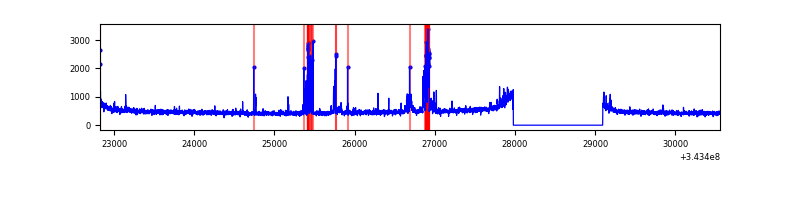 |
Top three noisy pixels from each quadrant. If the there are fewer than three noisy pixels in the level2.evt file, extra rows are filled as -1
| Pixel properties | Quadrant properties | ||||||
|---|---|---|---|---|---|---|---|
| Quadrant | DetID | PixID | Counts | Sigma | Mean | Median | Sigma |
| A | 13 | 254 | 8822 | 45.92 | 864 | 850 | 173.6 |
| A | 3 | 137 | 8052 | 41.48 | 864 | 850 | 173.6 |
| A | 0 | 226 | 7166 | 36.38 | 864 | 850 | 173.6 |
| B | 10 | 245 | 215525 | 1298.79 | 855 | 835 | 165.3 |
| B | 0 | 190 | 37985 | 224.74 | 855 | 835 | 165.3 |
| B | 12 | 111 | 20304 | 117.78 | 855 | 835 | 165.3 |
| C | 14 | 238 | 131916 | 689.66 | 809 | 817 | 190.1 |
| C | 6 | 112 | 42623 | 219.92 | 809 | 817 | 190.1 |
| C | 3 | 233 | 38493 | 198.2 | 809 | 817 | 190.1 |
| D | 1 | 52 | 325435 | 1651.24 | 820 | 801 | 196.6 |
| D | 2 | 234 | 20699 | 101.21 | 820 | 801 | 196.6 |
| D | 3 | 14 | 8065 | 36.95 | 820 | 801 | 196.6 |
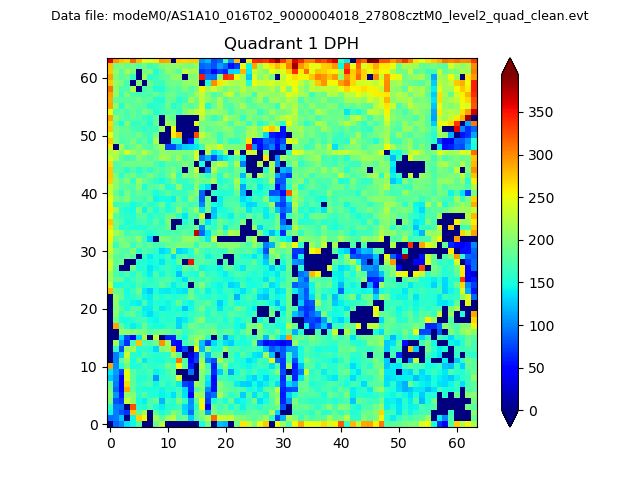
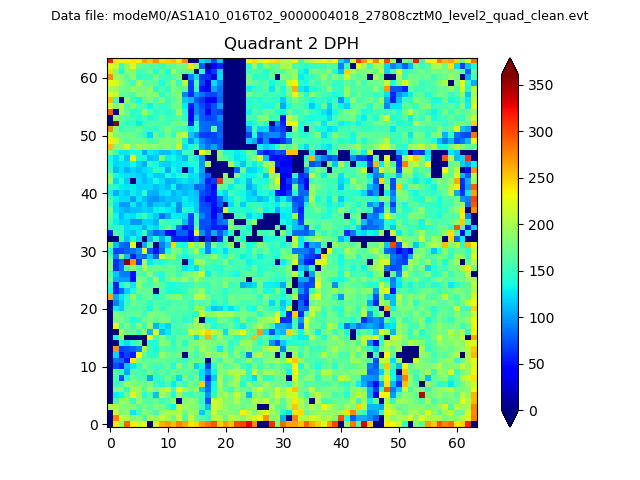
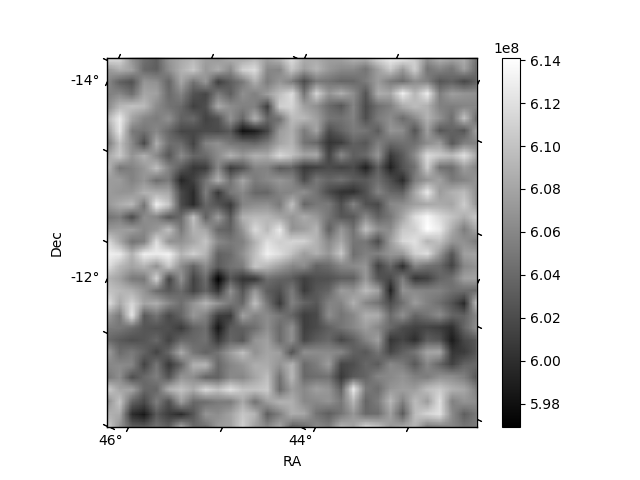
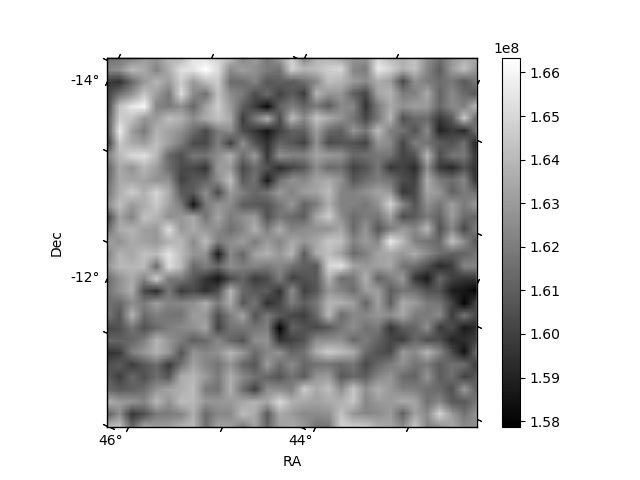
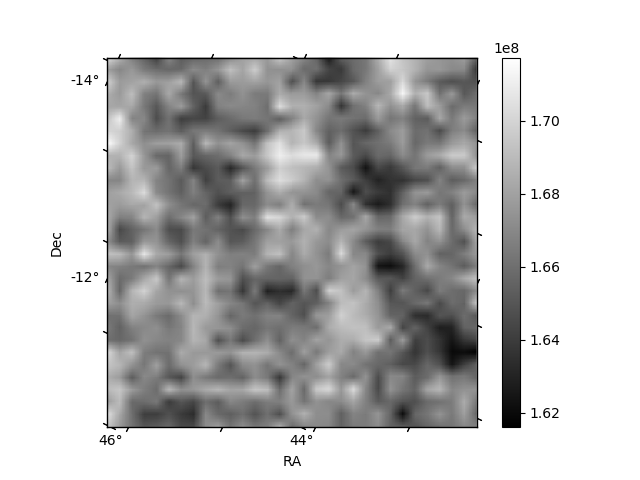
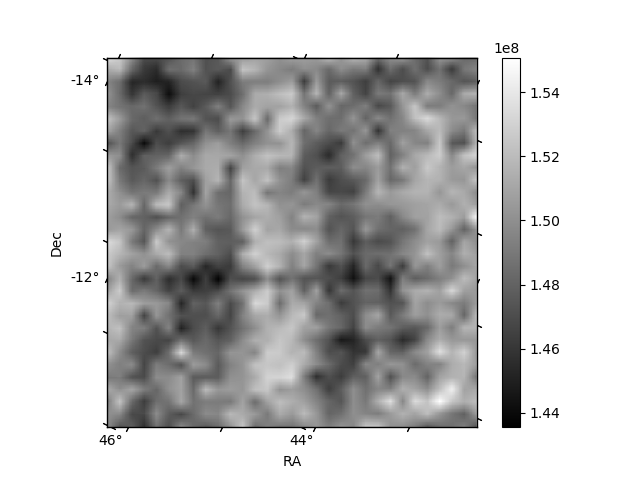
Histogram calculated using DETX and DETY for each event in the final _common_clean file
| Quadrant A | 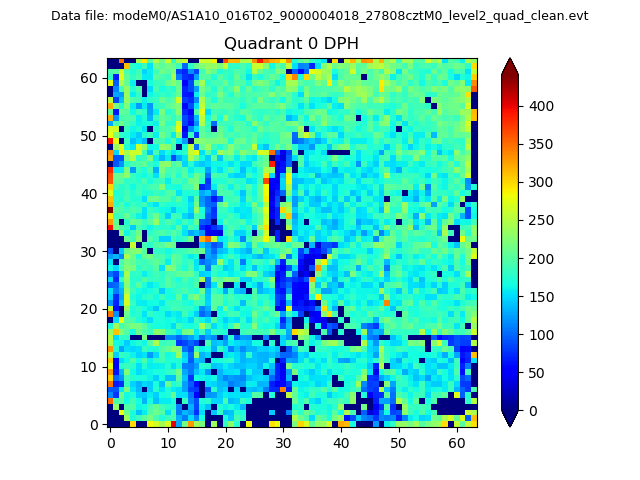 |
 |
Quadrant B |
|---|---|---|---|
| Quadrant D | 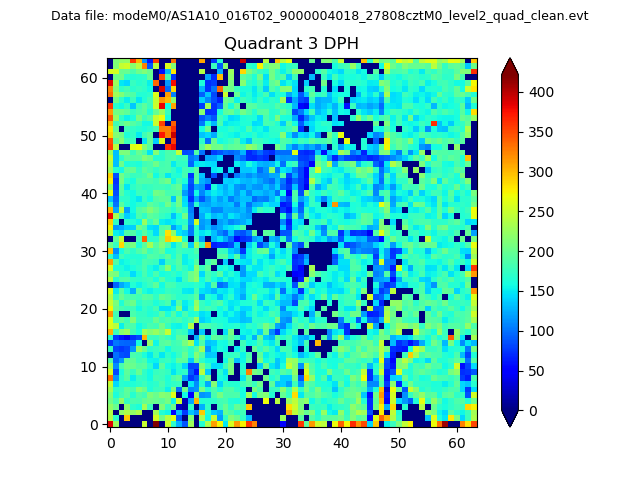 |
 |
Quadrant C |
| Plot type | Count rate plots | Images |
|---|---|---|
| Comparison with Poisson distribution Blue bars denote a histogram of data divided into 1 sec bins. Red curve is a Poisson curve with rate = median count rate of data. |
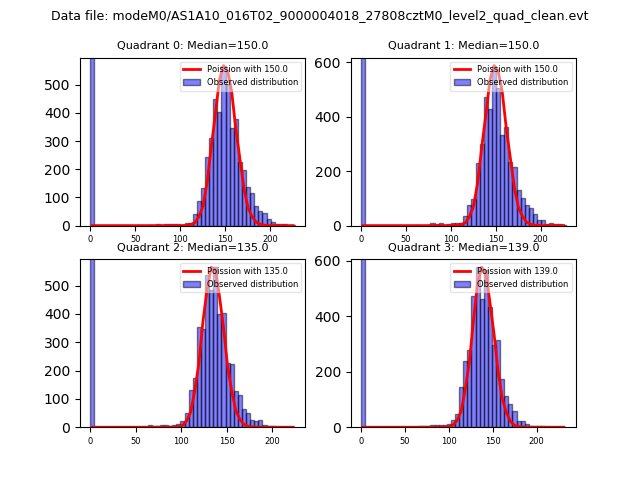 |
 |
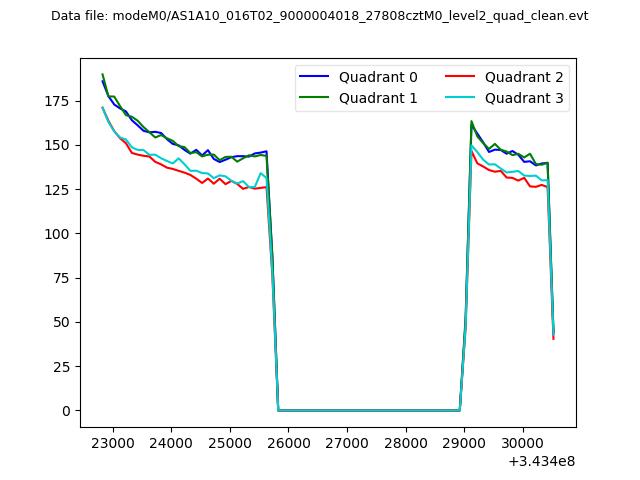
| Quadrant-wise count rates Data is divided into 100 sec bins |
 |
|
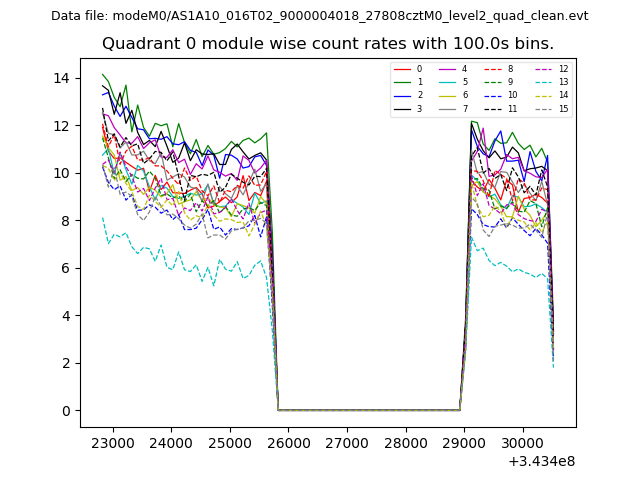
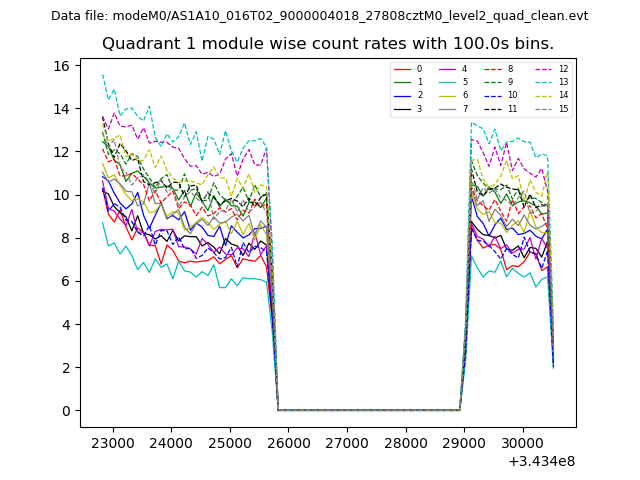
| Module-wise count rates for Quadrant A Data is divided into 100 sec bins |
 |
 |
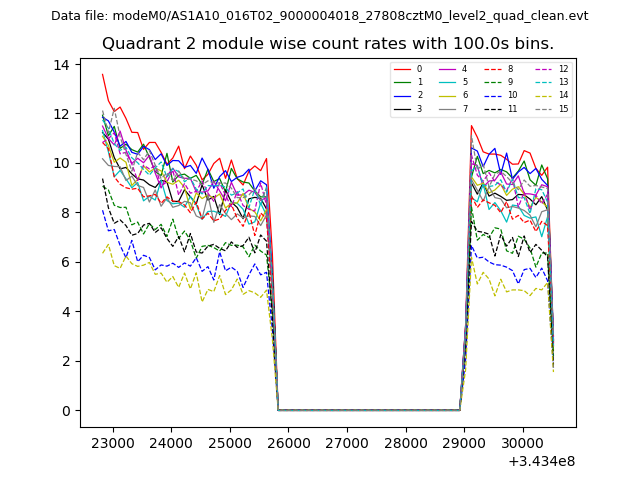
| Module-wise count rates for Quadrant B Data is divided into 100 sec bins |
 |
 |
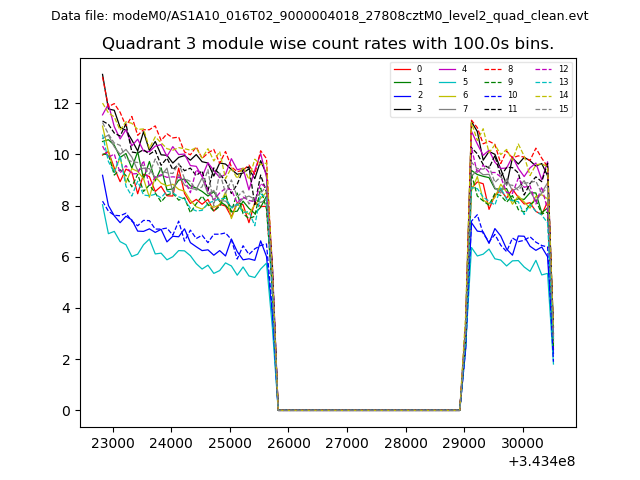
| Module-wise count rates for Quadrant C Data is divided into 100 sec bins |
 |
 |
| Module-wise count rates for Quadrant D Data is divided into 100 sec bins |
 |
 |
| Parameter | Plot |
|---|---|
| CZT HV Monitor | 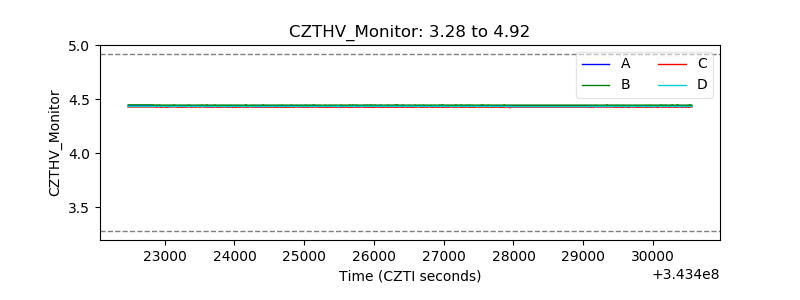 |
| D_VDD | 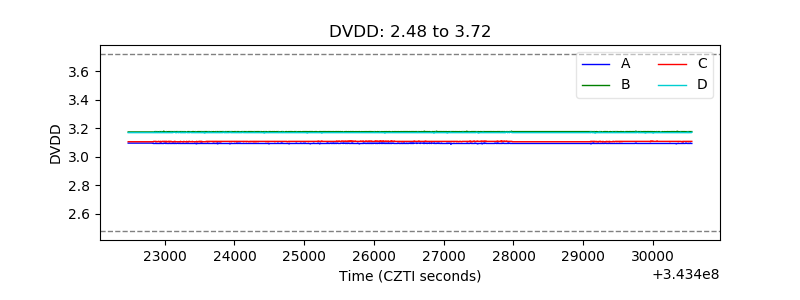 |
| Temperature 1 | 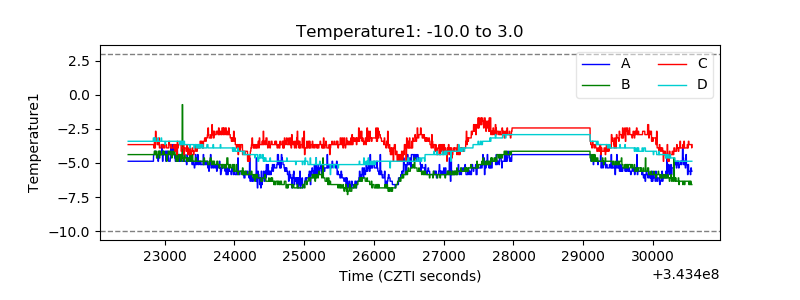 |
| Veto HV Monitor | 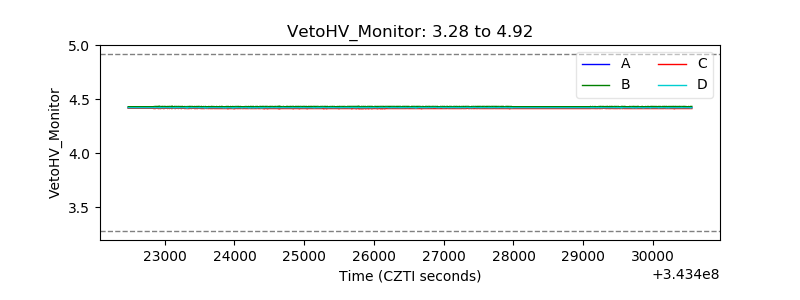 |
| Veto LLD | 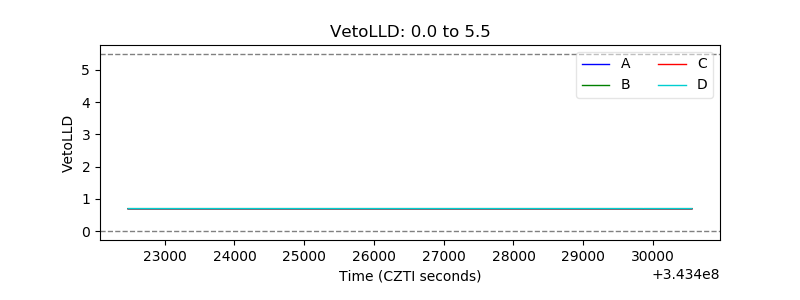 |
| Alpha Counter | 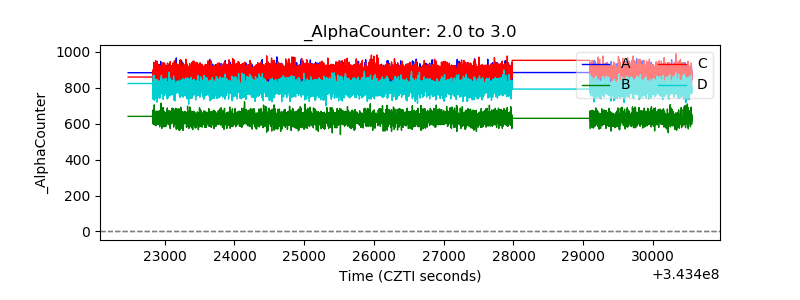 |
| _CPM_Rate | 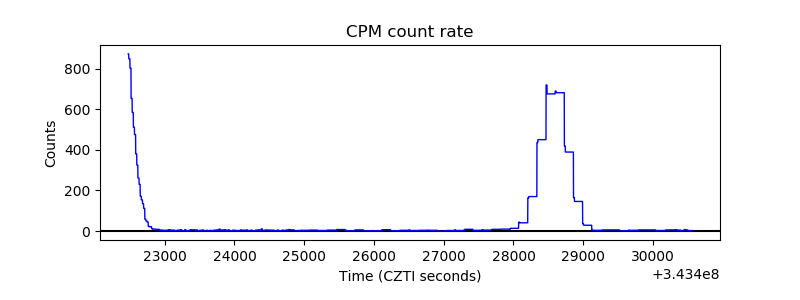 |
| CZT Counter | 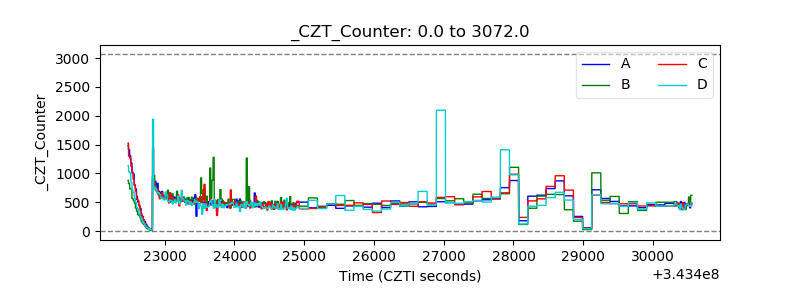 |
| +2.5 Volts monitor |  |
| +5 Volts monitor |  |
| _ROLL_ROT | 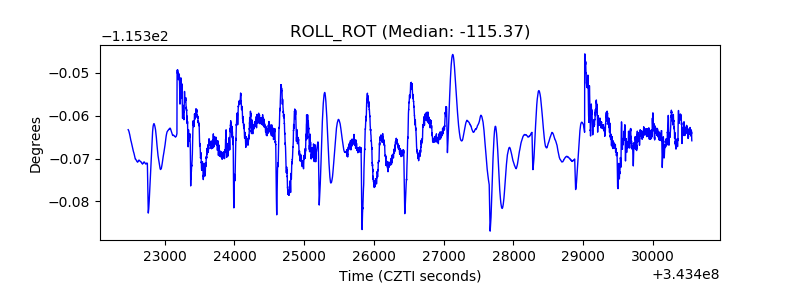 |
| _Roll_DEC | 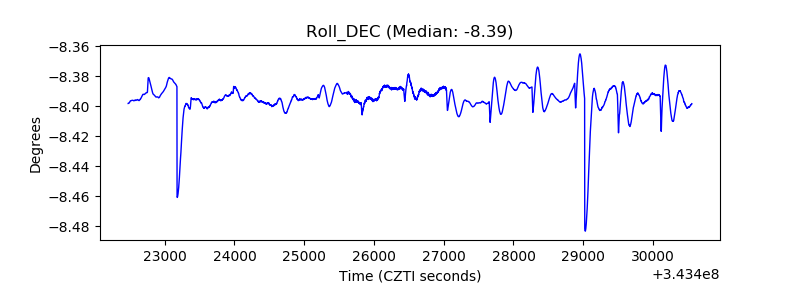 |
| _Roll_RA | 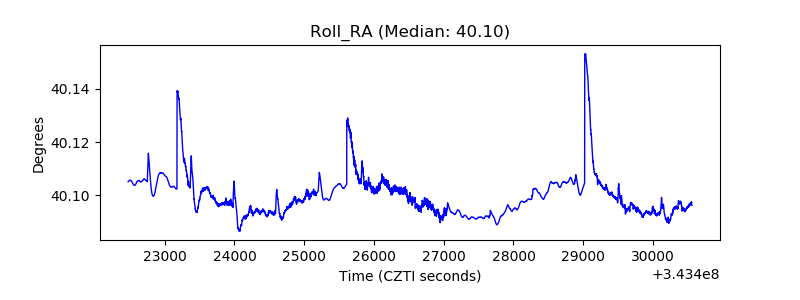 |
| Veto Counter | 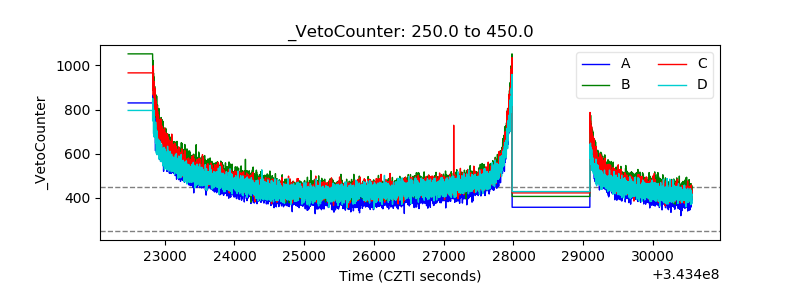 |