| Param | Original file | Final file |
|---|---|---|
| Filename | modeM0/AS1A10_016T02_9000004018_27809cztM0_level2.evt | modeM0/AS1A10_016T02_9000004018_27809cztM0_level2_quad_clean.evt |
| Size (bytes) | 452,615,040 | 95,379,840 |
| Size | 431.6 MB | 91.0 MB |
| Events in quadrant A | 3,246,459 | 628,280 |
| Events in quadrant B | 3,494,174 | 630,292 |
| Events in quadrant C | 3,300,142 | 572,527 |
| Events in quadrant D | 3,209,085 | 588,049 |
| Mode M0 | |||
|---|---|---|---|
| Quadrant | BADHDUFLAG | Total packets | Discarded packets |
| A | 0 | 13883 | 0 |
| B | 0 | 14507 | 0 |
| C | 0 | 14010 | 0 |
| D | 0 | 14133 | 0 |
| Mode M9 | |||
|---|---|---|---|
| Quadrant | BADHDUFLAG | Total packets | Discarded packets |
| A | 0 | 8 | 0 |
| B | 0 | 8 | 0 |
| C | 0 | 8 | 0 |
| D | 0 | 8 | 0 |
| Quadrant | Total seconds | Saturated seconds | Saturation percentage |
|---|---|---|---|
| A | 6726 | 48 | 0.713649% |
| B | 6727 | 95 | 1.412219% |
| C | 6727 | 85 | 1.263565% |
| D | 6727 | 47 | 0.698677% |
Noise dominated data is calculated using 1-second bins in cleaned event files. If a bin has >2000 counts, and if more than 50% of those come from <1% of pixels, then it is considered to be noise-dominated and hence unusable.
| Quadrant | # 1 sec bins | Bins with >0 counts | Bins with >2000 counts | High rate bins dominated by noise | Noise dominated (total time) | Noise dominated (detector-on time) | Marked lightcurve |
|---|---|---|---|---|---|---|---|
| A | 7517 | 6726 | 0 | 0 | 0.00% | 0.00% | 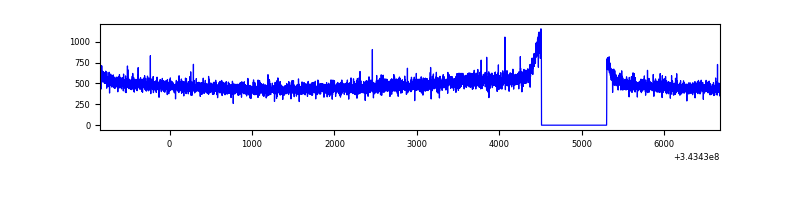 |
| B | 7518 | 6728 | 18 | 18 | 0.24% | 0.27% | 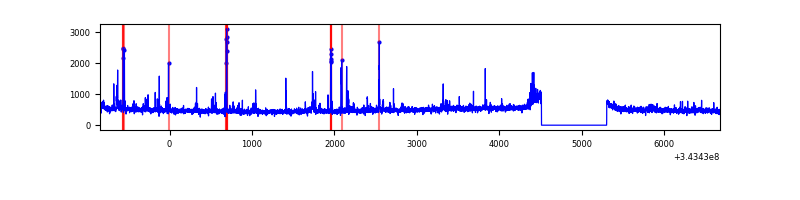 |
| C | 7518 | 6727 | 2 | 2 | 0.03% | 0.03% | 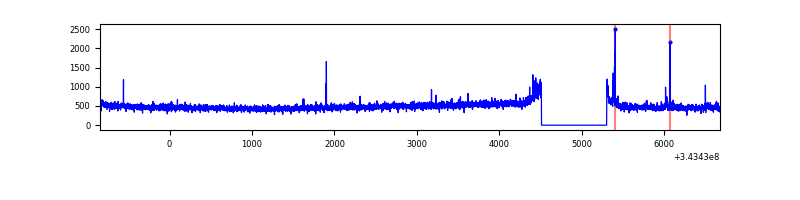 |
| D | 7518 | 6728 | 19 | 19 | 0.25% | 0.28% | 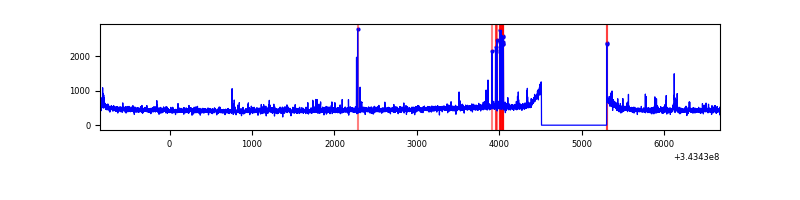 |
Top three noisy pixels from each quadrant. If the there are fewer than three noisy pixels in the level2.evt file, extra rows are filled as -1
| Pixel properties | Quadrant properties | ||||||
|---|---|---|---|---|---|---|---|
| Quadrant | DetID | PixID | Counts | Sigma | Mean | Median | Sigma |
| A | 13 | 254 | 10507 | 56.71 | 842 | 825 | 170.7 |
| A | 3 | 137 | 8071 | 42.44 | 842 | 825 | 170.7 |
| A | 0 | 226 | 6889 | 35.52 | 842 | 825 | 170.7 |
| B | 10 | 245 | 189653 | 1171.17 | 832 | 812 | 161.2 |
| B | 0 | 190 | 23569 | 141.14 | 832 | 812 | 161.2 |
| B | 12 | 111 | 20041 | 119.26 | 832 | 812 | 161.2 |
| C | 14 | 238 | 126392 | 674.76 | 792 | 800 | 186.1 |
| C | 3 | 233 | 57182 | 302.92 | 792 | 800 | 186.1 |
| C | 10 | 22 | 19179 | 98.74 | 792 | 800 | 186.1 |
| D | 1 | 52 | 160904 | 824.99 | 808 | 786 | 194.1 |
| D | 2 | 234 | 25216 | 125.87 | 808 | 786 | 194.1 |
| D | 14 | 226 | 7756 | 35.91 | 808 | 786 | 194.1 |
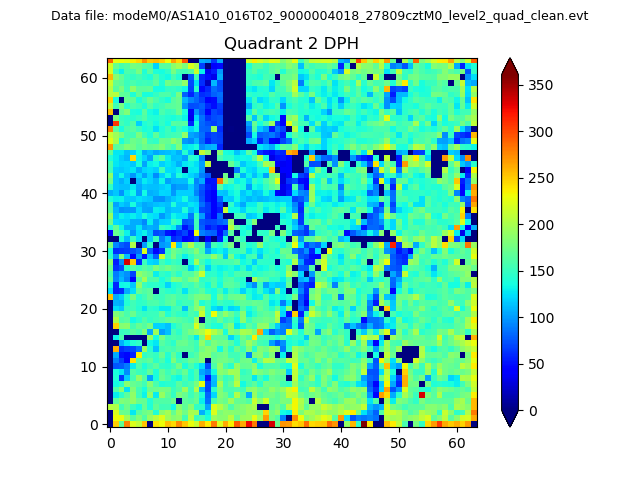
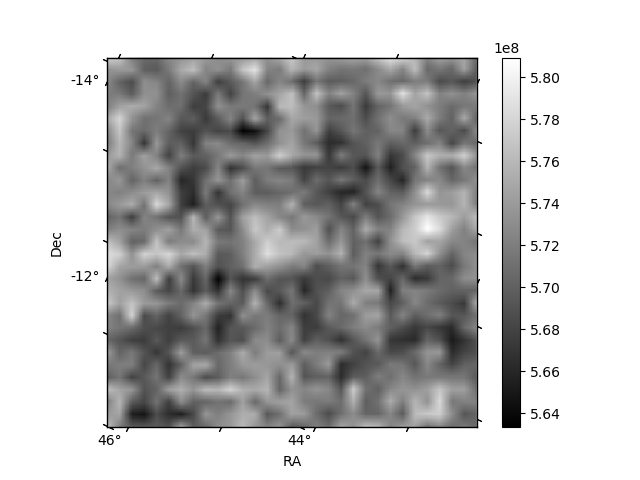
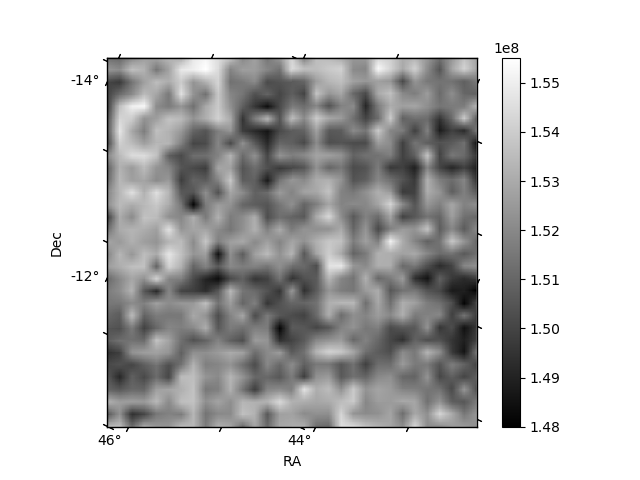
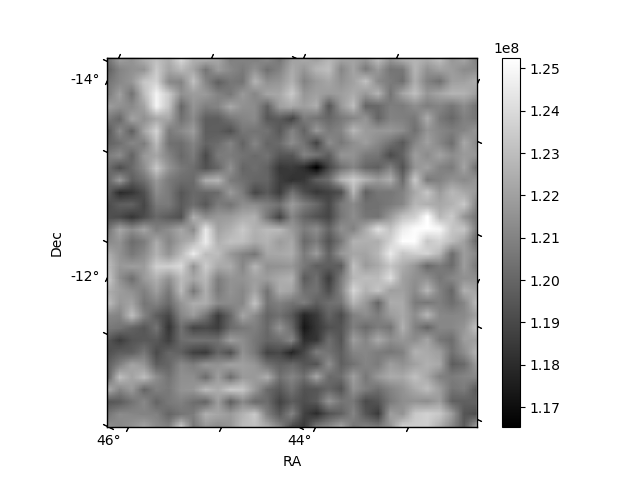
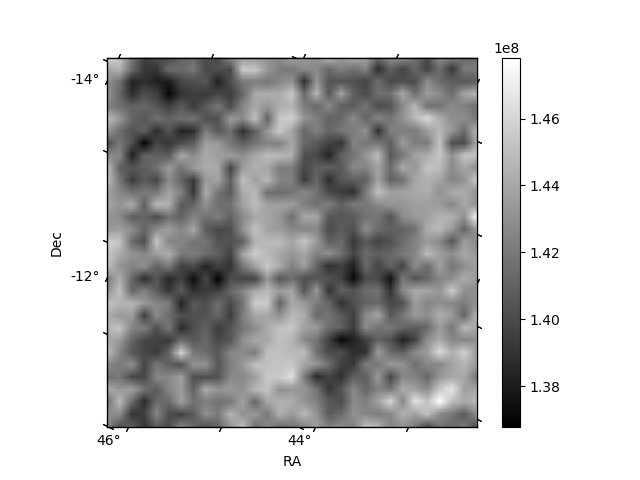
Histogram calculated using DETX and DETY for each event in the final _common_clean file
| Quadrant A | 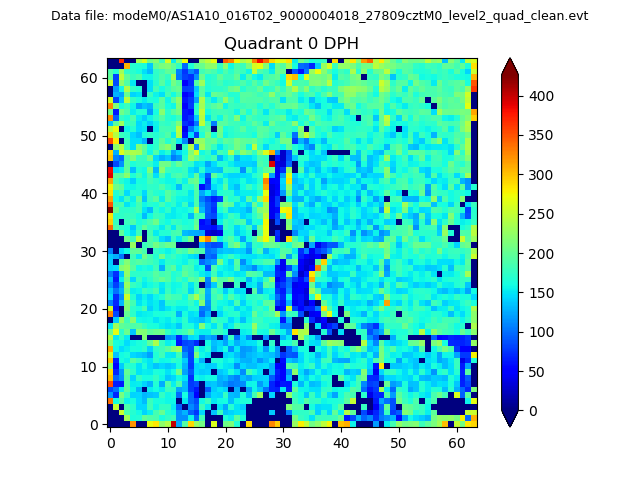 |
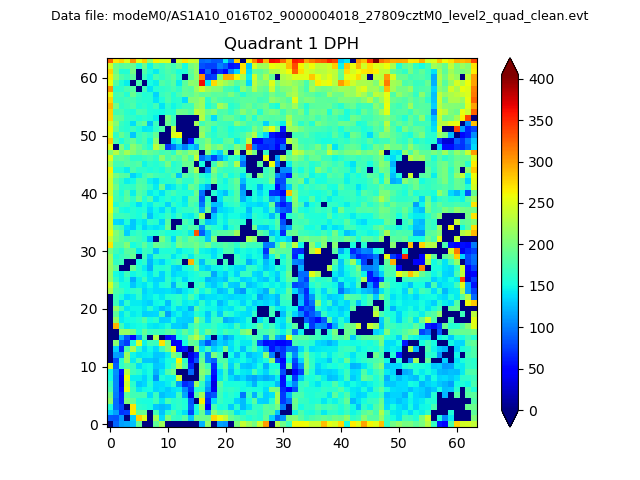 |
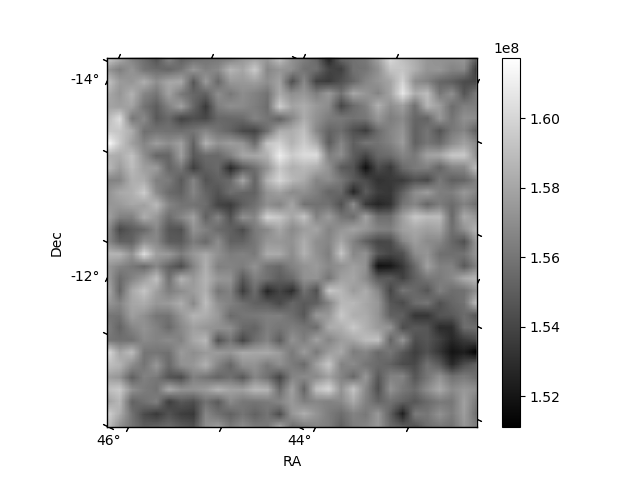
Quadrant B |
|---|---|---|---|
| Quadrant D | 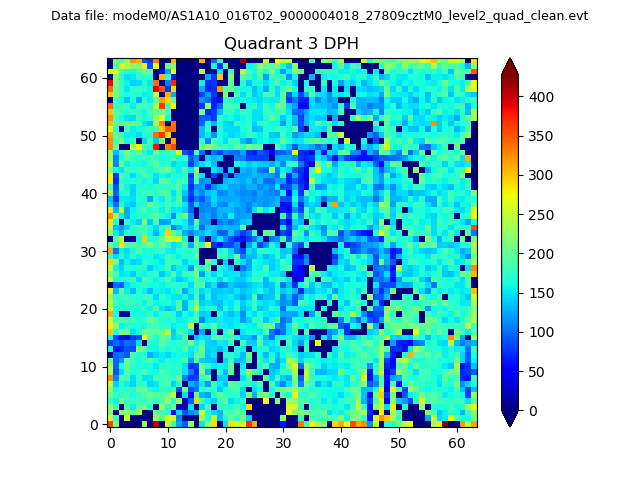 |
 |
Quadrant C |
| Plot type | Count rate plots | Images |
|---|---|---|
| Comparison with Poisson distribution Blue bars denote a histogram of data divided into 1 sec bins. Red curve is a Poisson curve with rate = median count rate of data. |
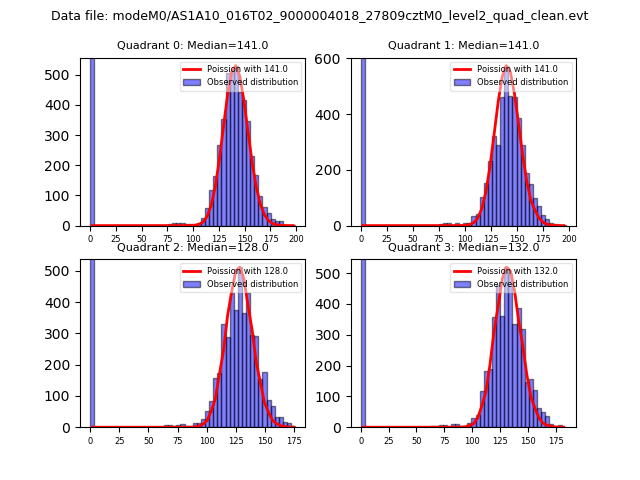 |
 |
| Quadrant-wise count rates Data is divided into 100 sec bins |
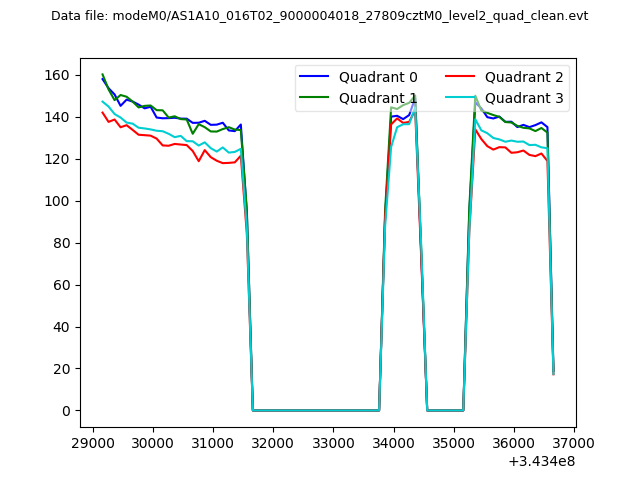 |
|
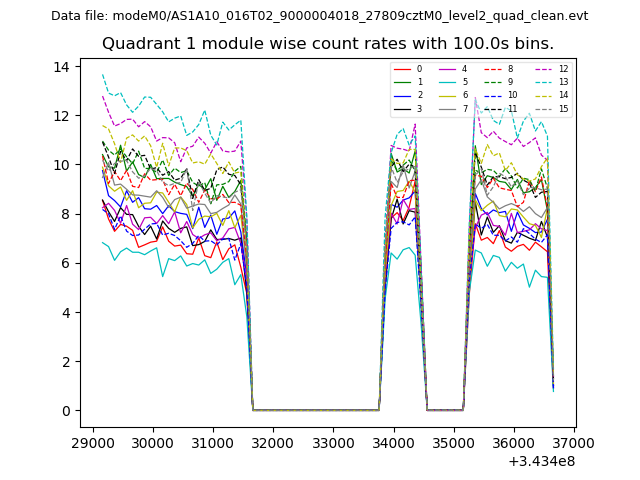
| Module-wise count rates for Quadrant A Data is divided into 100 sec bins |
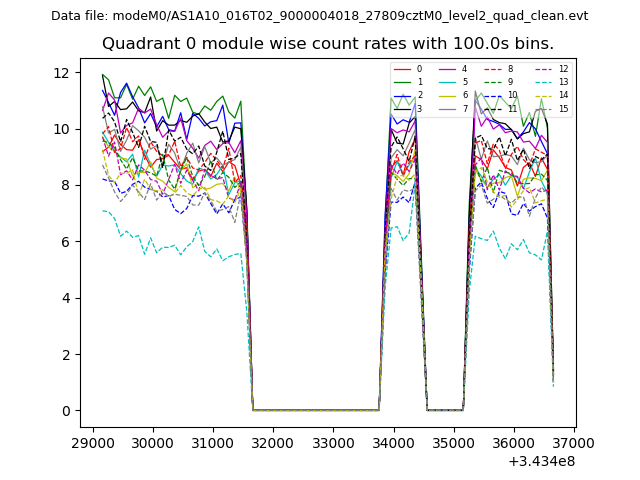 |
 |
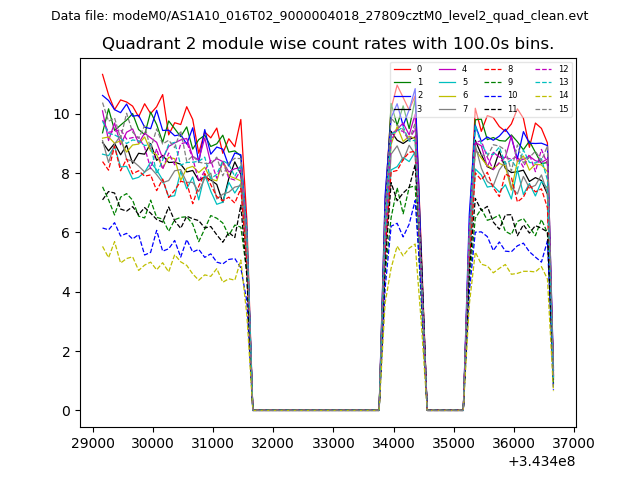
| Module-wise count rates for Quadrant B Data is divided into 100 sec bins |
 |
 |
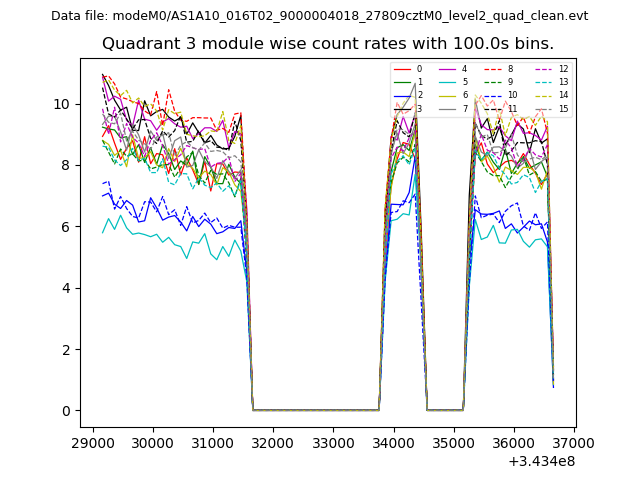
| Module-wise count rates for Quadrant C Data is divided into 100 sec bins |
 |
 |
| Module-wise count rates for Quadrant D Data is divided into 100 sec bins |
 |
 |
| Parameter | Plot |
|---|---|
| CZT HV Monitor | 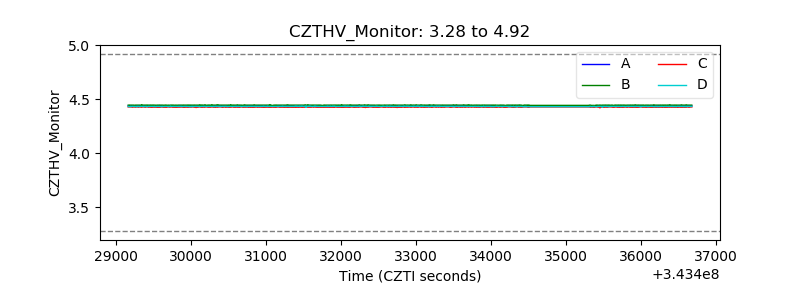 |
| D_VDD | 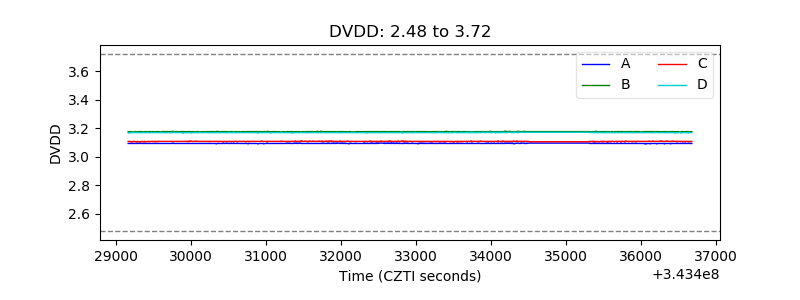 |
| Temperature 1 | 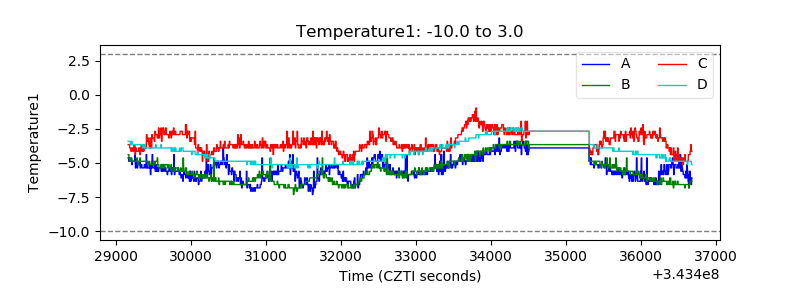 |
| Veto HV Monitor | 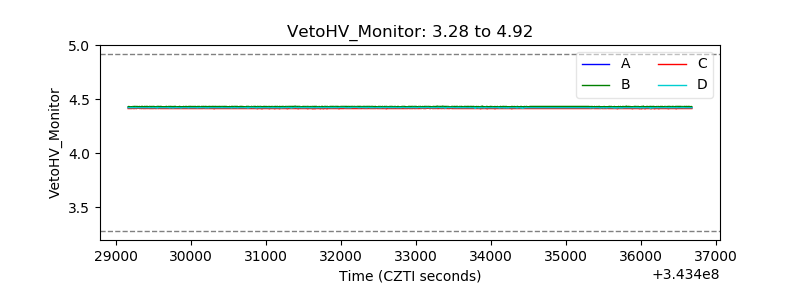 |
| Veto LLD | 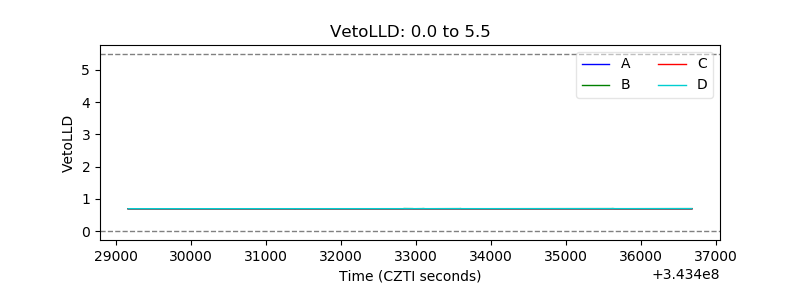 |
| Alpha Counter | 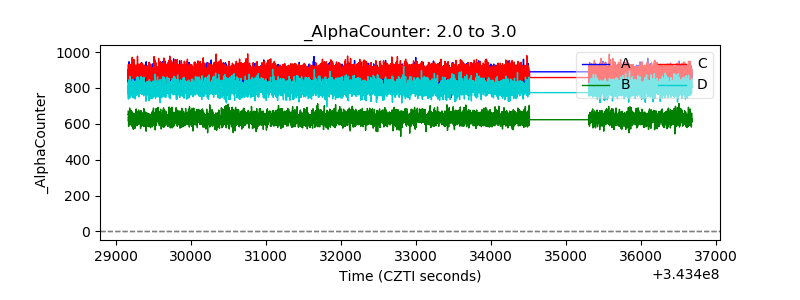 |
| _CPM_Rate | 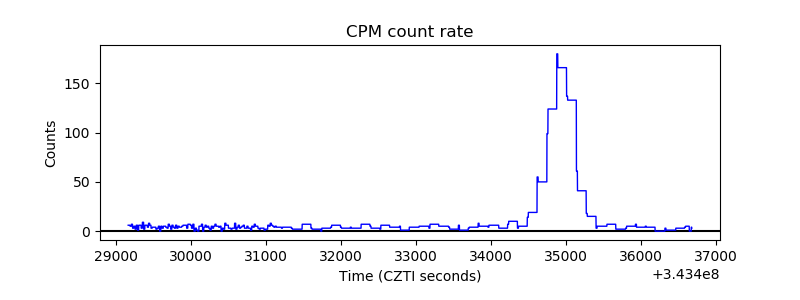 |
| CZT Counter | 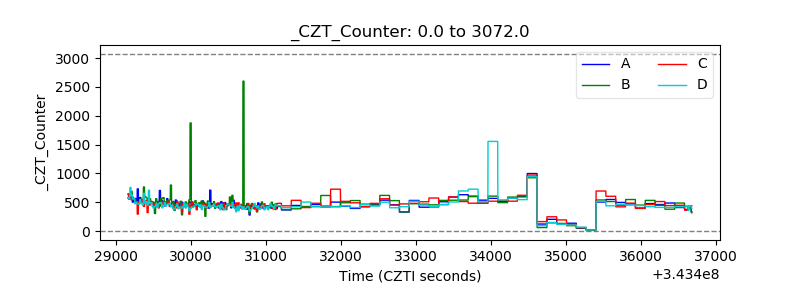 |
| +2.5 Volts monitor | 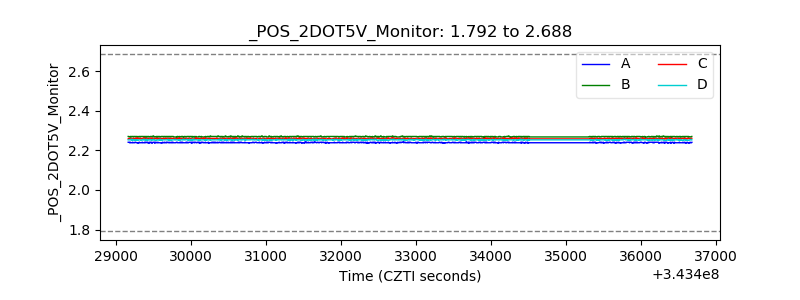 |
| +5 Volts monitor |  |
| _ROLL_ROT | 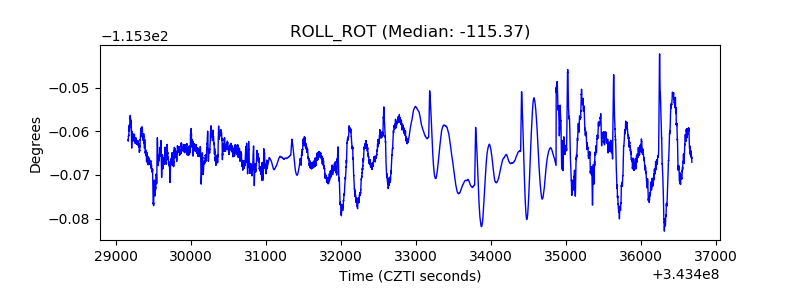 |
| _Roll_DEC | 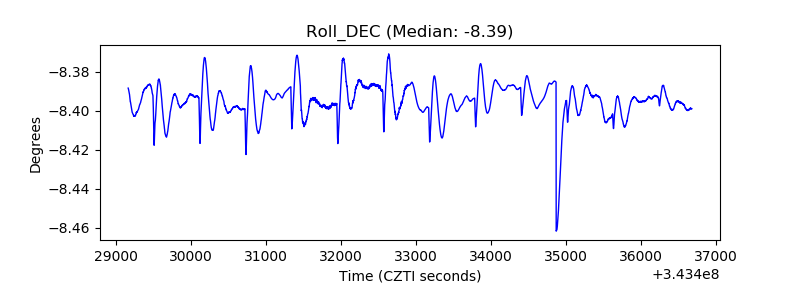 |
| _Roll_RA | 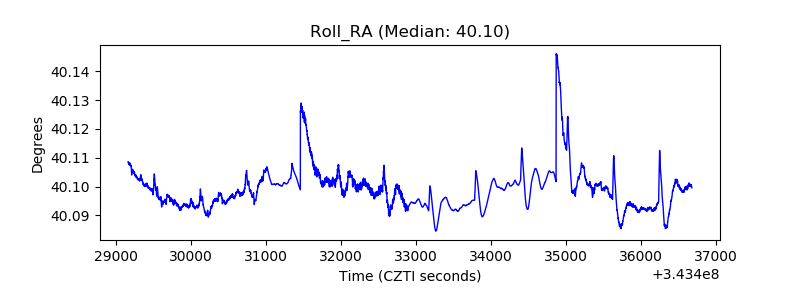 |
| Veto Counter | 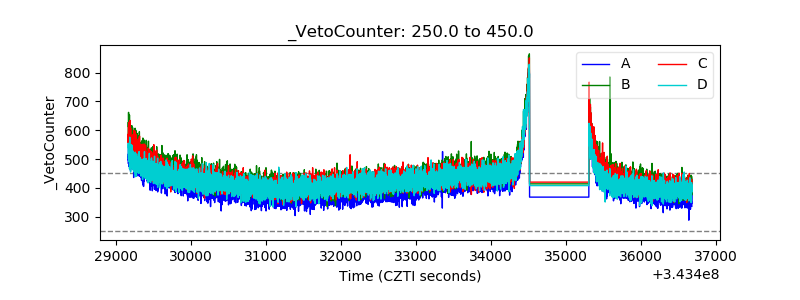 |