| Param | Original file | Final file |
|---|---|---|
| Filename | modeM0/AS1A10_016T02_9000004018_27810cztM0_level2.evt | modeM0/AS1A10_016T02_9000004018_27810cztM0_level2_quad_clean.evt |
| Size (bytes) | 521,496,000 | 106,536,960 |
| Size | 497.3 MB | 101.6 MB |
| Events in quadrant A | 3,551,149 | 709,596 |
| Events in quadrant B | 4,085,459 | 701,348 |
| Events in quadrant C | 3,752,740 | 645,878 |
| Events in quadrant D | 3,901,344 | 654,213 |
| Mode M0 | |||
|---|---|---|---|
| Quadrant | BADHDUFLAG | Total packets | Discarded packets |
| A | 0 | 15316 | 0 |
| B | 0 | 16765 | 0 |
| C | 0 | 15743 | 0 |
| D | 0 | 16765 | 0 |
| Mode M9 | |||
|---|---|---|---|
| Quadrant | BADHDUFLAG | Total packets | Discarded packets |
| A | 0 | 12 | 0 |
| B | 0 | 12 | 0 |
| C | 0 | 12 | 0 |
| D | 0 | 12 | 0 |
| Quadrant | Total seconds | Saturated seconds | Saturation percentage |
|---|---|---|---|
| A | 7406 | 61 | 0.823656% |
| B | 7405 | 182 | 2.457799% |
| C | 7405 | 132 | 1.782579% |
| D | 7406 | 164 | 2.214421% |
Noise dominated data is calculated using 1-second bins in cleaned event files. If a bin has >2000 counts, and if more than 50% of those come from <1% of pixels, then it is considered to be noise-dominated and hence unusable.
| Quadrant | # 1 sec bins | Bins with >0 counts | Bins with >2000 counts | High rate bins dominated by noise | Noise dominated (total time) | Noise dominated (detector-on time) | Marked lightcurve |
|---|---|---|---|---|---|---|---|
| A | 8632 | 7407 | 0 | 0 | 0.00% | 0.00% | 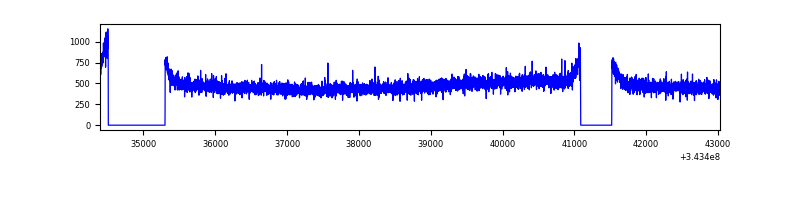 |
| B | 8631 | 7406 | 71 | 71 | 0.82% | 0.96% | 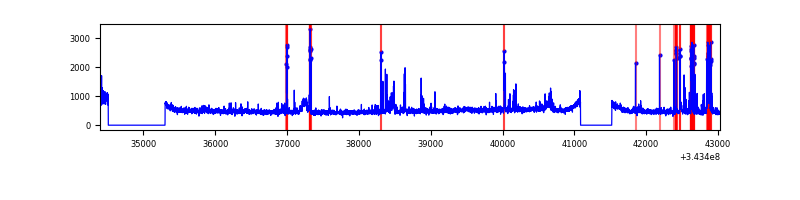 |
| C | 8631 | 7406 | 2 | 2 | 0.02% | 0.03% |  |
| D | 8632 | 7408 | 100 | 100 | 1.16% | 1.35% | 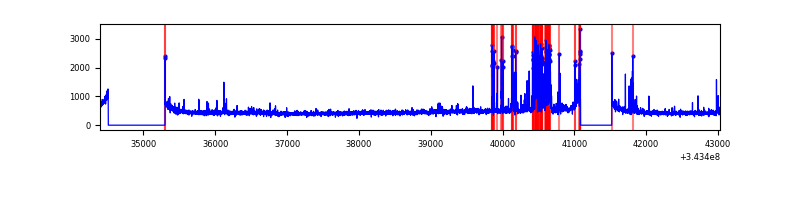 |
Top three noisy pixels from each quadrant. If the there are fewer than three noisy pixels in the level2.evt file, extra rows are filled as -1
| Pixel properties | Quadrant properties | ||||||
|---|---|---|---|---|---|---|---|
| Quadrant | DetID | PixID | Counts | Sigma | Mean | Median | Sigma |
| A | 13 | 254 | 11689 | 57.54 | 921 | 904 | 187.4 |
| A | 3 | 137 | 9104 | 43.75 | 921 | 904 | 187.4 |
| A | 0 | 226 | 7470 | 35.03 | 921 | 904 | 187.4 |
| B | 10 | 245 | 466159 | 2613.59 | 908 | 882 | 178.0 |
| B | 3 | 64 | 25664 | 139.21 | 908 | 882 | 178.0 |
| B | 0 | 190 | 25424 | 137.86 | 908 | 882 | 178.0 |
| C | 3 | 233 | 205282 | 988.9 | 870 | 875 | 206.7 |
| C | 14 | 238 | 137541 | 661.17 | 870 | 875 | 206.7 |
| C | 10 | 22 | 16846 | 77.27 | 870 | 875 | 206.7 |
| D | 1 | 52 | 562469 | 2619.54 | 883 | 858 | 214.4 |
| D | 2 | 234 | 32191 | 146.15 | 883 | 858 | 214.4 |
| D | 3 | 14 | 9271 | 39.24 | 883 | 858 | 214.4 |
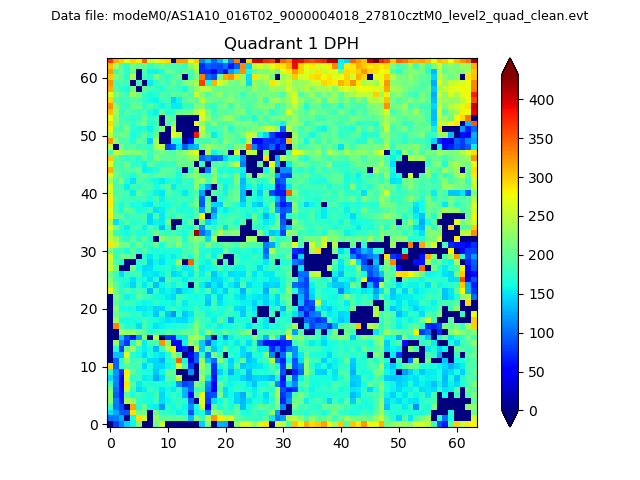
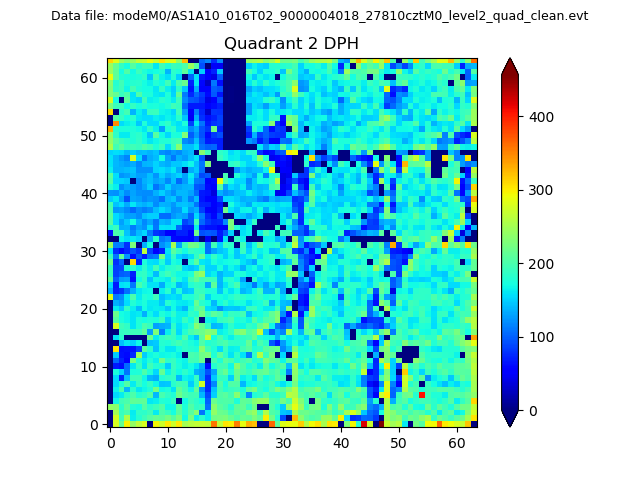
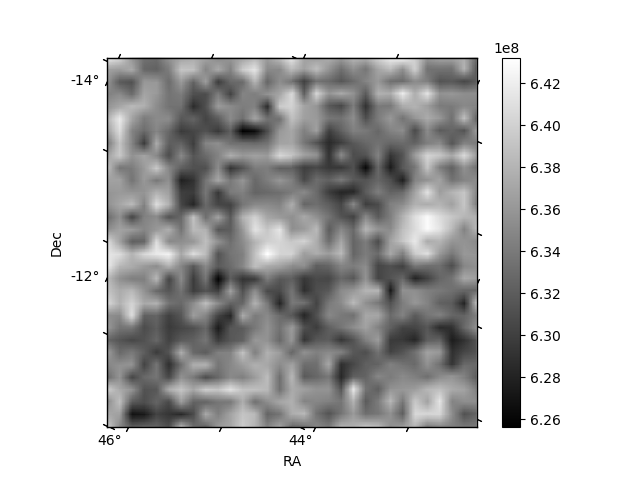
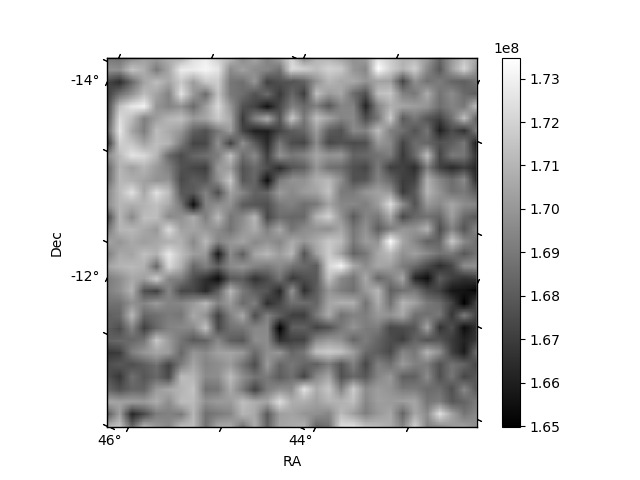
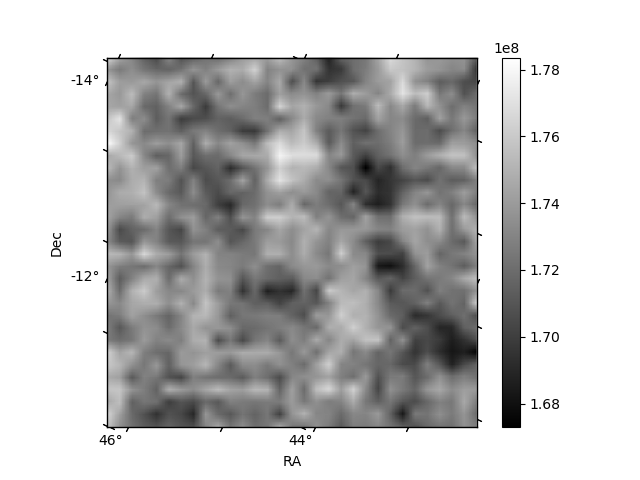
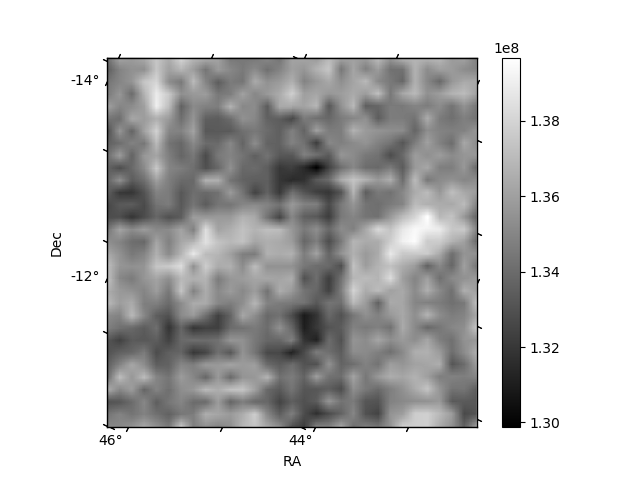
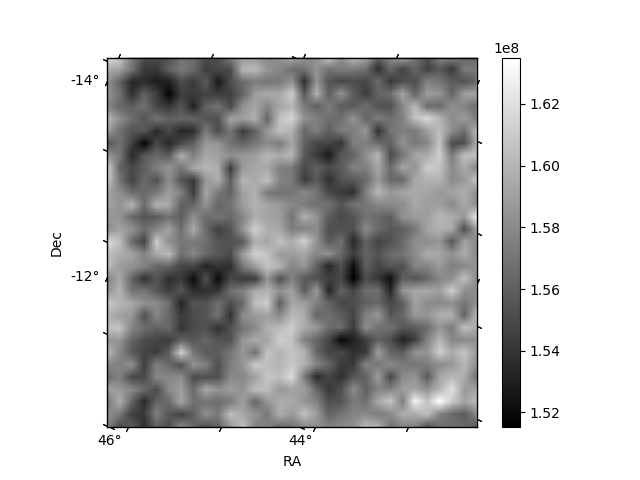
Histogram calculated using DETX and DETY for each event in the final _common_clean file
| Quadrant A | 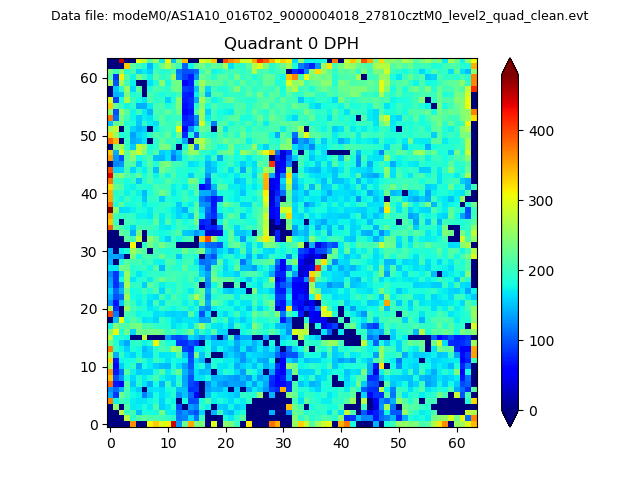 |
 |
Quadrant B |
|---|---|---|---|
| Quadrant D | 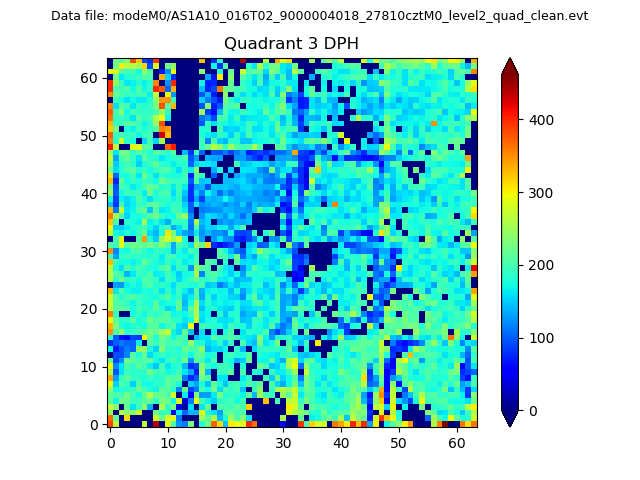 |
 |
Quadrant C |
| Plot type | Count rate plots | Images |
|---|---|---|
| Comparison with Poisson distribution Blue bars denote a histogram of data divided into 1 sec bins. Red curve is a Poisson curve with rate = median count rate of data. |
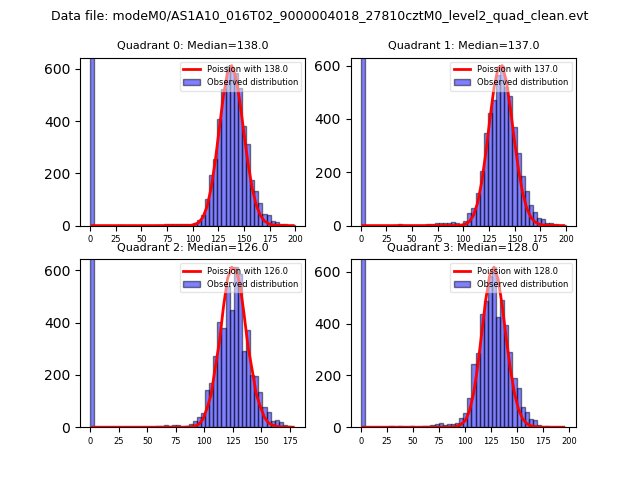 |
 |
| Quadrant-wise count rates Data is divided into 100 sec bins |
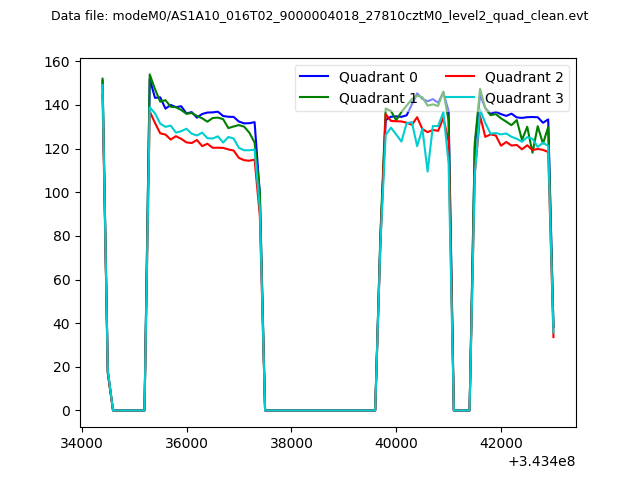 |
|
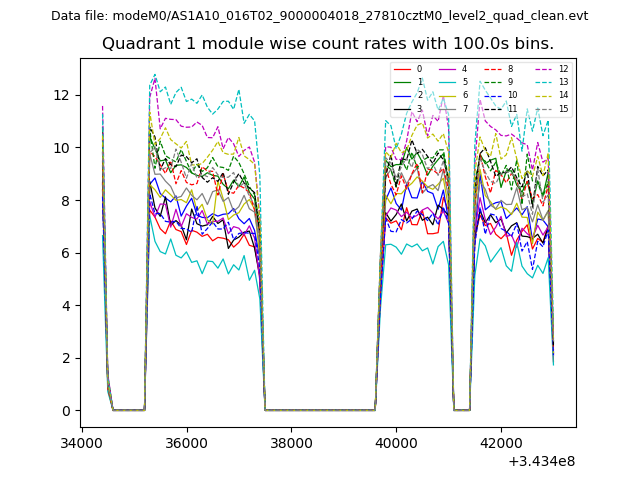
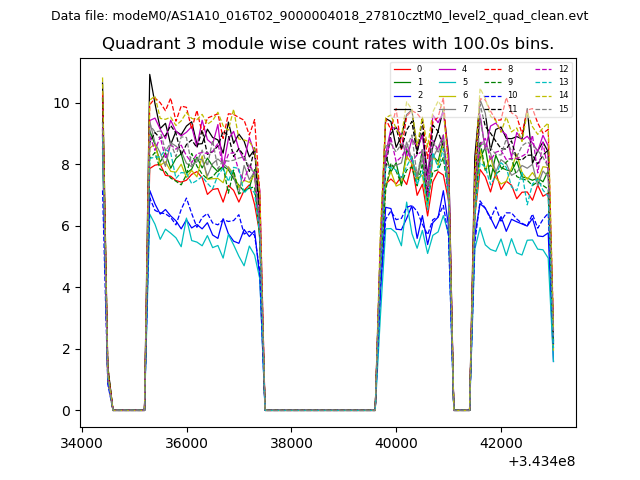
| Module-wise count rates for Quadrant A Data is divided into 100 sec bins |
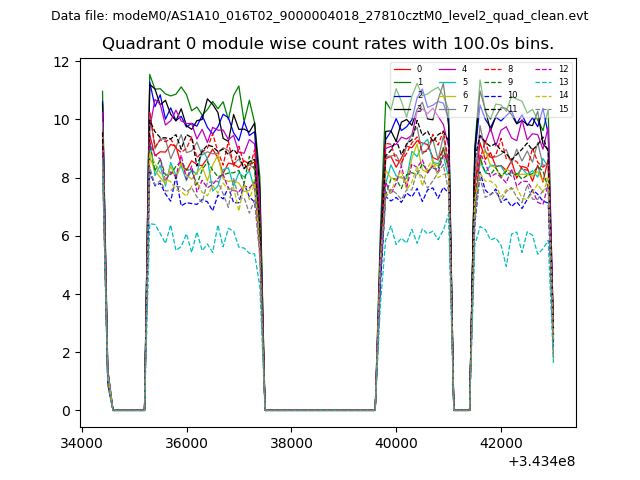 |
 |
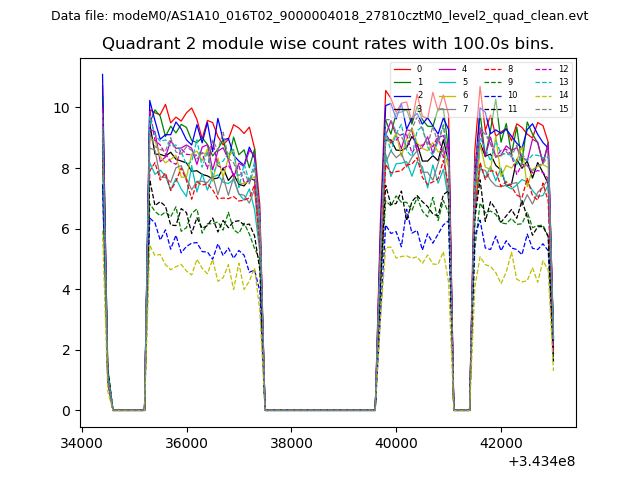
| Module-wise count rates for Quadrant B Data is divided into 100 sec bins |
 |
 |
| Module-wise count rates for Quadrant C Data is divided into 100 sec bins |
 |
 |
| Module-wise count rates for Quadrant D Data is divided into 100 sec bins |
 |
 |
| Parameter | Plot |
|---|---|
| CZT HV Monitor | 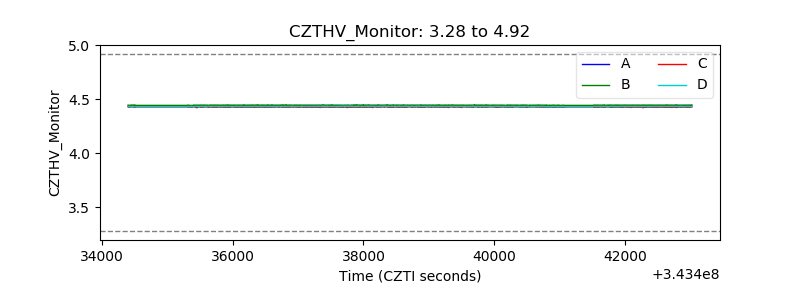 |
| D_VDD | 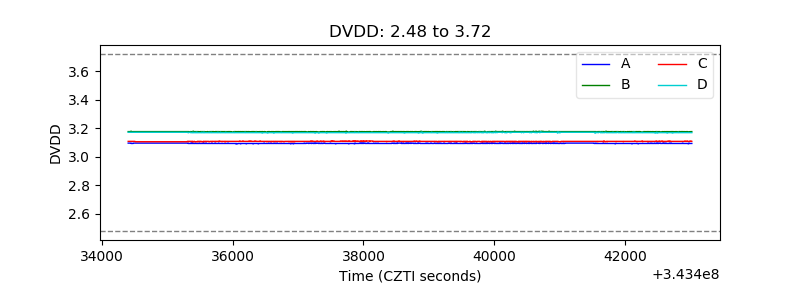 |
| Temperature 1 | 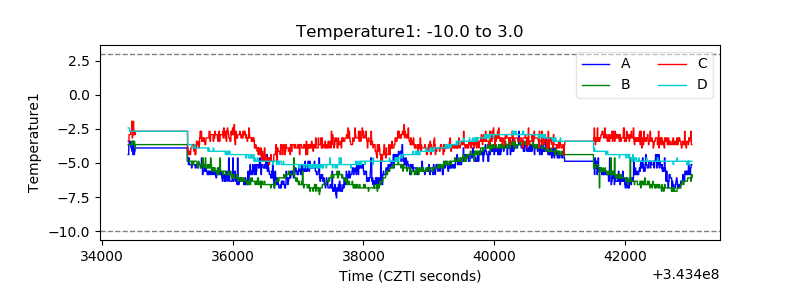 |
| Veto HV Monitor | 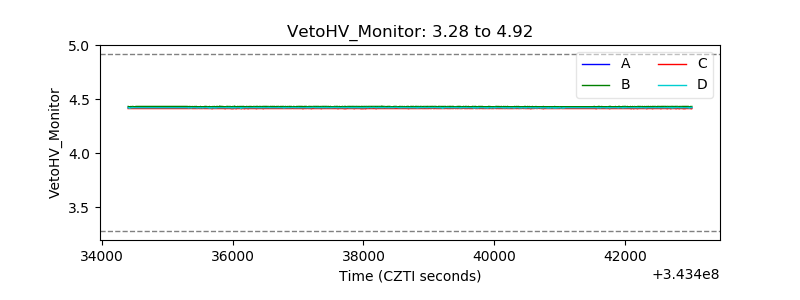 |
| Veto LLD |  |
| Alpha Counter | 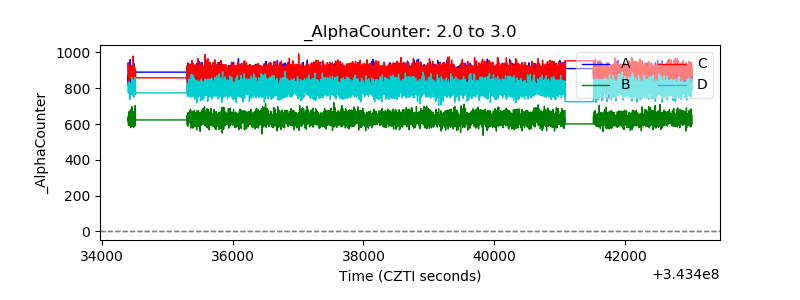 |
| _CPM_Rate | 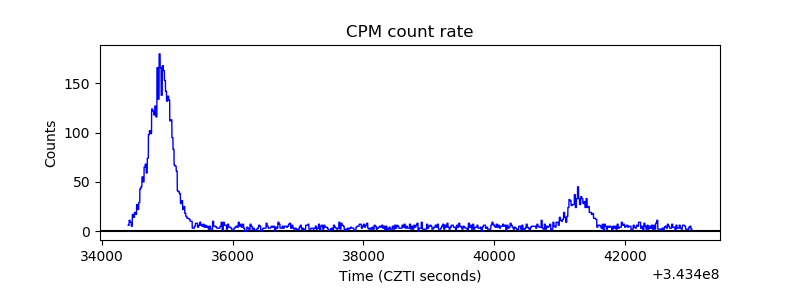 |
| CZT Counter | 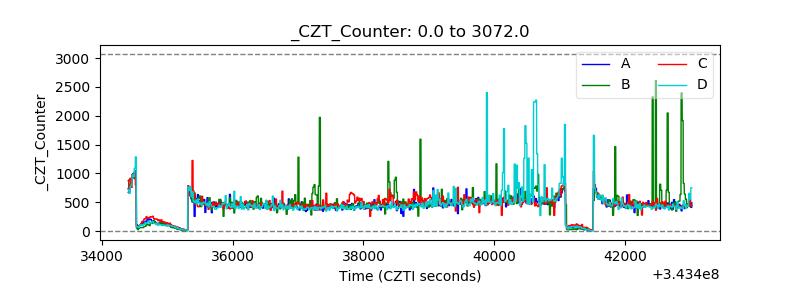 |
| +2.5 Volts monitor |  |
| +5 Volts monitor |  |
| _ROLL_ROT | 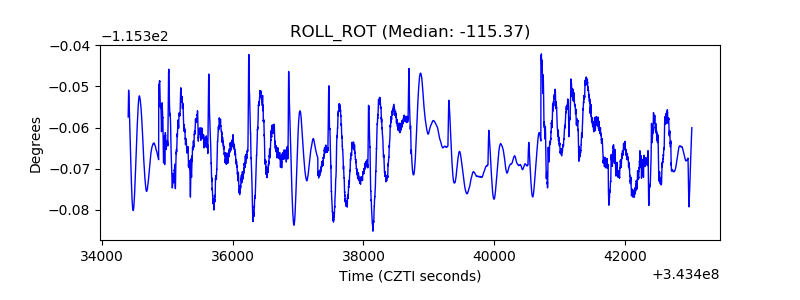 |
| _Roll_DEC | 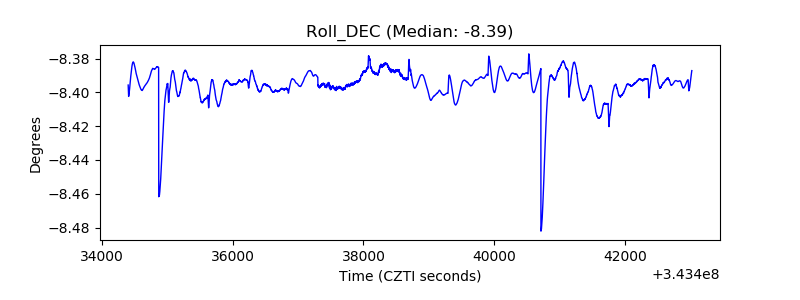 |
| _Roll_RA | 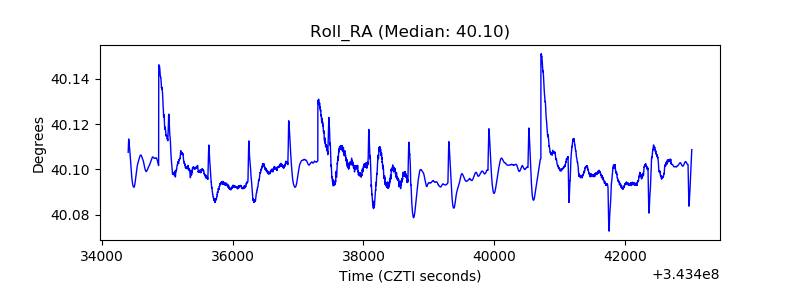 |
| Veto Counter | 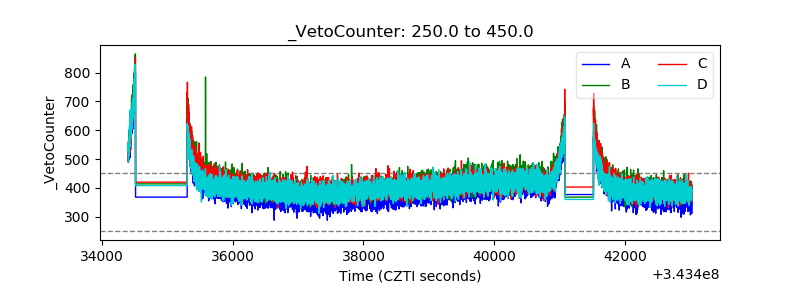 |