| Param | Original file | Final file |
|---|---|---|
| Filename | modeM0/AS1A10_016T02_9000004018_27811cztM0_level2.evt | modeM0/AS1A10_016T02_9000004018_27811cztM0_level2_quad_clean.evt |
| Size (bytes) | 477,069,120 | 69,468,480 |
| Size | 455.0 MB | 66.3 MB |
| Events in quadrant A | 2,657,700 | 462,979 |
| Events in quadrant B | 5,487,833 | 389,593 |
| Events in quadrant C | 2,731,607 | 424,249 |
| Events in quadrant D | 3,186,880 | 430,881 |
| Mode M0 | |||
|---|---|---|---|
| Quadrant | BADHDUFLAG | Total packets | Discarded packets |
| A | 0 | 11532 | 0 |
| B | 0 | 20208 | 0 |
| C | 0 | 11673 | 0 |
| D | 0 | 13286 | 0 |
| Mode M9 | |||
|---|---|---|---|
| Quadrant | BADHDUFLAG | Total packets | Discarded packets |
| A | 0 | 4 | 0 |
| B | 0 | 4 | 0 |
| C | 0 | 4 | 0 |
| D | 0 | 4 | 0 |
| Quadrant | Total seconds | Saturated seconds | Saturation percentage |
|---|---|---|---|
| A | 5647 | 17 | 0.301045% |
| B | 5648 | 1184 | 20.963173% |
| C | 5648 | 60 | 1.062323% |
| D | 5648 | 81 | 1.434136% |
Noise dominated data is calculated using 1-second bins in cleaned event files. If a bin has >2000 counts, and if more than 50% of those come from <1% of pixels, then it is considered to be noise-dominated and hence unusable.
| Quadrant | # 1 sec bins | Bins with >0 counts | Bins with >2000 counts | High rate bins dominated by noise | Noise dominated (total time) | Noise dominated (detector-on time) | Marked lightcurve |
|---|---|---|---|---|---|---|---|
| A | 6082 | 5648 | 0 | 0 | 0.00% | 0.00% | 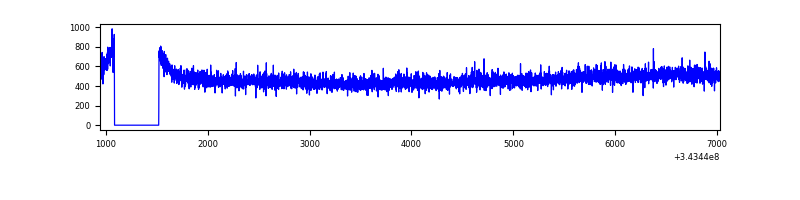 |
| B | 6083 | 5648 | 946 | 946 | 15.55% | 16.75% | 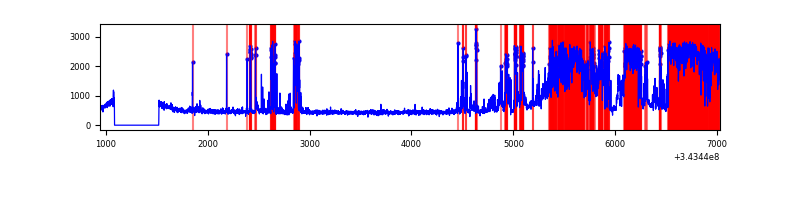 |
| C | 6083 | 5649 | 3 | 3 | 0.05% | 0.05% | 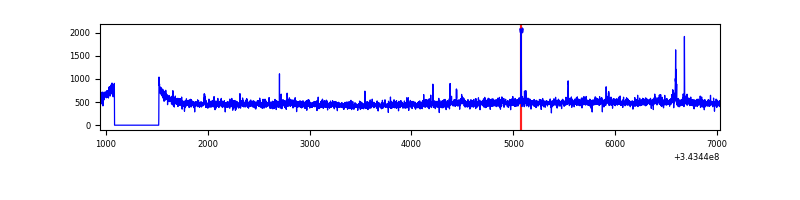 |
| D | 6083 | 5649 | 52 | 52 | 0.85% | 0.92% | 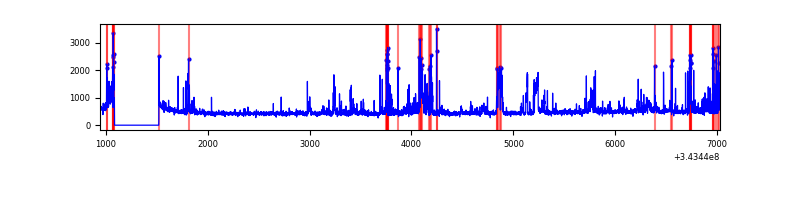 |
Top three noisy pixels from each quadrant. If the there are fewer than three noisy pixels in the level2.evt file, extra rows are filled as -1
| Pixel properties | Quadrant properties | ||||||
|---|---|---|---|---|---|---|---|
| Quadrant | DetID | PixID | Counts | Sigma | Mean | Median | Sigma |
| A | 13 | 254 | 8147 | 53.46 | 689 | 674 | 139.8 |
| A | 3 | 137 | 6694 | 43.07 | 689 | 674 | 139.8 |
| A | 0 | 226 | 5738 | 36.23 | 689 | 674 | 139.8 |
| B | 10 | 245 | 3023012 | 24820.3 | 617 | 599 | 121.8 |
| B | 3 | 64 | 36739 | 296.78 | 617 | 599 | 121.8 |
| B | 12 | 111 | 15113 | 119.19 | 617 | 599 | 121.8 |
| C | 14 | 238 | 104621 | 668.42 | 653 | 653 | 155.5 |
| C | 3 | 233 | 69466 | 442.41 | 653 | 653 | 155.5 |
| C | 4 | 175 | 7940 | 46.85 | 653 | 653 | 155.5 |
| D | 1 | 52 | 692186 | 4384.89 | 659 | 642 | 157.7 |
| D | 2 | 234 | 24629 | 152.09 | 659 | 642 | 157.7 |
| D | 14 | 226 | 6250 | 35.56 | 659 | 642 | 157.7 |
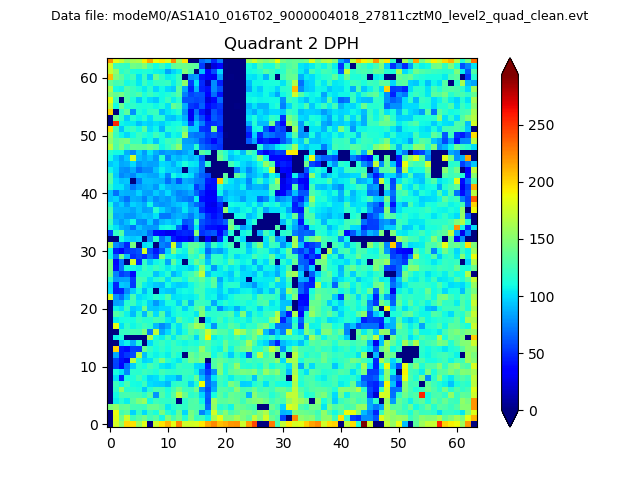
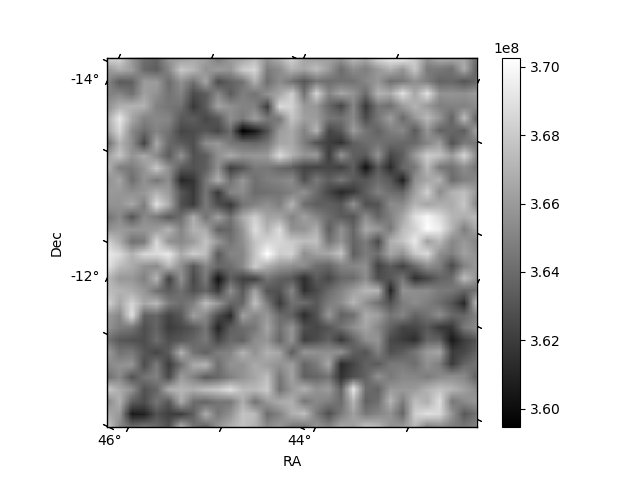
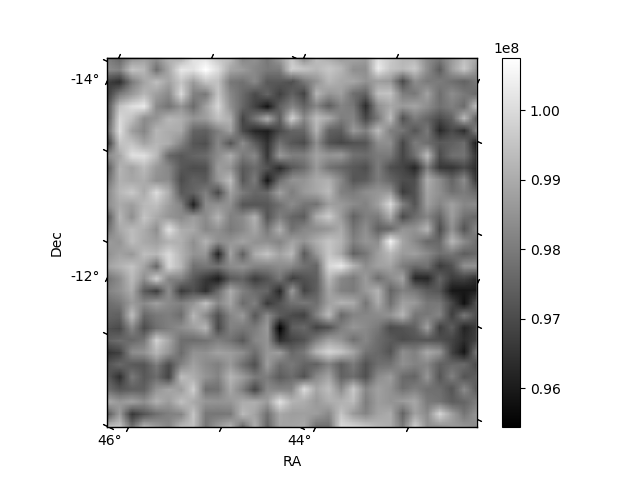
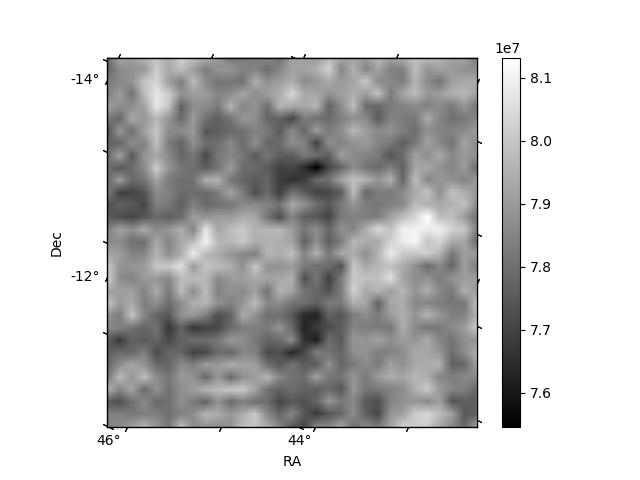
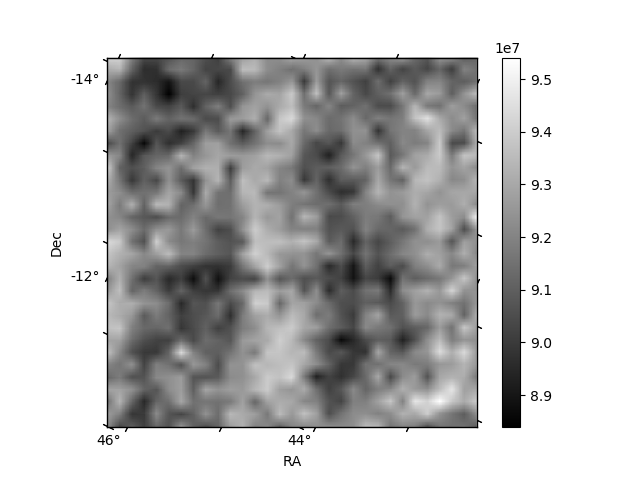
Histogram calculated using DETX and DETY for each event in the final _common_clean file
| Quadrant A | 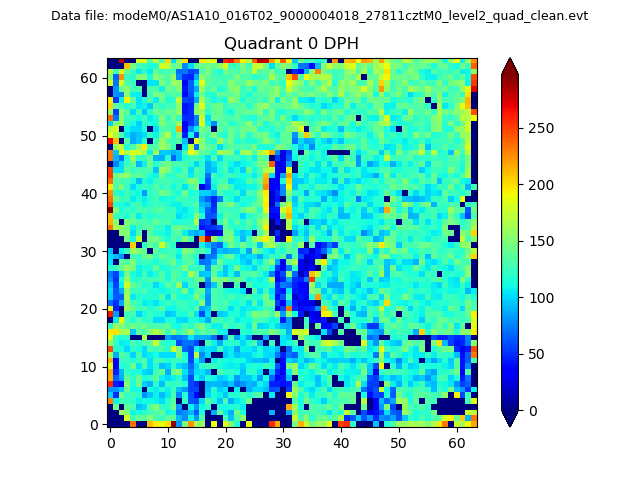 |
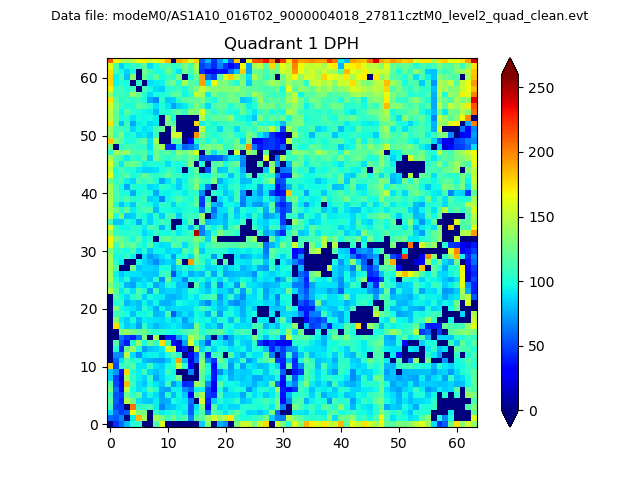 |
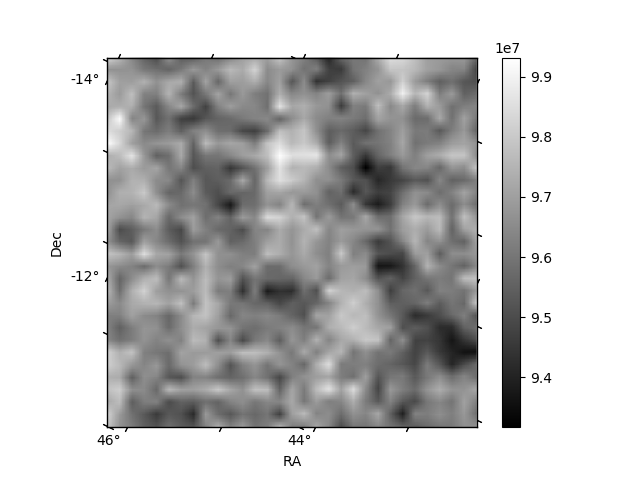
Quadrant B |
|---|---|---|---|
| Quadrant D | 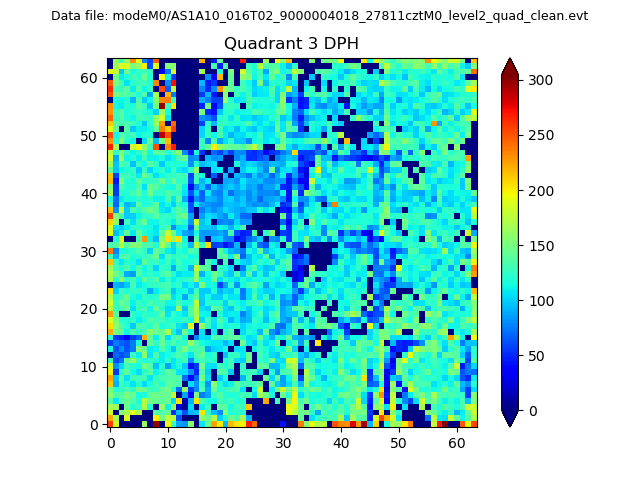 |
 |
Quadrant C |
| Plot type | Count rate plots | Images |
|---|---|---|
| Comparison with Poisson distribution Blue bars denote a histogram of data divided into 1 sec bins. Red curve is a Poisson curve with rate = median count rate of data. |
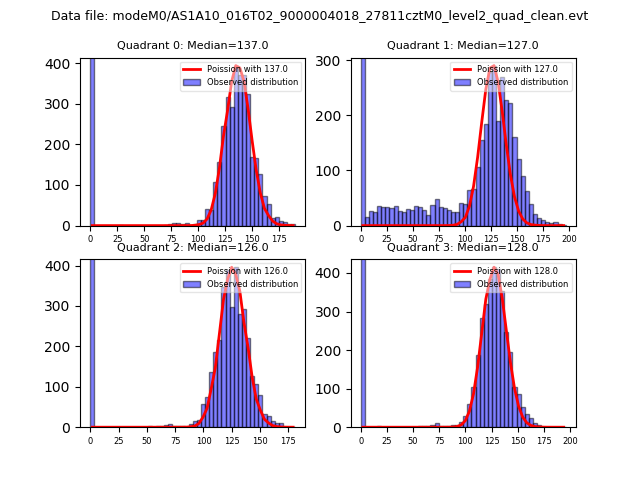 |
 |
| Quadrant-wise count rates Data is divided into 100 sec bins |
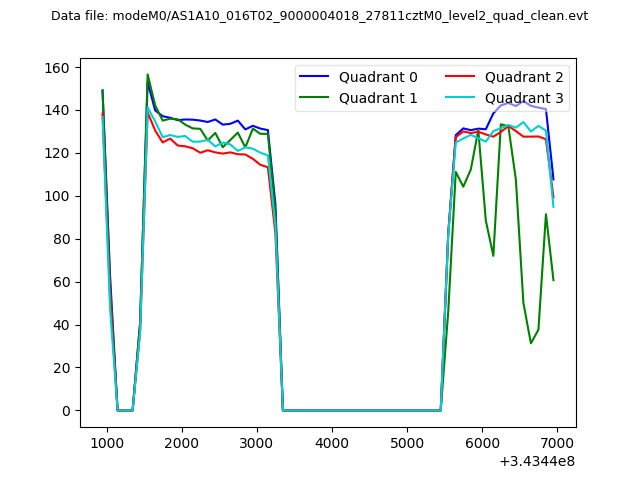 |
|
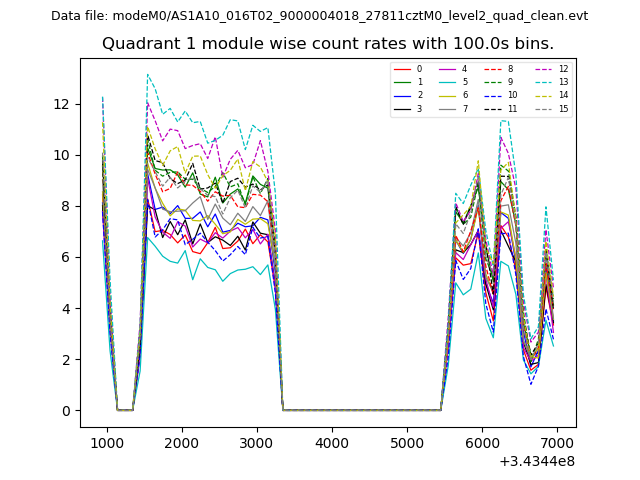
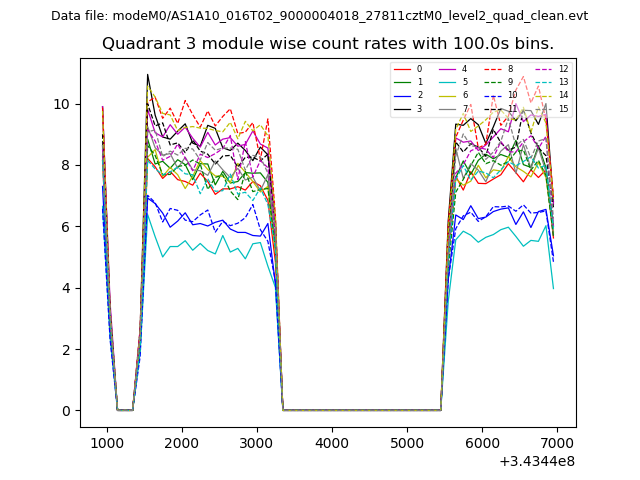
| Module-wise count rates for Quadrant A Data is divided into 100 sec bins |
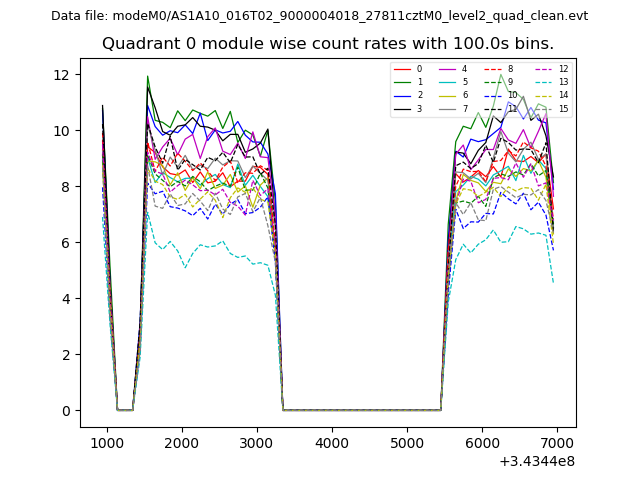 |
 |
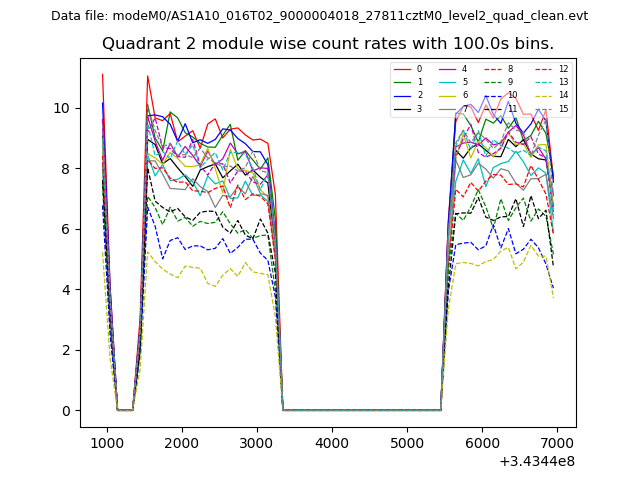
| Module-wise count rates for Quadrant B Data is divided into 100 sec bins |
 |
 |
| Module-wise count rates for Quadrant C Data is divided into 100 sec bins |
 |
 |
| Module-wise count rates for Quadrant D Data is divided into 100 sec bins |
 |
 |
| Parameter | Plot |
|---|---|
| CZT HV Monitor | 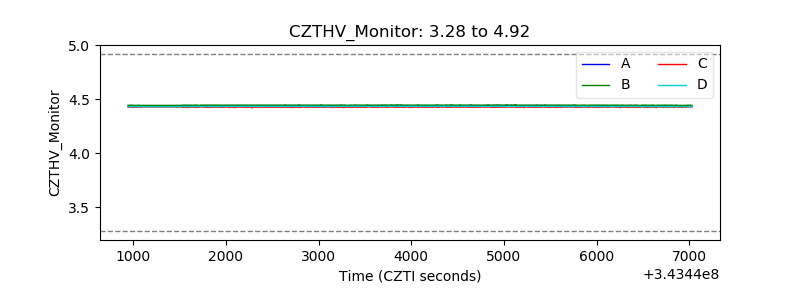 |
| D_VDD | 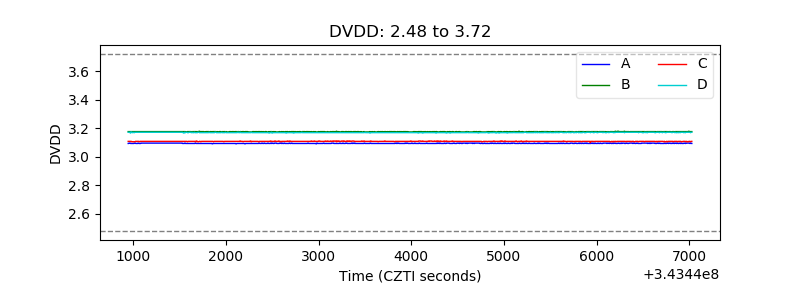 |
| Temperature 1 | 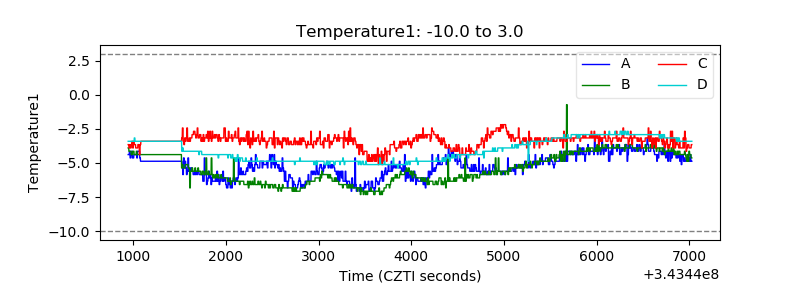 |
| Veto HV Monitor | 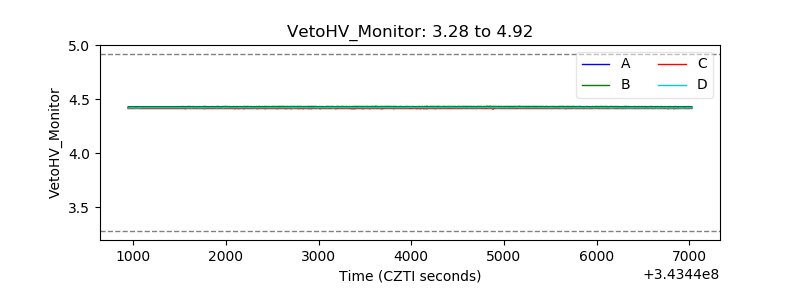 |
| Veto LLD | 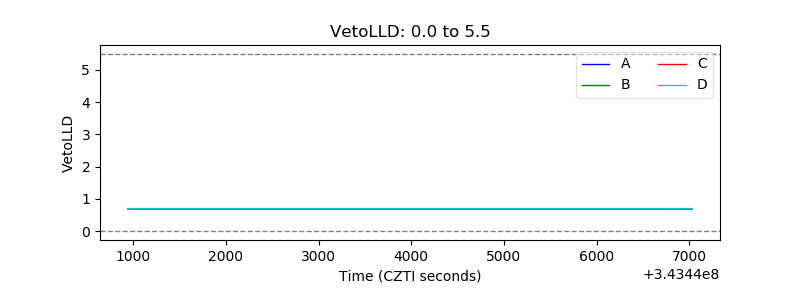 |
| Alpha Counter | 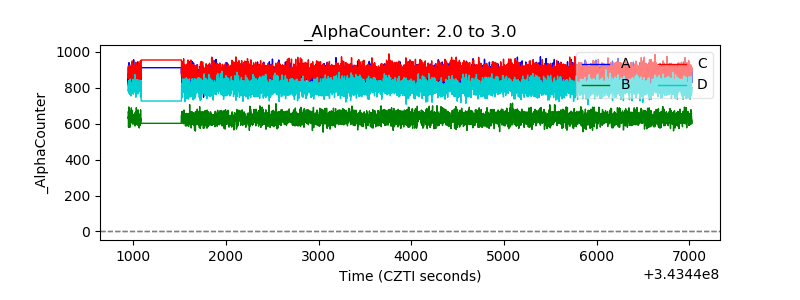 |
| _CPM_Rate | 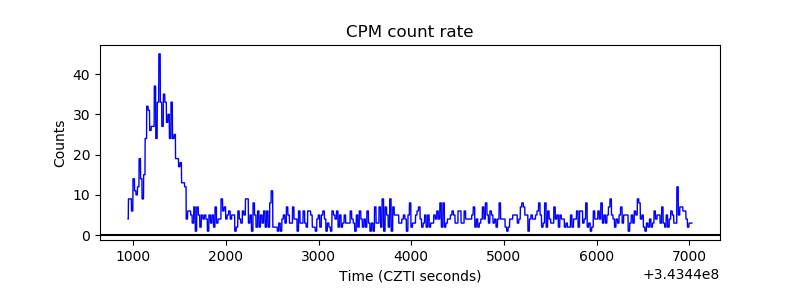 |
| CZT Counter | 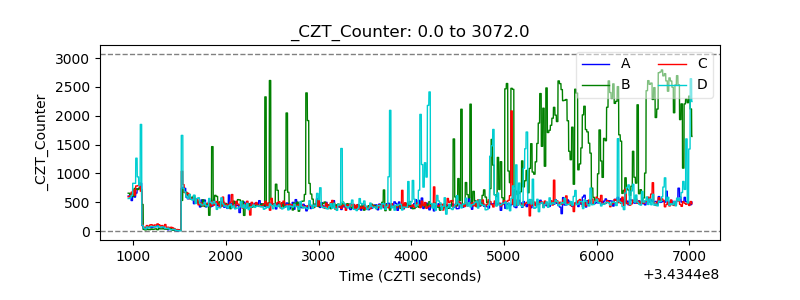 |
| +2.5 Volts monitor |  |
| +5 Volts monitor |  |
| _ROLL_ROT | 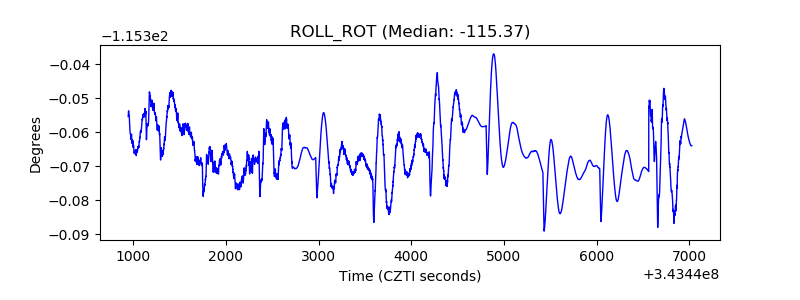 |
| _Roll_DEC | 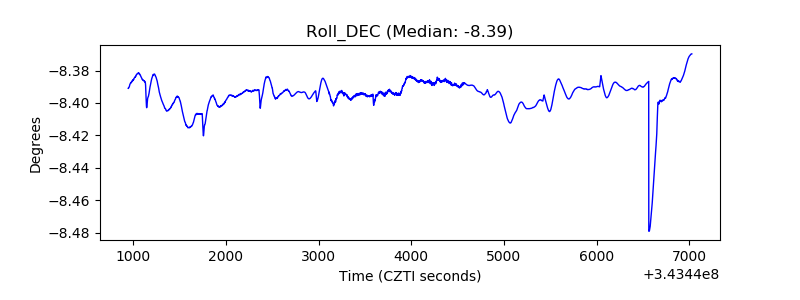 |
| _Roll_RA | 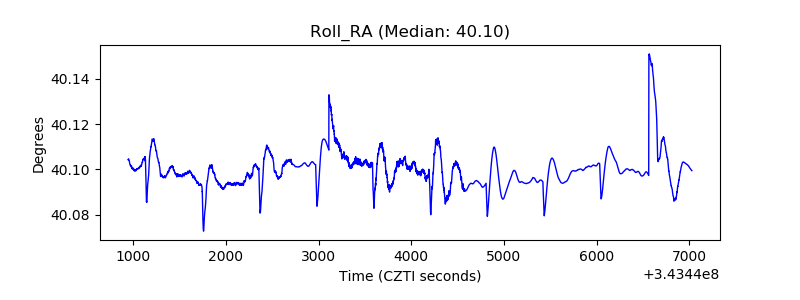 |
| Veto Counter | 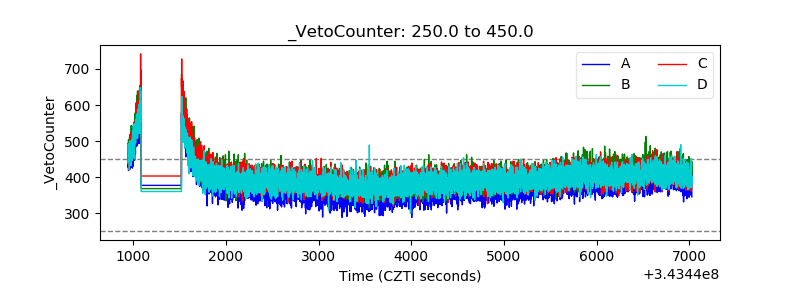 |