| Param | Original file | Final file |
|---|---|---|
| Filename | modeM0/AS1A10_048T08_9000004020cztM0_level2.fits | modeM0/AS1A10_048T08_9000004020cztM0_level2_quad_clean.evt |
| Size (bytes) | 1,040,184,000 | 916,542,720 |
| Size | 992.0 MB | 874.1 MB |
| Events in quadrant A | 6,491,042 | 5,429,095 |
| Events in quadrant B | 6,114,742 | 5,343,861 |
| Events in quadrant C | 6,188,792 | 5,088,437 |
| Events in quadrant D | 5,421,682 | 4,611,159 |
| Mode M0 | |||
|---|---|---|---|
| Quadrant | BADHDUFLAG | Total packets | Discarded packets |
| A | 0 | 221931 | 0 |
| B | 0 | 243790 | 0 |
| C | 0 | 237387 | 0 |
| D | 0 | 273044 | 0 |
| Mode SS | |||
|---|---|---|---|
| Quadrant | BADHDUFLAG | Total packets | Discarded packets |
| A | 0 | 2162 | 0 |
| B | 0 | 2162 | 0 |
| C | 0 | 2162 | 0 |
| D | 0 | 2162 | 0 |
| Mode M9 | |||
|---|---|---|---|
| Quadrant | BADHDUFLAG | Total packets | Discarded packets |
| A | 0 | 161 | 0 |
| B | 0 | 161 | 0 |
| C | 0 | 161 | 0 |
| D | 0 | 161 | 0 |
| Quadrant | Total seconds | Saturated seconds | Saturation percentage |
|---|---|---|---|
| A | 106297 | 1075 | 1.011317% |
| B | 106297 | 3085 | 2.902246% |
| C | 106297 | 2307 | 2.170334% |
| D | 106297 | 3726 | 3.505273% |
Noise dominated data is calculated using 1-second bins in cleaned event files. If a bin has >2000 counts, and if more than 50% of those come from <1% of pixels, then it is considered to be noise-dominated and hence unusable.
| Quadrant | # 1 sec bins | Bins with >0 counts | Bins with >2000 counts | High rate bins dominated by noise | Noise dominated (total time) | Noise dominated (detector-on time) | Marked lightcurve |
|---|---|---|---|---|---|---|---|
| A | 122187 | 106279 | 0 | 0 | 0.00% | 0.00% |  |
| B | 122187 | 106263 | 0 | 0 | 0.00% | 0.00% |  |
| C | 122187 | 106275 | 0 | 0 | 0.00% | 0.00% |  |
| D | 122187 | 106206 | 0 | 0 | 0.00% | 0.00% |  |
Top three noisy pixels from each quadrant. If the there are fewer than three noisy pixels in the level2.evt file, extra rows are filled as -1
| Pixel properties | Quadrant properties | ||||||
|---|---|---|---|---|---|---|---|
| Quadrant | DetID | PixID | Counts | Sigma | Mean | Median | Sigma |
| A | 0 | 29 | 6130 | 11.02 | 1688 | 1579 | 413.0 |
| A | 7 | 110 | 5197 | 8.76 | 1688 | 1579 | 413.0 |
| A | 9 | 19 | 4903 | 8.05 | 1688 | 1579 | 413.0 |
| B | 2 | 9 | 4958 | 10.73 | 1621 | 1545 | 318.0 |
| B | 2 | 8 | 4184 | 8.3 | 1621 | 1545 | 318.0 |
| B | 3 | 17 | 4017 | 7.77 | 1621 | 1545 | 318.0 |
| C | 12 | 241 | 4239 | 6.55 | 1636 | 1523 | 414.8 |
| C | 9 | 209 | 4154 | 6.34 | 1636 | 1523 | 414.8 |
| C | 3 | 187 | 4121 | 6.26 | 1636 | 1523 | 414.8 |
| D | 7 | 3 | 3776 | 5.78 | 1548 | 1411 | 408.9 |
| D | 7 | 5 | 3708 | 5.62 | 1548 | 1411 | 408.9 |
| D | 1 | 31 | 3689 | 5.57 | 1548 | 1411 | 408.9 |
Histogram calculated using DETX and DETY for each event in the final _common_clean file
| Quadrant A |  |
 |
Quadrant B |
|---|---|---|---|
| Quadrant D | 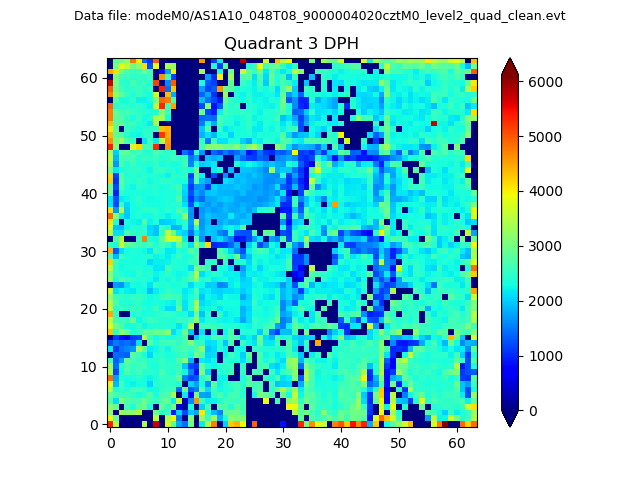 |
 |
Quadrant C |
| Plot type | Count rate plots | Images |
|---|---|---|
| Comparison with Poisson distribution Blue bars denote a histogram of data divided into 1 sec bins. Red curve is a Poisson curve with rate = median count rate of data. |
 |
 |
| Quadrant-wise count rates Data is divided into 100 sec bins |
 |
|
| Module-wise count rates for Quadrant A Data is divided into 100 sec bins |
 |
 |
| Module-wise count rates for Quadrant B Data is divided into 100 sec bins |
 |
 |
| Module-wise count rates for Quadrant C Data is divided into 100 sec bins |
 |
 |
| Module-wise count rates for Quadrant D Data is divided into 100 sec bins |
 |
 |
| Parameter | Plot |
|---|---|
| CZT HV Monitor |  |
| D_VDD | 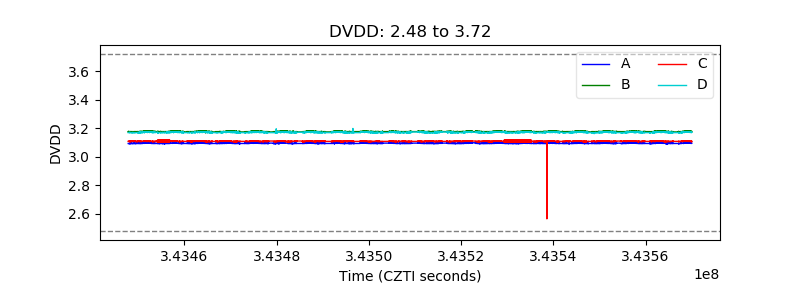 |
| Temperature 1 |  |
| Veto HV Monitor |  |
| Veto LLD |  |
| Alpha Counter |  |
| _CPM_Rate |  |
| CZT Counter |  |
| +2.5 Volts monitor |  |
| +5 Volts monitor |  |
| _ROLL_ROT |  |
| _Roll_DEC |  |
| _Roll_RA |  |
| Veto Counter |  |