| Param | Original file | Final file |
|---|---|---|
| Filename | modeM0/AS1A10_048T08_9000004020_27811cztM0_level2.evt | modeM0/AS1A10_048T08_9000004020_27811cztM0_level2_quad_clean.evt |
| Size (bytes) | 152,614,080 | 8,029,440 |
| Size | 145.5 MB | 7.7 MB |
| Events in quadrant A | 730,523 | 33,945 |
| Events in quadrant B | 2,180,452 | 26,925 |
| Events in quadrant C | 802,388 | 32,594 |
| Events in quadrant D | 798,648 | 32,380 |
| Mode M0 | |||
|---|---|---|---|
| Quadrant | BADHDUFLAG | Total packets | Discarded packets |
| A | 0 | 3250 | 0 |
| B | 0 | 7541 | 0 |
| C | 0 | 3344 | 0 |
| D | 0 | 3496 | 0 |
| Quadrant | Total seconds | Saturated seconds | Saturation percentage |
|---|---|---|---|
| A | 1576 | 4 | 0.253807% |
| B | 1575 | 568 | 36.063492% |
| C | 1575 | 19 | 1.206349% |
| D | 1575 | 26 | 1.650794% |
Noise dominated data is calculated using 1-second bins in cleaned event files. If a bin has >2000 counts, and if more than 50% of those come from <1% of pixels, then it is considered to be noise-dominated and hence unusable.
| Quadrant | # 1 sec bins | Bins with >0 counts | Bins with >2000 counts | High rate bins dominated by noise | Noise dominated (total time) | Noise dominated (detector-on time) | Marked lightcurve |
|---|---|---|---|---|---|---|---|
| A | 1576 | 1576 | 0 | 0 | 0.00% | 0.00% | 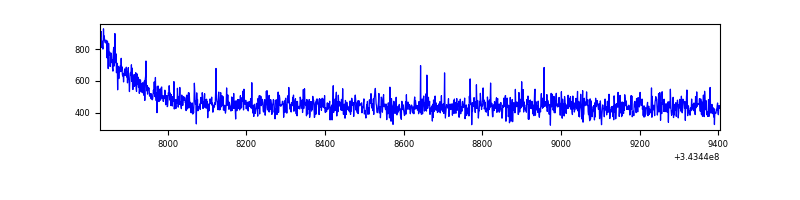 |
| B | 1574 | 1574 | 427 | 427 | 27.13% | 27.13% | 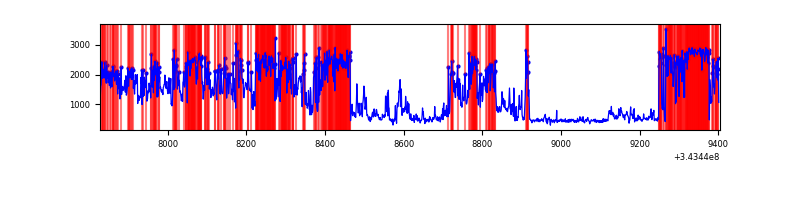 |
| C | 1575 | 1575 | 0 | 0 | 0.00% | 0.00% | 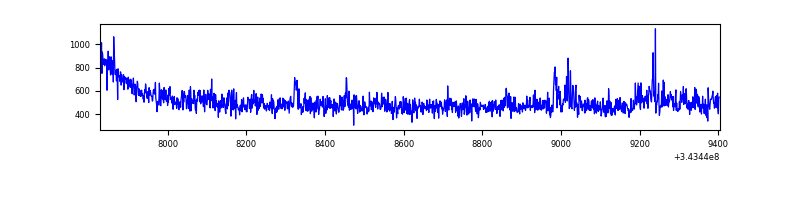 |
| D | 1575 | 1575 | 24 | 24 | 1.52% | 1.52% | 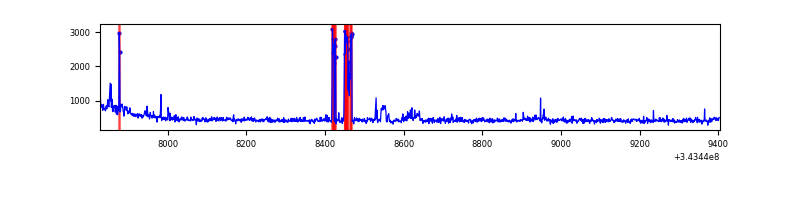 |
Top three noisy pixels from each quadrant. If the there are fewer than three noisy pixels in the level2.evt file, extra rows are filled as -1
| Pixel properties | Quadrant properties | ||||||
|---|---|---|---|---|---|---|---|
| Quadrant | DetID | PixID | Counts | Sigma | Mean | Median | Sigma |
| A | 13 | 254 | 2646 | 60.76 | 189 | 185 | 40.5 |
| A | 3 | 137 | 1858 | 41.31 | 189 | 185 | 40.5 |
| A | 0 | 226 | 1455 | 31.36 | 189 | 185 | 40.5 |
| B | 10 | 245 | 1530817 | 43630.37 | 165 | 161 | 35.1 |
| B | 12 | 111 | 4190 | 114.84 | 165 | 161 | 35.1 |
| B | 11 | 111 | 3785 | 103.3 | 165 | 161 | 35.1 |
| C | 3 | 233 | 47617 | 1033.31 | 185 | 186 | 45.9 |
| C | 14 | 238 | 29449 | 637.51 | 185 | 186 | 45.9 |
| C | 13 | 61 | 1364 | 25.66 | 185 | 186 | 45.9 |
| D | 1 | 52 | 106674 | 2316.2 | 182 | 177 | 46.0 |
| D | 2 | 234 | 6326 | 133.73 | 182 | 177 | 46.0 |
| D | 14 | 35 | 3735 | 77.38 | 182 | 177 | 46.0 |
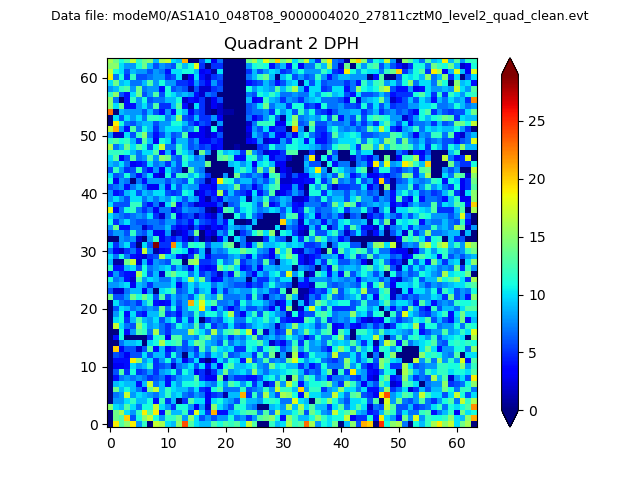
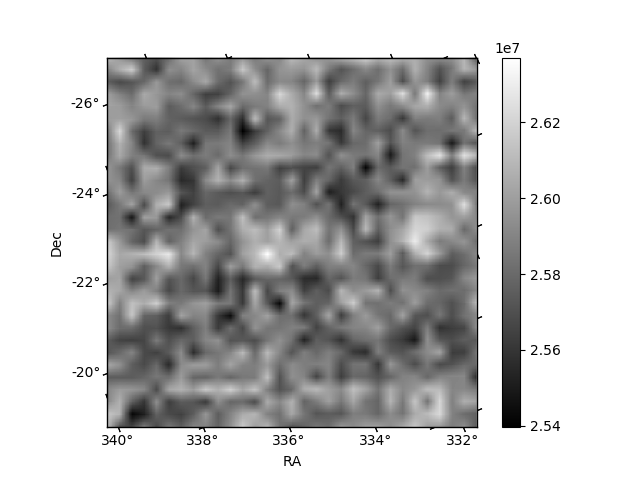
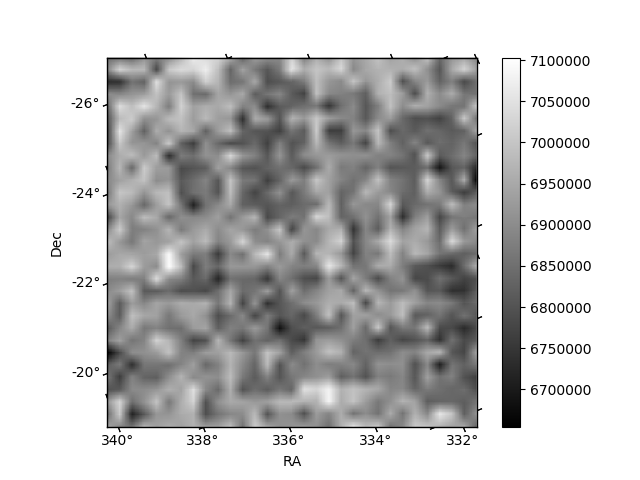
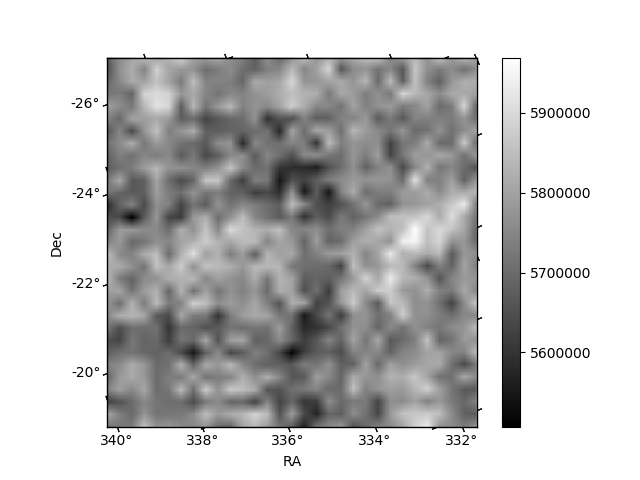
Histogram calculated using DETX and DETY for each event in the final _common_clean file
| Quadrant A | 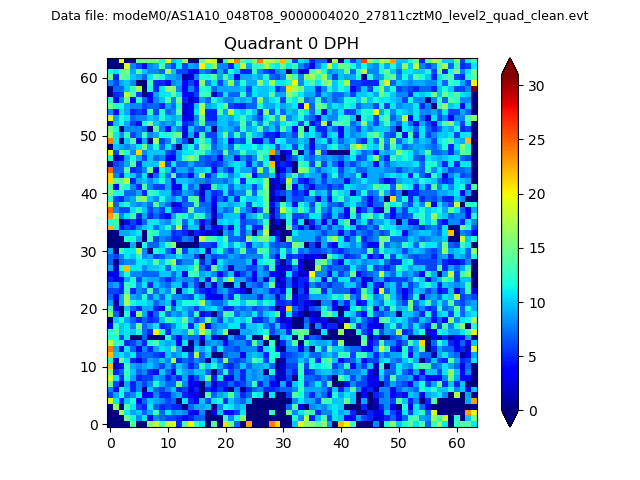 |
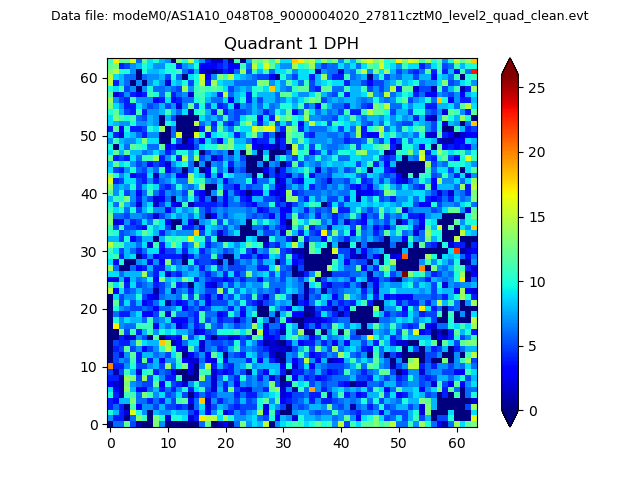 |
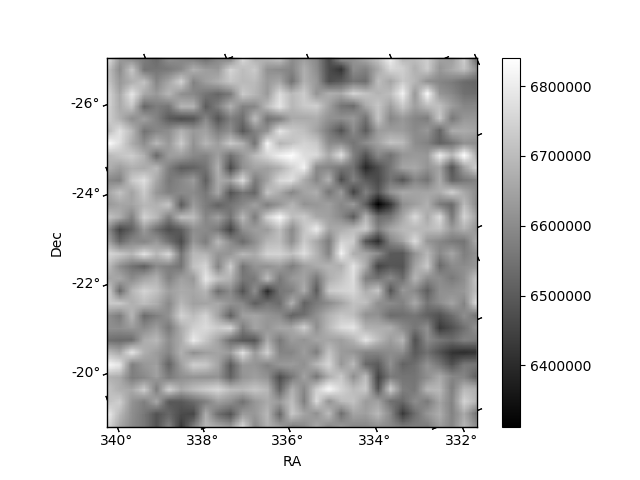
Quadrant B |
|---|---|---|---|
| Quadrant D | 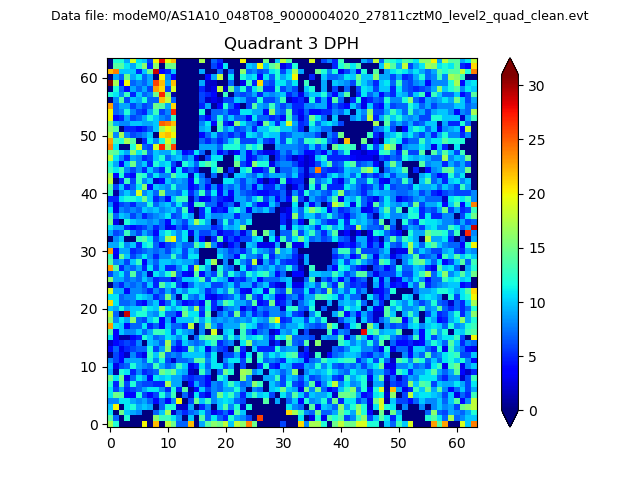 |
 |
Quadrant C |
| Plot type | Count rate plots | Images |
|---|---|---|
| Comparison with Poisson distribution Blue bars denote a histogram of data divided into 1 sec bins. Red curve is a Poisson curve with rate = median count rate of data. |
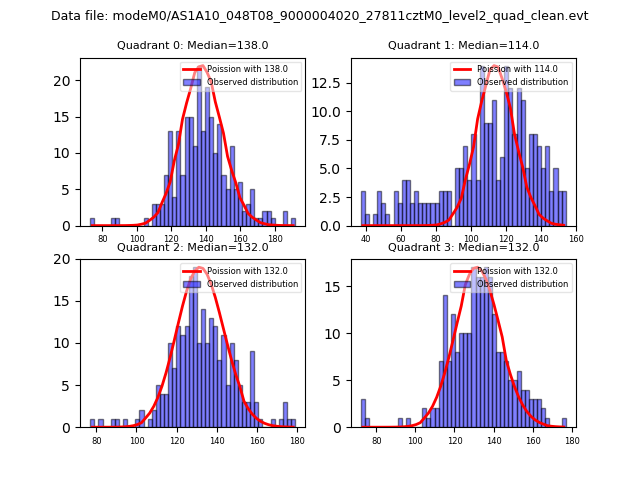 |
 |
| Quadrant-wise count rates Data is divided into 100 sec bins |
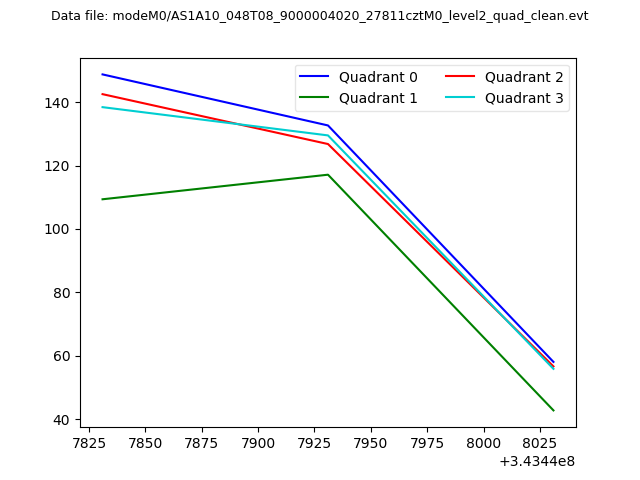 |
|
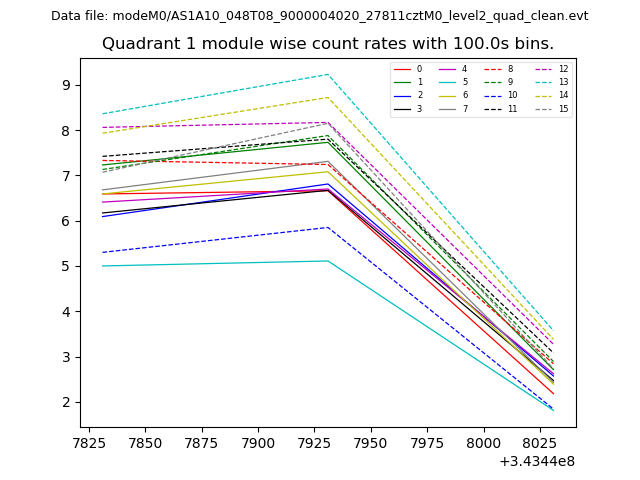
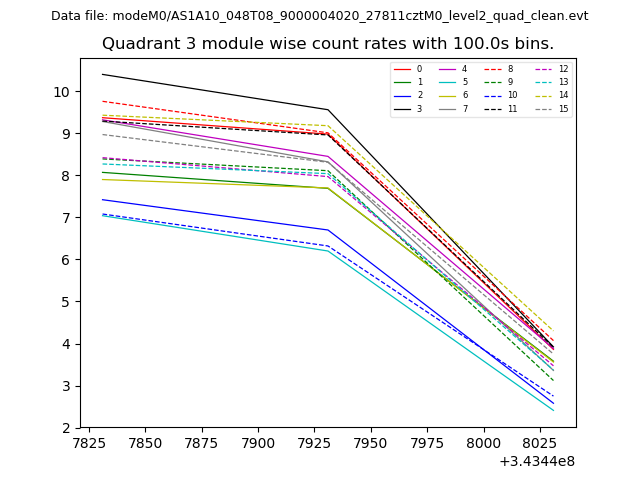
| Module-wise count rates for Quadrant A Data is divided into 100 sec bins |
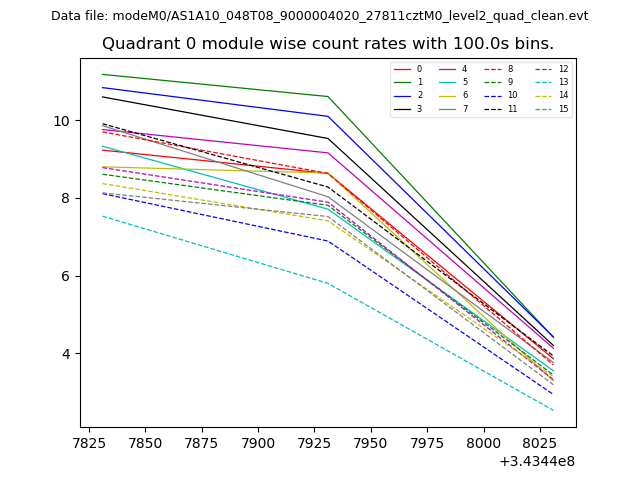 |
 |
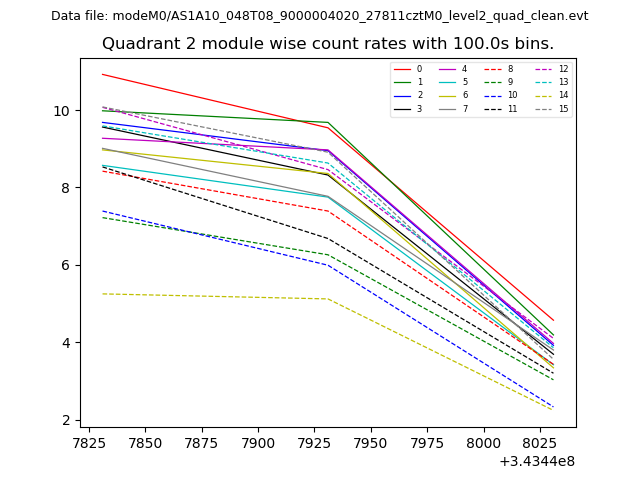
| Module-wise count rates for Quadrant B Data is divided into 100 sec bins |
 |
 |
| Module-wise count rates for Quadrant C Data is divided into 100 sec bins |
 |
 |
| Module-wise count rates for Quadrant D Data is divided into 100 sec bins |
 |
 |
| Parameter | Plot |
|---|---|
| CZT HV Monitor | 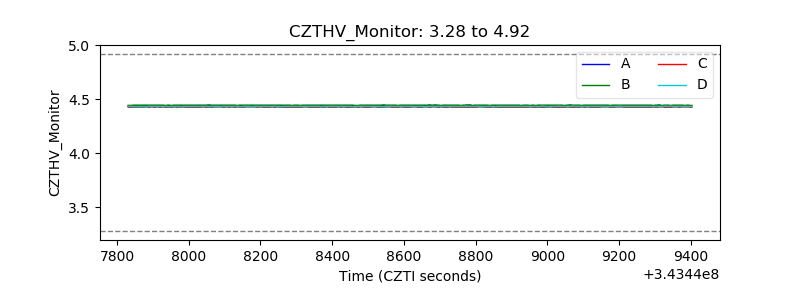 |
| D_VDD | 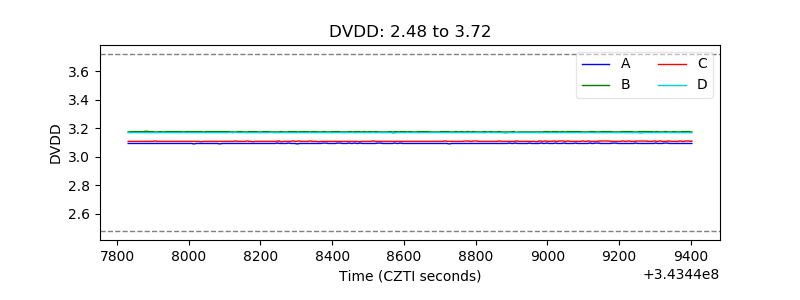 |
| Temperature 1 | 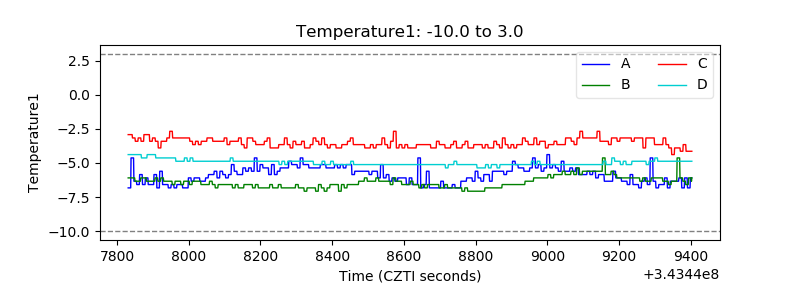 |
| Veto HV Monitor | 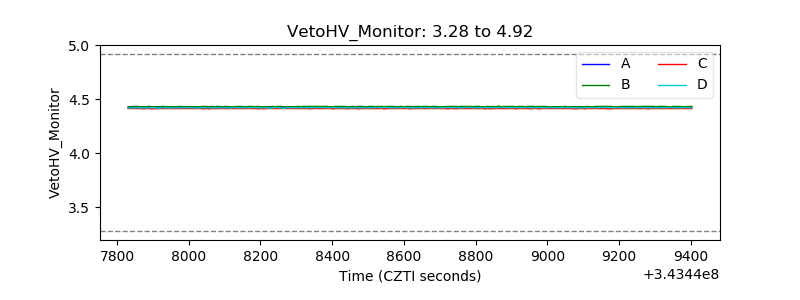 |
| Veto LLD | 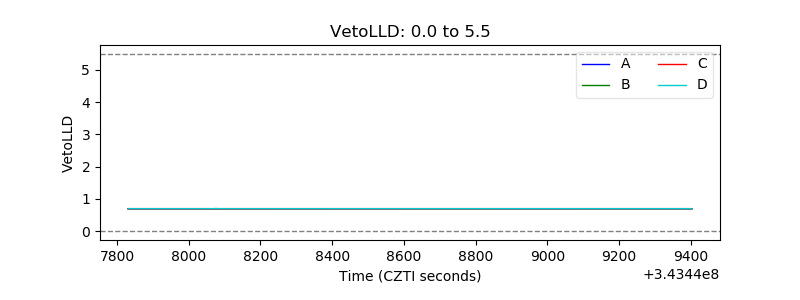 |
| Alpha Counter | 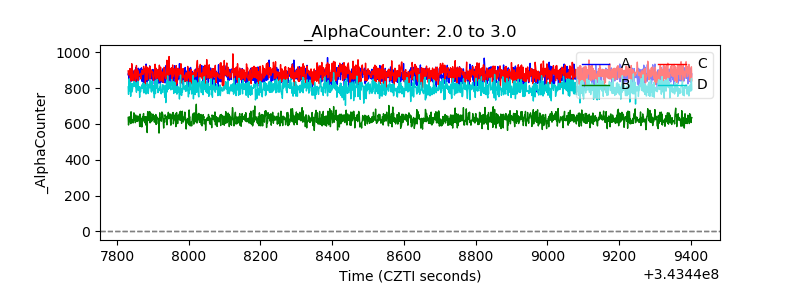 |
| _CPM_Rate | 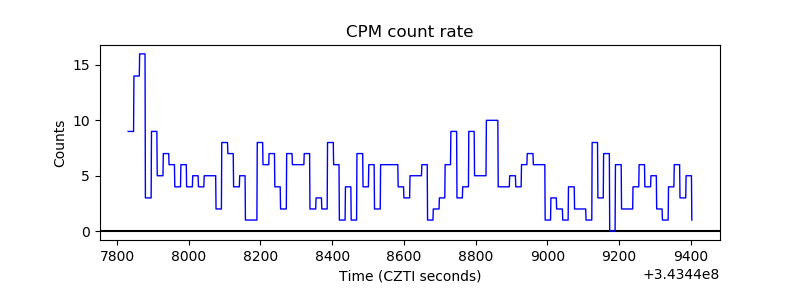 |
| CZT Counter | 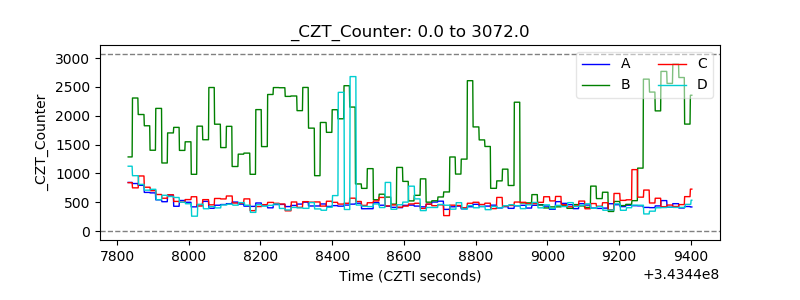 |
| +2.5 Volts monitor |  |
| +5 Volts monitor |  |
| _ROLL_ROT | 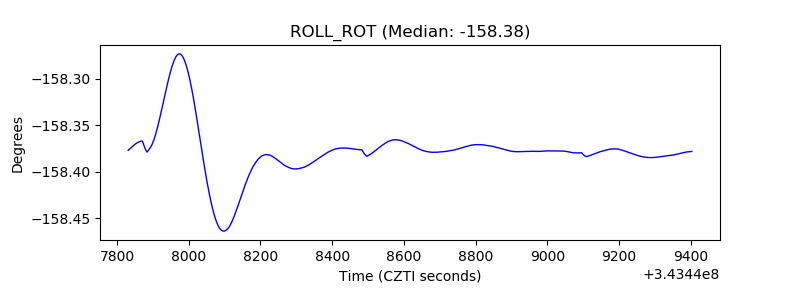 |
| _Roll_DEC | 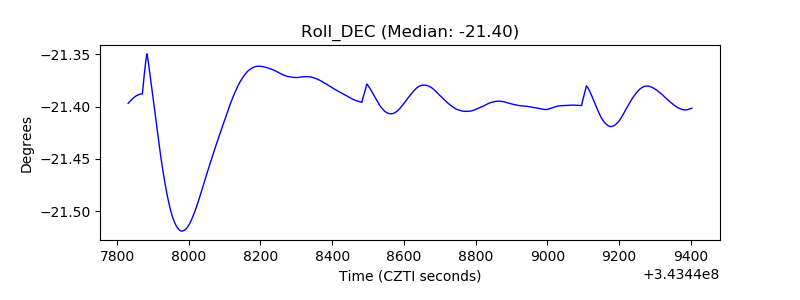 |
| _Roll_RA |  |
| Veto Counter | 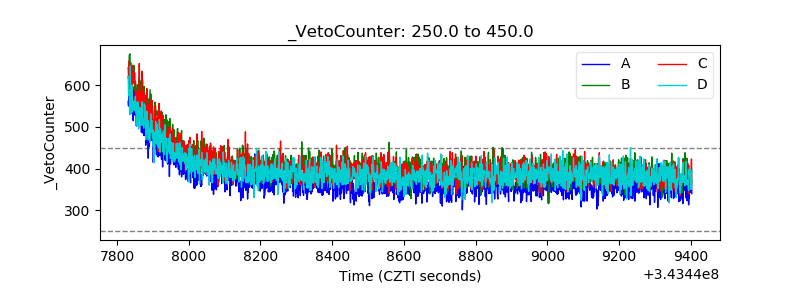 |